

Abstract
Food Security is a multifaceted aspect covering nutrition, availability, sufficiency, accessibility and safety. Millennium Development Goals as framed by United Nations focused to attain food security for all. The biggest hindrance in attaining food security was less productivity due to lack of enough resources. In order to increase the availability and produce sufficient food, malpractices like growing food on contaminated land or using untreated wastewater for irrigation came into play. Such practices have led to the transfer of heavy metals, pathogens and other harmful toxins to food crops. Various studies across the world have documented high concentration of heavy metals in vegetable crops. Root tubers and succulent stems are hyperaccumulators of heavy metals and thus tend to pose health hazard to the consuming population. In many instances the content of toxic metals in vegetables is much beyond permissible limits. Hazard quotient assessment in various studies has shown that consumption of these vegetables can be toxic to both adults and children. So, the question arises are we really attaining the global food security? There is a need to find a solution to produce sufficient, safe and nutritious food for the civilization so as to meet the goal of “zero hunger”.
Keywords: Food security, Heavy metals, Vegetables, Hyperaccumulators
Introduction
During FAO et al. (2015), 182 countries committed to eradicate hunger and reduce the undernourished population by 2015. The policy planning throughout the world is focused to fight the hunger stress and provide the major fundamental right to each individual alive. In 2000, members of the United Nations collectively formulated Millennium Development Goals which targeted the reduction of chronically hungry population to half (FAO et al. 2015). As we observe the history behind the development of concept of food security we realize that this concept originated in 1970s due to the social, economic and climatic circumstances. Occurrences of famine, lack of resources and economic and social disparity were identified as reasons for the macro-nutrient deficient population. Definition of food security has evolved from the concept of availability, accessibility and utility to stability, safety and nutritional quality. The multifaceted concept of food security is depicted in Fig. 1.
Fig. 1.
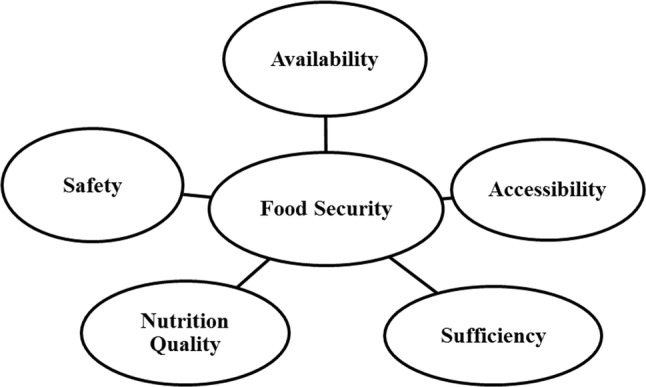
Multifaceted concept of food security
Food security is multi-faceted idea and is expected to be attained when “everyone (each individual beyond any racial or economic discrimination) and always” (throughout the year without being affected by the seasons and climatic factors) has access (no hindrance of transportation or distribution) to “sufficient (supplying all macro and micro nutrients required) and safe” (free from contaminants, pathogens and/or toxins) food to lead healthy and active life (FAO and WHO 2011; FAO et al. 2015). So, mere availability of food doesn’t fulfill the concept of food security. It is important to have a safe and balanced diet having all the nourishment. Vegetables are thus the important portion of platter because of various nutritional benefits. But, many reports published in past decade have depicted the health hazard associated with consumption of vegetables in various parts of the world. The health hazard associated with vegetables is mainly due to high content of toxic metals present in these crops (Jolly et al. 2013; Sharma et al. 2016a).
Vegetables: nutrition or poison?
Consumption of vegetables in both raw and cooked forms is an essential part of diet throughout the world. Vegetables not only provide the micro-nutrients and trace elements but also act as buffering agents in the process of digestion (Jolly et al. 2013). Vegetables add colour to the plate and thus also trigger the salivating glands. It has been reported that the consumption of vegetables in cooked or raw form, significantly lower cancer instances especially, gastric cancers. According to WHO/FAO, consumption of 400 g of vegetables by an individual per day is essential to combat various cardiac problems, cancer and obesity (Kanungsukkasem et al. 2009; National Institute of Nutrition 2011). WHO (2003) claims that globally, 2.7 million lives can be saved annually by consuming sufficient vegetables. Various parts of plants including inflorescences, leaves, fruits, tubers are consumed as the vegetable. A closer view of literature suggests that the average consumption of vegetables per capita per day in India, Mali and Pakistan is mere 100 g or less, while in Australia, Europe and USA is 300 g (Kanungsukkasem et al. 2009). Low consumption of vegetables is attributed to less availability or less production causing the increase in price of food commodities.
Crop yield is reliant mainly upon natural resource availability and climatic conditions. Being micro scale conditions, climatic factors generally do not cause large scale impact on production. Thus, resource availability i.e. fertile land and sufficient water for irrigation becomes the major determinant for crop yield. If we consider the availability of these resources, it is to be noted that per capita availability of arable land in 1960 was 0.45 ha (approx.) which was further reduced to 0.25 ha in 2009 (Bruinsma 2009). Also, decrease in availability of fresh water because of increasing needs, injudicious use and climatic changes has also drastically affected agricultural yield. But, despite lack of availability of resources United Nations admitted that the implementation of the Millennium Development Goals has resulted in 50% decrease in the undernourished population in the developing nations from 1990 to 2015 (United Nations 2015). The question arises; “how this was achieved?”—the use of improper agricultural practices, over use of agrochemicals, cultivation on contaminated land which is not suitable for food production and utilizing wastewater for irrigation were the steps that were adopted to increase the crop yield and availability. The present review summarizes effects of haphazard planning to increase food production in order to attain Millennium development goals.
Irrigation with wastewater
Water is considered as an elixir of life, the survival and sustenance of life is dependent upon water. Although, 70% of our planet is water, only 3% of that is fresh water and a major portion of this 3% is frozen in glaciers, leading to deprivation of water for 1.1 million people (WWF 2016). Thus, shortage of irrigation water is in many parts of the world, specifically in arid and semi-arid regions. Use of treated wastewater is projected to be an alternative for irrigation in these areas (Angelakis et al. 2005). Utilizing wastewater for irrigation is considered to be helpful in recycling nutrients and water to the soil as the presence of organic content in wastewater can increase the fertility of some kind of soils. However, higher content of organic matter can lead to decrease in soil porosity and clogging of irrigation equipment. Wastewater can also add moderate levels of salts and nutrients like N, P and K to soil (Mahmoud et al. 2003). Using wastewater generated from various sources for irrigation can prevent problems associated with discharge of wastewater on surface water bodies which lead to depletion of oxygen and eutrophication (World Bank 2010). Adding human waste or wastewater generated from household to the agricultural farms isn’t a new process; this reuse strategy is documented to be about 4000 years old (Angelakis et al. 2005). During past few decades, the shortage of water resources and increase in food demand has led to a sharp increase in usage of wastewater as irrigation water source.
80–90% of water supplied to household, commercial and industrial places is not consumed but is added back to the environment as wastewater or sewage water (Asano et al. 2007). Van der Hoek (2004) identified that wastewater is mostly generated from urban activities which can be combination of domestic effluent (containing human feces, kitchen and bathroom wastewater), industrial discharge (may contain hazardous chemicals), commercial, institutional and hospital discharge. In most of the developing and under-developed countries there is direct usage of wastewater for agriculture i.e. untreated and raw wastewater is used for irrigation (WHO 2006). Across the world about 20 million hectares of land producing 10% of crop is irrigated with untreated wastewater (Jiménez and Asano 2008). The untreated wastewater can contain disease causing microbes, certain toxins, drugs and toxic metals among other things. Thus, the risk associated with consumption of food growing in areas irrigated with wastewater is extremely high (Singh et al. 2009). The transfer of pathogens and diseases through vegetable consumption is noticed and documented (World Bank 2010). Also, a major issue of transfer of toxic chemicals and metals by consumption of wastewater irrigated food crops is widely reported (Singh et al. 2009; Boamponsem et al. 2012; Orisakwe et al. 2012b; Jolly et al. 2013).
Apart from water, the other resource required for agriculture is land. Since, there is a less availability of arable land; the cultivation of agricultural crops is carried out in areas not suitable for cultivation, as they are either contaminated or in the vicinity of industrial areas (Luo et al. 2011).
Cultivation on contaminated land
Increasing pace of urbanization and commercialization has led to a decrease in per capita availability of arable land across the world. The cultivation of food crops on contaminated land is being carried out throughout the world (Chove et al. 2006; Luo et al. 2011). Cultivation on contaminated sites like mining sites, landfill sites, sites near industries etc. led to accumulation of toxins in the plants which thus enter food chain (Harmanescu et al. 2011). Across the world, many studies are carried out to estimate the content of heavy metals in the soil samples of contaminated sites and their accumulation in the plants grown on those sites.
Heavy metals present in soil are considered to be the major cause of the genotoxic nature of soil. The soil of contaminated areas is known to be genotoxic for the plants and produces many stress responses in plants growing in those areas. As a result of this practice, the heavy metals are taken up and accumulated in food crops and are thus transferred to the food chain (Harmanescu et al. 2011).
Heavy metals in soil
Soil is an important medium for the sustenance of life. It acts as a sink for nutrients and provides a medium for the completion of various biogeochemical cycles. As discussed, heavy metals are added to soil through natural weathering of rocks, discharge of polluted waste and wastewater on soil, deposition from atmosphere etc. The subtle danger related to presence of these metals in soil lies in their being genotoxic/mutagenic.
High content of heavy metals in agricultural soil in many parts of the world is reported (Zhuang et al. 2009). Irrigation of agricultural land of Central Punjab Province of Pakistan with wastewater was reported to increase the buildup of toxic metals such as nickel (Ni), copper (Cu), chromium (Cr), cadmium (Cd) and cobalt (Co) in the soil samples. In Dar es Salaam City, Tanzania, the concentration of lead in soil samples was reported to be 22.85 mg/kg, the maximum concentration of chromium in soil samples of the area was 502.33 mg/kg and that of copper was 21.073 mg/kg. Also, it was reported that the content of heavy metal was highest in the top layer and decreased downwards (Mwegoha and Kihampa 2010). Singh et al. (2009) estimated the effect of wastewater irrigation on the agricultural crops and reported increase in bioavailability of heavy metals. Also, they found that availability of metals to plants was negatively correlated to the pH of soil. The most abundant metal was manganese in wastewater irrigated sites followed by zinc (Zn), copper, lead and chromium (Singh et al. 2009). In a study carried out at Zimbabwe, effects of long term irrigation with wastewater were estimated on maize crop. The study showed that the concentration of copper, zinc, cadmium, nickel and chromium in soils was more than the permissible limits. In another study carried out in Bangalore city of India, it was found that the soil receiving the sewage water had maximum concentration of chromium followed by lead, nickel and cadmium. In a fly ash contaminated site near thermal power plant in Uttar Pradesh, India concentration of cadmium was found to be maximum followed by iron, nickel and lead (Singh et al. 2010). In Dongguan City, Guangdong, China the concentrations of copper (105.60 mg/kg), zinc (169.50 mg/kg), nickel (57.46 mg/kg), lead (137.20 mg/kg), cadmium (0.67 mg/kg) and mercury (Hg) (1.01 mg/kg) was reported to be much higher than background levels. In another study carried out across the Xiangjiang river, China concentration of Cd, Pb, Cu, Zn and Ni was found to be higher than the background levels (Wang et al. 2008). In Baoding City, China the sewage water irrigated soil had significantly higher concentration of Zn (153.77 mg/kg), Pb (38.35 mg/kg), Cu (35.06 mg/kg), Ni (29.81 mg/kg), and Cd (0.22 mg/kg) than the control soil (Xue et al. 2012). A study carried out in the industrial area of Dhaka, Bangladesh showed that the trend of heavy metal in soil (Fe > Zn > Ni > Cr > Pb > Cu > Cd) was almost similar to trend of heavy metals of sewage water (Fe > Cu > Zn > Cr > Pb > Ni > Cd) which was used for irrigation (Ahmad and Goni 2010). Significant heavy metal contamination (Tl, Pb, Cu, Zn, and Ni) of agricultural soil around a sulfuric acid factory was reported in Western Guangdong Province, China (Liu et al. 2012). In a study in Swat District, Pakistan contents of metals like, Cr, Cu, Mn, Ni and Zn in the soils were found to be correlated with the content of these metals in vegetables growing in those areas (Khan et al. 2013). In another study carried out in Beijing–Tianjin city cluster, China, the concentrations of heavy metal in wastewater irrigated agricultural soil were found to be within permissible range (Wang et al. 2012). Among 149 samples studied from Shandong Province, China 22 samples were found to be contaminated with higher concentration of Cd, Ni, Cu, or Hg (Liu et al. 2011). More than 100% increase in metals like Cd, Cu, Pb, Ni and Cr was reported in wastewater irrigated agricultural sites of dry tropical area of India (Singh et al. 2010). The content of copper in agricultural soil near Narora Atomic Power Station (NAPS), Narora, India was 27.95 mg/kg (Singh and Prasad 2014). In agricultural soils around Durgapur Industrial belt, India the concentration of Zn, Cu and Pb was found to be 205–255, 101–130, 118–177 µg/g respectively (Kisku et al. 2011). In industrial wastewater irrigated agricultural fields in Vadodra, Gujrat, India contents of heavy metals were found to be significantly higher concentration than of those irrigated with tubewell water and the trend of heavy metals in this soil was Fe > Mn > Zn > Cd > Cu > Pb > Cr > As (Tiwari et al. 2011). Concentration of Cd, Cu and Zn was reported to be more than the permissible limits in the agricultural soil in Gilgit, North Pakistan (Khan et al. 2010).
Heavy metals in vegetables
Food security was conceptualized wrongly as mere availability of food. Thus, increase in production to feed the macro-nutrient deficient population was the sole aim. Though, the target to reduce chronically hungry population was met but another most important dimension of food security, i.e., safety was ignored. Cultivation of vegetable crops on the contaminated sites or using the wastewater water for irrigation has led to an increase in the concentration of metals in the vegetable samples. The content of toxic metals in vegetable sample was reported high in many parts of the world (Singh et al. 2009; Harmanescu et al. 2011; Jolly et al. 2013; Sharma et al. 2016a, b; Orisakwe et al. 2012a).
Cadmium, considered as a potential carcinogen by USEPA has been reported at concentration beyond acceptable limits in vegetable samples from many parts of the world. Table 1 shows the summary of literature depicting content of cadmium in vegetable samples from some parts of the world. Lead is also identified as potential carcinogen. Vegetable crops growing in many parts of the world have high concentrations of lead. Table 2 shows the concentration of lead in vegetables samples across the world. Copper is an essential element for normal physiological functions of living organisms but the high concentration of copper is known to cause toxic effects to both plants and animals. Table 3 summarizes some studies on content of copper in some vegetable samples from some parts of the world.
Table 1.
Summary of some recent literature showing content of cadmium (mg/kg) in vegetable samples from some parts of the world
| S. no. | Country | Location | Spinach | Coriander | Lettuce | Turnip | Radish | Carrot | Brinjal | Cabbage | References |
|---|---|---|---|---|---|---|---|---|---|---|---|
| 1. | Bangladesh | Ruppur area, Pabna Distt, Bangladesh | < 0.06 | n.d | n.d | n.d | 0.65 | < 0.06 | < 0.06 | n.d | Jolly et al. (2013) |
| 2. | Bangladesh | Industrial areas, Dhaka, Bangladesh | n.d | n.d | n.d | n.d | n.d | n.d | 2.91 | 2.05 | Ahmad and Goni (2010) |
| 3. | Bangladesh | Central market Rajshahi City, Bangladesh | n.d | n.d | n.d | n.d | 1.178 | n.d | 1.388 | n.d | Saha and Zaman (2013) |
| 4. | Brazil | Sao Paulo State, Brazil | 0.13 | 0.16 | 0.08 | n.d | n.d | 0.03 | 0.04 | 0.04 | Guerra et al. (2012) |
| 5. | China | Wastewater Irrigated, Tongzhou Distt, Beijing, China | 0.75 | n.d | > 0.9 | 0.78 | 0.9 | n.d | n.d | 0.4 | Khan et al. (2008) |
| 6. | China | Near Dabaoshan mine in Guangdong, China | 3.8 | n.d | 4 | 2.9 | n.d | n.d | n.d | 1.8 | Zhuang et al. (2009) |
| 7. | China | Zhongxin (ZX), Near Dabaoshan Mine, China | n.d | n.d | 0.33 | 0.28 | 0.13 | 0.38 | 0.28 | 0.21 | Zhuang et al. (2008) |
| 8. | China | Vicinity of industrial zone in Jiangsu, China | 0.042 | n.d | 0.099 | n.d | n.d | n.d | 0.014 | 0.025 | Cao et al. (2010) |
| 9. | China | Zhejiang province, China | 0.03 | n.d | n.d | n.d | n.d | n.d | 0.015 | 0.01 | Huang et al. (2014) |
| 10. | China | Near e-waste processing site, China | n.d | n.d | 0.38 | n.d | 0.05 | 0.18 | n.d | n.d | Luo et al. (2011) |
| 11. | China | Beijing | 0.023 | n.d | n.d | n.d | 0.037 | 0.062 | 0.020 | Song et al. (2009) | |
| 12. | China | Wastewater Irrigated Beijing and Tianjin city cluster, China | n.d | n.d | 0.49 | n.d | 0.2 | n.d | n.d | 0.19 | Wang et al. (2012) |
| 13. | Ethiopia | Laelay Wukro | n.d | n.d | 0.30 | n.d | n.d | n.d | n.d | 0.20 | Gebrekidan et al. (2013) |
| 14. | Ethiopia | Addis Ababa, Ethiopia | n.d | n.d | 0.66 | n.d | n.d | n.d | n.d | 1.8 | Weldegebriel et al. (2012) |
| 15. | Ghana | Ghana Market | n.d | n.d | 0.08 | n.d | n.d | 0.03 | n.d | 0.15 | Bempah et al. (2011) |
| 16. | Greece | Industrial Area, North | 0.67 | n.d | 0.67 | n.d | n.d | 0.5 | n.d | 0.4 | Fytianos et al. (2001) |
| 17. | India | Around sewage treatment plant, Varanasi | 4 | n.d | n.d | n.d | 2.3 | n.d | 3.9 | 9.5 | Singh et al. (2010) |
| 18. | India | Soil waste disposal site, By Pass, Kolkata | 0.37 | n.d | n.d | n.d | n.d | n.d | 0.51 | 0.073 | Banerjee et al. (2010) |
| 19. | India | Raichak, Parganas, | 0.12 | n.d | n.d | n.d | n.d | n.d | 7.32 | 0.85 | Banerjee et al. (2010) |
| 20. | India | Ghatakpukur, Kolkata | BDL | n.d | n.d | n.d | n.d | n.d | BDL | BDL | Banerjee et al. (2010) |
| 21. | India | Wastewater Irrigated area, Titagarh, West bengal | 14.58 | 14.05 | 13.38 | n.d | 17.79 | n.d | n.d | n.d | Gupta et al. (2012) |
| 22. | India | Vegetable market of Anand, Gujarat | n.d | 18 | n.d | n.d | n.d | 6 | 8 | n.d | Kumar et al. (2010) |
| 23. | India | Wastewater irrigated site, Varanasi, India | 0.39 | n.d | n.d | n.d | 0.38 | n.d | n.d | 0.56 | Mishra and Tripathi (2008) |
| 24. | India | Industrial effluent irrigated Vadodara | 4 | 3 | n.d | n.d | 25 | n.d | 5 | n.d | Tiwari et al. (2011) |
| 25. | Iran | Wastewater Irrigated, Shah-Re Iran | 0.20 | 0.13 | n.d | n.d | 0.59 | n.d | 0.17 | n.d | Bigdeli and Seilsepour (2008) |
| 26. | Libya | Market Sites Misurata Area, Libya | 0.27 | n.d | n.d | n.d | 0.12 | n.d | n.d | Elbagermi et al. (2012) | |
| 27. | Morocco | Market, Morocco | 0.0045 | n.d | 0.0079 | n.d | n.d | 0.0045 | n.d | n.d | Bakkali et al. (2012) |
| 28. | Pakistan | Effluent treated, Faislabad, Pakistan | 0.061 | 0.062 | 0.049 | n.d | 0.051 | n.d | n.d | 0.073 | Farooq et al. (2008) |
| 29. | Pakistan | Gilgit, northern Pakistan | 2.10 | n.d | 0.84 | n.d | n.d | n.d | n.d | n.d | Khan et al. (2010) |
| 30. | Pakistan | Wastewater irrigating zone, Lahore, Pakistan | 0.14 | 0.37 | n.d | n.d | n.d | 0.09 | n.d | n.d | Mahmood and Malik (2014) |
| 31. | Pakistan | Wastewater Irrigated site, Peshawar, Pakistan | n.d | 16.24 | 15.24 | n.d | 49.9 | n.d | n.d | 3.9 | Perveen et al. (2012) |
| 32. | Romania | Near Mining Areas, Romania | n.d | n.d | 0.09 | n.d | n.d | 0.02 | n.d | 0.12 | Gergen and Harmanescu (2012) |
| 33. | Saudi Arabia | Urban areas, Dammam City | 4.02 | n.d | n.d | 1.34 | n.d | 1.20 | n.d | 0.97 | Ali and Al-Qahtani (2012) |
| 34. | Saudi Arabia | Urban areas, Riyadh City, Saudi Arabia | 4.13 | n.d | n.d | 1.29 | n.d | 1.43 | n.d | 1.34 | Ali and Al-Qahtani (2012) |
| 35. | Saudi Arabia | Urban areas, Tabouk City, Saudi Arabia | 3.89 | n.d | n.d | 1.24 | n.d | 1.21 | n.d | 1.10 | Ali and Al-Qahtani (2012) |
| 36. | Saudi Arabia | Urban areas, Jazan City, Saudi Arabia | 3.95 | n.d | n.d | 1.29 | n.d | 1.25 | n.d | 1.09 | Ali and Al-Qahtani (2012) |
| 37. | Spain | Market, Spain | 0.0051 | n.d | 0.0019 | n.d | n.d | 0.0036 | n.d | n.d | Bakkali et al. (2012) |
| 38. | Spain | Southern Spain, | 0.00511 | n.d | 0.0019 | n.d | n.d | 0.0018 | n.d | n.d | Bakkali et al. (2012) |
| Central Spain, | 0.0081 | – | 0.0105 | ||||||||
| Northern Spain | 0.0029 | – | 0.0016 | ||||||||
| 39. | Tehran | Wastewater Irrigated, South of Tehran | 1.3 | n.d | 2.8 | 1.1 | 1.4 | n.d | n.d | n.d | Harati et al. (2011) |
| 40. | Turkey | Manisa, Turkey | 0.024 | n.d | 0.005 | n.d | n.d | n.d | n.d | n.d | Bagdatlioglu et al. (2010) |
Permissible Limit: For Leafy Vegetables: 0.2 mg/kg; Fruits/Tubers: 0.1 mg/kg
n.d. not done, BDL below detection limits
Table 2.
Summary of some recent literature showing content of lead (mg/kg) in vegetable samples from some parts of the world
| S. no. | Country | Location | Spinach | Coriander | Lettuce | Turnip | Radish | Carrot | Brinjal | Cabbage | References |
|---|---|---|---|---|---|---|---|---|---|---|---|
| 1. | Bangladesh | Ruppur area, Pabna Distt, | 0.98 | n.d | n.d | n.d | 0.51 | 0.72 | 0.83 | n.d | Jolly et al. (2013) |
| 2. | Bangladesh | Industrial areas, Dhaka | n.d | n.d | n.d | n.d | n.d | n.d | 11.97 | 22.09 | Ahmad and Goni, (2010) |
| 3. | Bangladesh | Central market Rajshahi City, | n.d | n.d | n.d | n.d | 10.430 | n.d | 1.887 | n.d | Saha and Zaman (2013) |
| 4. | Brazil | Sao Paulo State | 1.05 | 1.24 | 0.48 | n.d | n.d | 0.38 | 0.44 | 0.60 | Guerra et al. (2012) |
| 5. | China | Wastewater Irrigated, Tongzhou Distt, Beijing, | 4.5 | n.d | 5.8 | 5.2 | 2.2 | n.d | n.d | 4 | Khan et al. (2008) |
| 6. | China | Near Dabaoshan mine in Guangdong, | 1.9 | n.d | 2.1 | 1.9 | n.d | n.d | n.d | 1.9 | Zhuang et al. (2009) |
| 7. | China | Zhongxin (ZX), Near Dabaoshan Mine | n.d | n.d | 0.13 | 0.20 | 0.12 | 0.09 | 0.18 | 0.12 | Zhuang et al. (2008) |
| 8. | China | Vicinity of industrial zone in Jiangsu, | 0.184 | n.d | 0.192 | n.d | n.d | n.d | 0.017 | 0.16 | Cao et al. (2010) |
| 9. | China | Jiangsu Province, | 0.093 | n.d | 0.053 | n.d | n.d | n.d | 0.126 | n.d | Hao et al. (2009) |
| 10. | China | Zhejiang province, | 0.06 | n.d | n.d | n.d | n.d | n.d | 0.02 | 0.02 | Huang et al. (2014) |
| 11. | China | Near e-waste processing site, | n.d | n.d | 0.77 | n.d | 0.11 | 0.48 | n.d | n.d | Luo et al. (2011) |
| 12. | China | Beijing | 0.061 | n.d | n.d | n.d | 0.440 | n.d | 0.367 | 0.286 | Song et al. (2009) |
| 13. | China | Wastewater Irrigated Beijing and Tianjin city cluster | n.d | n.d | 0.9 | n.d | 0.2 | n.d | n.d | 0.59 | Wang et al. (2012) |
| 14. | Ghana | Mining Site | n.d | n.d | < 0.005 | n.d | n.d | < 0.005 | n.d | < 0.005 | Boamponsem et al. (2012) |
| 15. | Ghana | Ghana Market | n.d | n.d | 0.56 | n.d | n.d | 0.16 | n.d | 0.43 | Bempah et al. (2011) |
| 16. | Greece | Industrial Area, | > 7 | n.d | > 4 | n.d | n.d | > 1 | n.d | > 2 | Fytianos et al. (2001) |
| 17. | India | Across Musi River, Hyderabad | 3.6 | 3.4 | n.d | n.d | n.d | n.d | 3.4 | n.d | Chary et al. (2008) |
| 18. | India | Urban area, Bangalore | 149.5 | 75.5 | n.d | n.d | n.d | n.d | n.d | n.d | Ramesh and Yogananda Murthy (2012) |
| 19. | India | Durgapur Industrial Belt | n.d | 58 | n.d | n.d | n.d | n.d | 25 | n.d | Kisku et al. (2011) |
| 20. | India | Around sewage treatment plant, Varanasi | 15 | n.d | n.d | n.d | 12.5 | n.d | 15.5 | 10 | Singh et al. (2010) |
| 21. | India | Solid waste disposal site, By Pass Kolkata | 16.57 | n.d | n.d | n.d | n.d | n.d | 14 | 5.14 | Banerjee et al. (2010) |
| 22. | India | Raichak, Parganas, Kolkata | 14.72 | n.d | n.d | n.d | n.d | n.d | 7.32 | 13.19 | Banerjee et al. (2010) |
| 23. | India | Ghatakpukur, West Bengal | 3.567 | n.d | n.d | n.d | n.d | n.d | 0.685 | 4.48 | Banerjee et al. (2010) |
| 24. | India | Wastewater Irrigated area, Titagarh, West Bengal | 49.59 | 31.13 | 34.94 | n.d | 57.63 | n.d | n.d | n.d | Gupta et al. (2012) |
| 25. | India | Vegetable market of Anand town, Gujarat | n.d | 152 | n.d | n.d | n.d | 78 | 111 | n.d | Kumar et al. (2010) |
| 26. | India | Wastewater irrigated site, Varanasi, | 2.64 | n.d | n.d | n.d | 2.85 | n.d | n.d | 3.56 | Mishra and Tripathi (2008) |
| 27. | India | Industrial effluent irrigated Vadodara, | 16 | 24 | n.d | n.d | 10 | n.d | 8 | n.d | Tiwari et al. (2011) |
| 28. | Iran | Wastewater Irrigated, Shah-Re Iran | 2.57 | 1.35 | n.d | n.d | 0.75 | 1.43 | Bigdeli and Seilsepour (2008) | ||
| 29. | Libya | Market Sites in the Misurata Area, | 0.32 | n.d | n.d | n.d | n.d | 0.21 | n.d | n.d | Elbagermi et al. (2012) |
| 30. | Morocco | Market, Morocco | 0.0107 | n.d | 0.0598 | n.d | n.d | 0.0341 | n.d | n.d | Bakkali et al. (2012) |
| 31. | Nigeria | Sokoto | 2.07 | n.d | 1.59 | n.d | n.d | n.d | n.d | n.d | Sani et al. (2011) |
| 32. | Nigeria | Maiduguri | 4.67 | n.d | 5.88 | n.d | n.d | n.d | n.d | n.d | Uwah et al. (2011) |
| 33. | Pakistan | Effluent irrigated, Faislabad, | 2.25 | 2.65 | 2.4 | n.d | 2.25 | n.d | n.d | 1.92 | Farooq et al. (2008) |
| 34. | Pakistan | Wastewater Irrigated, Distt Mardan | n.d | n.d | n.d | n.d | n.d | n.d | 14.15 | n.d | Amin et al. (2013) |
| 35. | Pakistan | Tube-well Irrigated, Mardan Distt, | n.d | n.d | n.d | n.d | n.d | n.d | 4.35 | n.d | Amin et al. (2013) |
| 36. | Pakistan | Gilgit, northern Pakistan | 18 | n.d | 15 | n.d | n.d | n.d | n.d | n.d | Khan et al. (2010) |
| 37. | Pakistan | Wastewater irrigating zone, Lahore, | 0.38 | 0.38 | n.d | n.d | n.d | 0.26 | n.d | n.d | Mahmood and Malik (2014) |
| 38. | Pakistan | Wastewater Irrigated site, Peshawar | n.d | 36.1 | 2.20 | n.d | 86.3 | n.d | n.d | 43 | Perveen et al. (2012) |
| 39. | Romania | Ruschita, Mining area | n.d | n.d | 0.62 | n.d | n.d | 2.1 | n.d | 0.9 | Harmanescu et al. (2011) |
| 40. | Romania | Mol Dova Noua, Mining Area, Banat County, | n.d | n.d | 0.21 | n.d | n.d | 0.09 | n.d | 0.25 | Harmanescu et al. (2011) |
| 41. | Romania | Near Mining Areas, | n.d | n.d | 0.62 | n.d | n.d | 2.11 | n.d | 0.90 | Gergen and Harmanescu (2012) |
| 42. | Saudi Arabia | Urban areas, Dammam City, | 2.88 | n.d | n.d | 2.04 | n.d | 1.42 | n.d | 5.31 | Ali and Al-Qahtani (2012) |
| 43. | Saudi Arabia | Urban areas, Riyadh City, Saudi Arabia | 1.26 | n.d | n.d | 1.27 | n.d | 1.13 | n.d | 3.80 | Ali and Al-Qahtani (2012) |
| 44. | Saudi Arabia | Urban areas, Tabouk City, | 4.14 | n.d | n.d | 4.37 | n.d | 1.64 | n.d | 3.49 | Ali and Al-Qahtani (2012) |
| 45. | Saudi Arabia | Urban areas, Jazan City, | 2.85 | n.d | n.d | 2.94 | n.d | 1.52 | n.d | 2.75 | Ali and Al-Qahtani (2012) |
| 46. | Spain | Market, Spain | 0.0133 | n.d | 0.0051 | n.d | n.d | 0.0071 | n.d | n.d | Bakkali et al. (2012) |
| 47. | Spain | Southern Spain, | 0.0107 | n.d | 0.0041 | n.d | n.d | 0.0071 | n.d | n.d | Bakkali et al. (2012) |
| Central Spain, | 0.033 | 0.0064 | 0.0141 | ||||||||
| Northern Spain | 0.0083 | 0.021 | 0.004 | ||||||||
| 48. | Tanzania | Across Industrial Area | n.d | n.d | n.d | n.d | n.d | n.d | n.d | 31 | Chove et al. (2006) |
| 49. | Tehran | Wastewater irrigated, South of Tehran | 8.4 | n.d | 9.9 | 8.9 | 10.6 | n.d | n.d | n.d | Harati et al. (2011) |
| 50. | Turkey | Manisa, | 0.139 | n.d | 0.163 | n.d | n.d | n.d | n.d | n.d | Bagdatlioglu et al. (2010) |
Permissible Limit: For Leafy Vegetables: 0.3 mg/kg; Fruits/Tubers: 0.1 mg/kg
n.d. not done
Table 3.
Summary of some recent literature showing content of copper (mg/kg) in vegetable samples from some parts of the world
| S. no. | Country | Location | Spinach | Coriander | Lettuce | Turnip | Radish | Carrot | Brinjal | Cabbage | References |
|---|---|---|---|---|---|---|---|---|---|---|---|
| 1. | Bangladesh | Ruppur area, Pabna Distt, Bangladesh | 5.59 | n.d | n.d | n.d | 4.45 | 5.35 | 6.69 | n.d | Jolly et al. (2013) |
| 2. | Bangladesh | Directly Polluted area, Bangladesh | 18.3 | n.d | n.d | n.d | n.d | n.d | n.d | n.d | Naser et al. (2012) |
| 3. | Bangladesh | Industrial areas, Dhaka, Bangladesh | n.d | n.d | n.d | n.d | n.d | n.d | 8.63 | 14.25 | Ahmad and Goni(2010) |
| 4. | China | Wastewater Irrigated, Tongzhou Distt, Beijing, China | 15 | n.d | 14.8 | 15 | 9.8 | n.d | n.d | 13 | Khan et al. (2008) |
| 5. | China | Near Dabaoshan mine in Guangdong, China | 14 | n.d | 14 | 9.8 | n.d | n.d | n.d | 14 | Zhuang et al. (2009) |
| 6. | China | Zhongxin (ZX), Near Dabaoshan Mine, China | n.d | n.d | 0.74 | 1.27 | 0.45 | 1.33 | 1.58 | 1.11 | Zhuang et al. (2008) |
| 7. | China | Vicinity of industrial zone in Jiangsu, China | 2.35 | n.d | 1.31 | n.d | n.d | n.d | 0.99 | 0.62 | Cao et al. (2010) |
| 8. | China | Jiangsu Province, China | 1.41 | n.d | 0.62 | n.d | n.d | n.d | 1.68 | n.d | Hao et al. (2009) |
| 9. | China | Near e-waste processing site, China | n.d | n.d | 2.09 | n.d | 0.59 | 0.99 | n.d | n.d | Luo et al. (2011) |
| 10. | China | Beijing | 1.05 | n.d | n.d | n.d | 1.20 | n.d | 2.71 | 1.0 | Song et al. (2009) |
| 11. | China | Wastewater Irrigated Beijing and Tianjin city cluster, China | n.d | n.d | 11 | n.d | 4 | n.d | n.d | 9 | Wang et al. (2012) |
| 12. | Ghana | Mining Site, Ghana | n.d | n.d | 0.172 | n.d | n.d | 0.221 | n.d | 0.040 | Boamponsem et al. (2012) |
| 13. | Ghana | Ghana Market | n.d | 1.92 | n.d | n.d | 1.77 | n.d | 2.32 | Bempah et al. (2011) | |
| 14. | Greece | Industrial Area, Northern Greece | > 8 | n.d | > 5 | n.d | n.d | > 4 | n.d | > 1 | Fytianos et al. (2001) |
| 15. | India | Wastewater Irrigated, Rajasthan, India | 16.5 | 12.1 | n.d | 16.1 | 6 | 12 | 10.2 | n.d | Arora et al. (2008) |
| 16. | India | Across Musi River, Hyderabad, India | 1.1 | 1.6 | n.d | n.d | n.d | n.d | 0.9 | n.d | Chary et al. (2008) |
| 17. | India | Urban areas, Bangalore, India | 34.7 | 60.7 | n.d | n.d | n.d | n.d | n.d | n.d | Ramesh and Yogananda Murthy (2012) |
| 18. | India | Durgapur Industrial Belt, India | n.d | 51 | n.d | n.d | n.d | n.d | 55 | n.d | Kisku et al. (2011) |
| 19. | India | Around sewage treatment plant, Varanasi | 15 | n.d | n.d | n.d | 14.8 | n.d | 14.8 | 6 | Singh et al. (2010) |
| 20. | India | Soil waste disposal site, By Pass, Kolkata | 16.13 | n.d | n.d | n.d | n.d | n.d | 11.75 | 0.45 | Banerjee et al. (2010) |
| 21. | India | Raichak, Parganas, | 5.91 | n.d | n.d | n.d | n.d | n.d | 12.12 | 6.43 | Banerjee et al. (2010) |
| 22. | India | Ghatakpukur, Kolkata | 8.97 | n.d | n.d | n.d | n.d | n.d | 13.25 | 9.87 | Banerjee et al. (2010) |
| 23. | India | Wastewater Irrigated area, Titagarh, West Bengal | 34.49 | 25.10 | 24.93 | n.d | 28.08 | n.d | n.d | n.d | Gupta et al. (2012) |
| 24. | India | Wastewater irrigated site, Varanasi,India | 16.38 | n.d | n.d | n.d | 7.28 | n.d | n.d | 12.25 | Mishra and Tripathi (2008) |
| 25. | India | Sewage irrigated site, Delhi, India | 20.6 | n.d | n.d | n.d | 10.4 | n.d | n.d | n.d | Rattan et al. (2005) |
| 26. | India | Industrial effluent irrigated Vadodara, India | 18 | 30 | n.d | n.d | 19 | n.d | 29 | n.d | Tiwari et al. (2011) |
| 27. | Iran | Wastewater Irrigated, Shah-Re Iran | 22.74 | 26.92 | n.d | n.d | 12.52 | n.d | 27.53 | n.d | Bigdeli and Seilsepour (2008) |
| 28. | Libya | Market Sites in the Misurata Area, Libya | 5.32 | n.d | n.d | n.d | n.d | 5 | n.d | n.d | Elbagermi et al. (2012) |
| 29. | Morocco | Market, Morocco | 0.0635 | n.d | 0.353 | n.d | n.d | 0.0508 | n.d | n.d | Bakkali et al. (2012) |
| 30. | Nigeria | Sokoto, Nigeria | 1.1 | n.d | 0.8 | n.d | n.d | n.d | n.d | n.d | Sani et al. (2011) |
| 31. | Nigeria | Maiduguri, Nigeria | n.d | n.d | 1.66 | n.d | n.d | n.d | n.d | n.d | Uwah et al. (2011) |
| 32. | Pakistan | Effluent treated, Faisalabad, Pakistan | 0.923 | 0.653 | 0.851 | n.d | 0.462 | n.d | n.d | 0.252 | Farooq et al. (2008) |
| 33. | Pakistan | Wastewater Irrigated, Distt Mardan Pakistan | n.d | n.d | n.d | n.d | n.d | n.d | 10.85 | n.d | Amin et al. (2013) |
| 34. | Pakistan | Tube-well Irrigated, Mardan Distt, Pakistan | n.d | n.d | n.d | n.d | n.d | n.d | 6.85 | n.d | Amin et al. (2013) |
| 35. | Pakistan | Gilgit, northern Pakistan | 11 | n.d | 24 | n.d | n.d | n.d | n.d | n.d | Khan et al. (2010) |
| 36. | Pakistan | Wastewater irrigating zone, Lahore, Pakistan | 0.44 | 1.65 | n.d | n.d | n.d | 0.87 | n.d | n.d | Mahmood and Malik (2014) |
| 37. | Poznan | Markets, Poznañ | n.d | n.d | 4.6 | n.d | n.d | 4.2 | n.d | 2.1 | Bosiacki and Tyksiñski (2009) |
| 38. | Romania | Ruschita, Mining area, Banat County, Romania | n.d | n.d | 1.86 | n.d | n.d | 1.54 | n.d | 1.36 | Harmanescu et al. (2011) |
| 39. | Romania | Mol Dova Noua, Mining, area, Banat County, Romania | n.d | n.d | 2.22 | n.d | n.d | 1.77 | n.d | 2.77 | Harmanescu et al. (2011) |
| 40. | Romania | Near Mining Areas, Romania | n.d | n.d | 2.22 | n.d | n.d | 1.77 | n.d | 2.77 | Gergen and Harmanescu (2012) |
| 41. | Saudi Arabia | Urban areas, Dammam City, Saudi Arabia | 11.38 | n.d | n.d | 6.21 | n.d | 3.60 | n.d | 4.24 | Ali and Al-Qahtani (2012) |
| 42. | Saudi Arabia | Urban areas, Riyadh City, Saudi Arabia | 14.07 | n.d | n.d | 14.27 | n.d | 4.49 | n.d | 6.85 | Ali and Al-Qahtani (2012) |
| 43. | Saudi Arabia | Urban areas, Tabouk City, Saudi Arabia | 7.82 | n.d | n.d | n.d | 11.80 | 4.44 | n.d | 2.76 | Ali and Al-Qahtani (2012) |
| 44. | Saudi Arabia | Urban areas, Jazan City, Saudi Arabia | 10 | n.d | n.d | 7.45 | 7.82 | n.d | 3.88 | Ali and Al-Qahtani (2012) | |
| 45. | Spain | Market, Spain | 0.0518 | n.d | 18.9 | n.d | n.d | 0.0514 | n.d | n.d | Bakkali et al. (2012) |
| 46. | Spain | Southern Spain, | 0.0518 | n.d | 0.0189 | n.d | n.d | 0.0514 | n.d | n.d | Bakkali et al. (2012) |
| Central Spain, | 0.0782 | 0.0126 | 0.0252 | ||||||||
| Northern Spain | 0.0453 | 0.0235 | 0.0164 | ||||||||
| 47. | Tanzania | Across Industrial Area, Tanzania | n.d | n.d | n.d | n.d | n.d | n.d | n.d | 140 | Chove et al. (2006) |
| 48. | Turkey | Manisa, Turkey | 1.30 | n.d | 0.48 | n.d | n.d | n.d | n.d | n.d | Bagdatlioglu et al. (2010) |
n.d. not done
Concentration of other metals in vegetable samples was also reported to be high in many parts of world. Vegetables grown near Ginfel river near Sheba Tannery, Tigray, Northern Ethiopia, accumulated many heavy metals and the uptake pattern of different heavy metals in vegetables were in order: Fe > Pb > Cd > Mn > Cu > Zn > Ni > Zn > Cr = Co (Gebrekidan et al. 2013). A study was carried out to compare the concentration of metals in vegetables irrigated with wastewater and tube well water in Keshopur, Delhi, India. It was reported that concentration of metals in vegetables irrigated with wastewater was much higher than those irrigated with tube well water. Concentration of iron in spinach was reported to be 711 mg/kg, in radish tuber was 166 mg/kg and in cauliflower was 328 mg/kg (Rattan et al. 2005). A study around wastewater irrigated site in Varanasi revealed that the continuous use of wastewater for irrigation caused a buildup of higher concentration of Cd, Cr, Ni and Pb as compared of ground water irrigated site. The relative efficiency of uptake of copper by different vegetables in sewage irrigated site of Baoding City, China was S. oleracea > B. pekinensis L. > B. oleracea > A. fistulosum (Xue et al. 2012). In sewage water irrigated fields in Vadodara, India, 5 out of 10 vegetable species (spinach, radish, tomato, chilli and cabbage) studied showed high accumulation of toxic metals like As, Cd, Cr, Pb and Ni (Tiwari et al. 2011). Concentration of Pb and Zn in sewage irrigated soil of Kabul city ranged from 1–5 and 33–160 mg/kg, which was much above the threshold levels i.e., 0.3 mg/kg for Pb and 50 mg/kg for Zn (Safi and Buerkert 2011).
Buildup of heavy metals is higher in vegetables as compared to grains owing to the fleshy tissues. Throughout the world, many studies have shown high concentration of heavy metals in vegetables growing at contaminated sites and/or those irrigated with wastewater. At many places, concentration of these metals in vegetables is found to be beyond permissible levels (Chove et al. 2006). The hazard associated with consumption of heavy metals with food crops is measured by assessing Metal Pollution Index (MPI) and Hazard Quotient (HQ) (Song et al. 2009; Huang et al. 2014; Sharma et al. 2016a, b). Levels of heavy metals in vegetables are reported to be beyond acceptable limits in many parts of the world thus representing potential health risk, these food crops can cause to the entire population (Jolly et al. 2013; Sharma et al. 2016a).
Need for a constructive solution
To attain food security it is important is also consider the safety aspect in production of food. There is need that scientific community, policy makers and society understand the multifaceted aspect of food security and make the legible efforts to produce sufficient as well as safe food. There is a need to identify various remediation strategies and improve the irrigation mechanisms Soil remediation requirements may vary from region to region, so the alternatives should be suggested keeping in the mind the conditions of particular region. Irrigation with wastewater in developed nations might be a solution where the economic conditions permit to treat wastewater till tertiary levels. In developing or underdeveloped nations there is need to find a strategy that can enhance the quality of food in terms of safety and nutritious value. Strategies like organic soil amendments, drip irrigation, remediation technologies, low cost wastewater treatment techniques can be an answer to solve the issue. Internationally, efforts are required to make a paradigm shift of culture from just attaining sufficiency to safety.
Footnotes
Publisher's Note
Springer Nature remains neutral with regard to jurisdictional claims in published maps and institutional affiliations.
References
- Ahmad JU, Goni MA. Heavy metal contamination in water, soil, and vegetables of the industrial areas in Dhaka. Bangladesh Environ Monitor Assess. 2010;166(1–4):347–357. doi: 10.1007/s10661-009-1006-6. [DOI] [PubMed] [Google Scholar]
- Ali MHH, Al-Qahtani KM. Assessment of some heavy metals in vegetables, cereals and fruits in Saudi Arabian markets. Egypt J Aquat Res. 2012;38(1):31–37. doi: 10.1016/j.ejar.2012.08.002. [DOI] [Google Scholar]
- Amin NU, Hussain A, Alamzeb S, Begum S. Accumulation of heavy metals in edible parts of vegetables irrigated with waste water and their daily intake to adults and children, District Mardan. Pakistan Food Chem. 2013;136(3–4):1515–1523. doi: 10.1016/j.foodchem.2012.09.058. [DOI] [PubMed] [Google Scholar]
- Angelakis AN, Koutsoyiannis D, Tchobanoglous G. Urban wastewater and stormwater technologies in ancient Greece. Water Res. 2005;39:210–220. doi: 10.1016/j.watres.2004.08.033. [DOI] [PubMed] [Google Scholar]
- Arora M, Kiran B, Rani S, Rani A, Kaur B, Mittal N. Heavy metal accumulation in vegetables irrigated with water from different sources. Food Chem. 2008;111:811–815. doi: 10.1016/j.foodchem.2008.04.049. [DOI] [Google Scholar]
- Asano T, Burton FL, Leverenz H, Tsuchihashi R, Tchobanoglous G. Water reuse: issues, technologies, and applications. New York: McGraw Hill; 2007. [Google Scholar]
- Bagdatlioglu N, Nergiz C, Ergonul PG. Heavy metal levels in leafy vegetables and some selected fruits. J Consum Prot Food Saf. 2010;5(3):421–428. doi: 10.1007/s00003-010-0594-y. [DOI] [Google Scholar]
- Bakkali K, Martos NR, Souhail B, Ballesteros E. Determination of Heavy Metal Content in Vegetables and Oils From Spain and Morocco by Inductively Coupled Plasma Mass Spectrometry. Anal Lett. 2012;45(8):907–919. [Google Scholar]
- Banerjee D, Bairagi H, Mukhopadhyay S, Pal A, Ray L. Heavy Metal Contamination in Fruits and Vegetables in Two Districts of West Bengal, India. Electron J Environ Agric Food Chem. 2010;9:1423–1432. [Google Scholar]
- Bempah CK, Buah-kwofie A, Osei-tutu A, Denutsui D, Bentil N. Assessing potential dietary intake of heavy metals in some selected fruits and vegetables from Ghanaian markets. Elixir Pollut. 2011;39:4921–4926. [Google Scholar]
- Bigdeli M, Seilsepour M. Investigation of Metals Accumulation in Some Vegetables Irrigated with Waste Water in Shahre Rey-Iran and Toxicological Implications. Am Eurasian J Agric Environ Sci. 2008;4(1):86–92. [Google Scholar]
- Boamponsem GA, Kumi M, Debrah I. Heavy Metals Accumulation In Cabbage, Lettuce And Carrot Irrigated With Wastewater From Nagodi Mining Site In Ghana. Int J Sci Technol Res. 2012;1(11):124–129. [Google Scholar]
- Bosiacki M, Tyksiñski W. Copper, Zinc, Iron and Manganese Content in Edible Parts of Some Fresh Vegetables Sold on Markets in Poznañ. J Elementol. 2009;14(1):13–22. [Google Scholar]
- Bruinsma J (2009) The resources outlook: by how much do land, water and crop yields need to increase by 2050? In Looking Ahead in World Food and Agriculture: Perspectives to 2050. FAO, Rome, (pp 233–278). Retrieved from https://www.fao.org/docrep/014/i2280e/i2280e06. pdf
- Cao H, Chen J, Zhang J, Zhang H, Qiao L, Men Y. Heavy metals in rice and garden vegetables and their potential health risks to inhabitants in the vicinity of an industrial zone in Jiangsu. China J Environ Sci. 2010;22(11):1792–1799. doi: 10.1016/s1001-0742(09)60321-1. [DOI] [PubMed] [Google Scholar]
- Chary NS, Kamala CT, Suman DS. Assessing risk of heavy metals from consuming food grown on sewage irrigated soils and food chain transfer. Ecotoxicol Environ Saf. 2008;69:513–524. doi: 10.1016/j.ecoenv.2007.04.013. [DOI] [PubMed] [Google Scholar]
- Chove BE, Ballegu WR, Chove LM. Copper and lead levels in two popular leafy vegetables grown around Morogoro Municipality. Tanzania Tanzania Health Res Bull. 2006;8(1):37–40. doi: 10.4314/thrb.v8i1.14269. [DOI] [PubMed] [Google Scholar]
- Elbagermi MA, Edwards HGM, Alajtal AI. Monitoring of Heavy Metal Content in Fruits and Vegetables Collected from Production and Market Sites in the Misurata Area of Libya. ISRN Anal Chem. 2012;2012:1–5. [Google Scholar]
- FAO, WHO (2011) Joint FAO/WHO food standards programme codex committee on contaminants in foods. FAO WHO. Retrieved from ftp://ftp.fao.org/ codex/meetings/CCCF/cccf5/cf05_INF.pdf
- FAO. IFAD. WFP . The State of Food Insecurity in the World: Meeting the 2015 international hunger targets: taking stock of uneven progress. Rome: FAO; 2015. [DOI] [PMC free article] [PubMed] [Google Scholar]
- Farooq M, Anwar F, Rashid U. Appraisal of heavy metal contents in different vegetables grown in the vicinity of an industrial area. Pak J Bot. 2008;40(5):2099–2106. [Google Scholar]
- Fytianos K, Katsianis G, Triantafyllou P, Zachariadis G. Accumulation of heavy metals in vegetables grown in an industrial area in relation to soil. Bull Environ Contam Toxicol. 2001;67(3):423–430. doi: 10.1007/s001280141. [DOI] [PubMed] [Google Scholar]
- Gebrekidan A, Weldegebriel Y, Hadera A, Van der Bruggen B. Toxicological assessment of heavy metals accumulated in vegetables and fruits grown in Ginfel river near Sheba Tannery, Tigray, Northern Ethiopia. Ecotoxicol Environ Saf. 2013;95:171–178. doi: 10.1016/j.ecoenv.2013.05.035. [DOI] [PubMed] [Google Scholar]
- Gergen I, Harmanescu M. Application of principal component analysis in the pollution assessment with heavy metals of vegetable food chain in the old mining areas. Chem Central J. 2012;6(1):156. doi: 10.1186/1752-153X-6-156. [DOI] [PMC free article] [PubMed] [Google Scholar]
- Guerra F, Trevizam AR, Muraoka T, Marcante NC, Caniatti-Brazaca SG. Heavy metals in vegetables and potential risk for human health. Sci Agricola. 2012;69:54–60. [Google Scholar]
- Gupta N, Khan DK, Santra SC. Heavy metal accumulation in vegetables grown in a long-term wastewater-irrigated agricultural land of tropical India. Environ Monitor Assess. 2012;184(11):6673–6682. doi: 10.1007/s10661-011-2450-7. [DOI] [PubMed] [Google Scholar]
- Hao XZ, Zhou DM, Huang DQ, Cang L, Zhang HL, Wang H. Heavy metal transfer from soil to vegetable in Southern Jiangsu Province. China Pedosphere. 2009;19(3):305–311. [Google Scholar]
- Harati M, Varavi M, Rastegar MT, Foghi B. Effect of urban wastewater usage and problems of accumulation of heavy metals in agricultural lands (south of Tehran) Afr J Agric Res. 2011;6(14):3224–3231. [Google Scholar]
- Harmanescu M, Alda L, Bordean D, Gogoasa I, Gergen I. Heavy metals health risk assessment for population via consumption of vegetables grown in old mining area; a case study: Banat County. Romania Chem Central J. 2011;5(1):64. doi: 10.1186/1752-153X-5-64. [DOI] [PMC free article] [PubMed] [Google Scholar]
- Huang Z, Pan XD, Wu PG, Han JL, Chen Q. Heavy metals in vegetables and the health risk to population in Zhejiang. China Food Control. 2014;36(1):248–252. [Google Scholar]
- Jiménez B, Asano T, editors. Water reuse: an international survey of current practice, issues and needs. London: IWA Publishing; 2008. [Google Scholar]
- Jolly YN, Islam A, Akbar S. Transfer of metals from soil to vegetables and possible health risk assessment. SpringerPlus. 2013;2(1):385–392. doi: 10.1186/2193-1801-2-385. [DOI] [PMC free article] [PubMed] [Google Scholar]
- Kanungsukkasem U, Ng N, Van Minh H, Razzaque A, Ashraf A, Juvekar S, Ahmed SM, Bich TH. Fruit and vegetable consumption in rural adults population in INDEPTH HDSS sites in Asia. Global Health Action. 2009;2:35–43. doi: 10.3402/gha.v2i0.1988. [DOI] [PMC free article] [PubMed] [Google Scholar]
- Khan S, Cao Q, Zheng YM, Huang YZ, Zhu YG. Health risks of heavy metals in contaminated soils and food crops irrigated with wastewater in Beijing, China. Environ Pollut. 2008;152:686–692. doi: 10.1016/j.envpol.2007.06.056. [DOI] [PubMed] [Google Scholar]
- Khan S, Rehman S, Zeb Khan A, Amjad Khan M, Tahir Shah M. Soil and vegetables enrichment with heavy metals from geological sources in Gilgit, northern Pakistan. Ecotoxicol Environ Saf. 2010;73(7):1820–1827. doi: 10.1016/j.ecoenv.2010.08.016. [DOI] [PubMed] [Google Scholar]
- Khan K, Lu Y, Khan H, Ishtiaq M, Khan S, Waqas M, Wei L, Wang T. Heavy metals in agricultural soils and crops and their health risks in Swat District, Northern Pakistan. Food Chem Toxicol. 2013;58:449–458. doi: 10.1016/j.fct.2013.05.014. [DOI] [PubMed] [Google Scholar]
- Kisku GC, Pandey P, Negi MPS, Misra V. Uptake and accumulation of potentially toxic metals (Zn, Cu and Pb) in soils and plants of Durgapur industrial belt. J Environ Biol. 2011;32:831–838. [PubMed] [Google Scholar]
- Kumar N, Soni H, Kumar R. Characterization of Heavy Metals in Vegetables Using Inductive Coupled Plasma Analyzer (ICPA) J Appl Sci Environ Manag. 2010 doi: 10.4314/jasem.v11i3.55131. [DOI] [Google Scholar]
- Liu P, Zhao HJ, Wang LL, Liu ZH, Wei JL, Wang YQ, Jiang LH, Dong L, Zhang YF. Analysis of heavy metal sources for vegetable soils from Shandong Province, China. Agric Sci China. 2011;10:109–119. [Google Scholar]
- Liu J, Wang J, Qi J, Li X, Chen Y, Wang C, Wu Y. Heavy metal contamination in arable soils and vegetables around a sulfuric acid factory, China. Clean-Soil, Air, Water. 2012;40:766–772. [Google Scholar]
- Luo C, Liu C, Wang Y, Liu X, Li F, Zhang G, Li X. Heavy metal contamination in soils and vegetables near an e-waste processing site, south China. J Hazard Mater. 2011;186(1):481–490. doi: 10.1016/j.jhazmat.2010.11.024. [DOI] [PubMed] [Google Scholar]
- Mahmood A, Malik RN. Human health risk assessment of heavy metals via consumption of contaminated vegetables collected from different irrigation sources in Lahore. Pakistan Arab J Chem. 2014;7(1):91–99. [Google Scholar]
- Mahmoud N, Amarneh MN, Al Sa’ed R, Zeeman G, Gijzen H, Lettinga G. Sewage characterization as a tool for the application of anaerobic treatment in Palestine. Environ Pollut. 2003;126:115–122. doi: 10.1016/s0269-7491(03)00147-7. [DOI] [PubMed] [Google Scholar]
- Mishra A, Tripathi BD. Heavy metal contamination of soil, and bioaccumulation in vegetables irrigated with treated waste water in the tropical city of Varanasi. India Toxicol Environ Chem. 2008;90(1):1–10. [Google Scholar]
- Mwegoha WJS, Kihampa C. Heavy metal contamination in agricultural soils and water in Dar Es Salaam City, Tanzania. Afr J Environ Sci Technol. 2010;4:763–769. [Google Scholar]
- Naser HM, Mahmud NU, Sultana S, Gomes R, Rahman M. Trace Elements Content in Vegetables Grown in industrially polluted and non-polluted areas. Bangladesh J Agric Res. 2012;37:515–527. [Google Scholar]
- National Institute of Nutrition. (2011) Dietary Guidelines for Indians-A Manual. Retrieved from https://ninindia.org/DietaryguidelinesforIndians-Finaldraft.pdf
- Orisakwe OE, Kanayochukwu NJ, Nwadiuto AC, Daniel D, Onyinyechi O. Evaluation of potential dietary toxicity of heavy metals of vegetables. Environ Anal Toxicol. 2012;2:2–5. [Google Scholar]
- Orisakwe OE, Nduka JK, Amadi CN, Dike DO, Bede O. Heavy metals health risk assessment for population via consumption of food crops and fruits in Owerri, South Eastern, Nigeria. Chem Cent J. 2012;6:77–83. doi: 10.1186/1752-153X-6-77. [DOI] [PMC free article] [PubMed] [Google Scholar]
- Perveen S, Samad A, Nazif W, Shah S. Impact of sewage water on vegetables quality with respect to heavy metals in Peshawar Pakistan. Pak J Bot. 2012;44(6):1923–1931. [Google Scholar]
- Ramesh HL, Yogananda Murthy VN. Assessment of Heavy Metal Contamination in Green Leafy Vegetables Grown in Bangalore Urban District of Karnataka. Adv Life Sci Technol. 2012;6:40–51. [Google Scholar]
- Rattan RK, Datta SP, Chhonkar PK, Suribabu K, Singh AK. Long-term impact of irrigation with sewage effluents on heavy metal content in soils, crops and groundwater - A case study. Agric Ecosyst Environ. 2005;109(3–4):310–322. [Google Scholar]
- Safi Z, Buerkert A. Heavy metal and microbial loads in sewage irrigated vegetables of Kabul, Afghanistan. J Agric Rural Dev Tropics Subtropics. 2011;112:29–36. [Google Scholar]
- Saha N, Zaman MR. Evaluation of possible health risks of heavy metals by consumption of foodstuffs available in the central market of Rajshahi City. Bangladesh Environ Monitor Assess. 2013;185(5):3867–3878. doi: 10.1007/s10661-012-2835-2. [DOI] [PubMed] [Google Scholar]
- Sani HA, Tsafe AI, Bagudo BU, Itodo AU. Toxic metals uptake by spinach (Spinacea oleracea) and lettuce (Lactuca sativa) cultivated in Sokoto: A comparative study. Pak J Nutr. 2011;10(6):572–576. [Google Scholar]
- Sharma A, Katnoria JK, Nagpal A. Heavy Metals in Vegetables: Screening health risk involved in cultivation along wastewater drain and irrigating with wastewater. Springerplus. 2016;5:488. doi: 10.1186/s40064-016-2129-1. [DOI] [PMC free article] [PubMed] [Google Scholar]
- Sharma A, Kaur M, Katnoria JK, Nagpal AK. Heavy Metal Pollution: A Global Pollutant of Rising Concern. In: Rathoure A, Dhatwalia V, editors. Toxicity and Waste Management Using Bioremediation. PA: IGI Global, Hershey; 2016. pp. 1–26. [Google Scholar]
- Singh A, Prasad SM. Effect of agro-industrial waste amendment on Cd uptake in Amaranthus caudatus grown under contaminated soil: An oxidative biomarker response. Ecotoxicol Environ Saf. 2014;100:105–113. doi: 10.1016/j.ecoenv.2013.09.005. [DOI] [PubMed] [Google Scholar]
- Singh A, Sharma RK, Agrawal M, Marshall F. Effects of wastewater irrigation on physiochemical properties of soil and availability of heavy metals in soil and vegetables. Commun Soil Sci Plant Anal. 2009;40:3469–3490. [Google Scholar]
- Singh A, Sharma RK, Agrawal M, Marshall FM. Health risk assessment of heavy metals via dietary intake of foodstuffs from the wastewater irrigated site of a dry tropical area of India. Food Chem Toxicol. 2010;48(2):611–619. doi: 10.1016/j.fct.2009.11.041. [DOI] [PubMed] [Google Scholar]
- Song B, Lei M, Chen T, Zheng Y, Xie Y, Li X, Gao D. Assessing the health risk of heavy metals in vegetables to the general population in Beijing. China J Environ Sci. 2009;21(12):1702–1709. doi: 10.1016/s1001-0742(08)62476-6. [DOI] [PubMed] [Google Scholar]
- Tiwari KK, Singh NK, Patel MP, Tiwari MR, Rai UN. Metal contamination of soil and translocation in vegetables growing under industrial wastewater irrigated agricultural field of Vadodara, Gujarat. India Ecotoxicol Environ Saf. 2011;74(6):1670–1677. doi: 10.1016/j.ecoenv.2011.04.029. [DOI] [PubMed] [Google Scholar]
- UN (2015) Millennium Development Goals and Beyond 2015. Retrieved from https://www.un.org/millenniumgoals/poverty.shtml
- Uwah EI, Ndahi NP, Abdulrahman FI, Ogugbuaja VO. Heavy metal levels in spinach (Amaranthus caudatus) and lettuce (Lactuca sativa) grown in Maiduguri. Nigeria J Environ Chem Ecotoxicol. 2011;3(10):264–271. [Google Scholar]
- Van der Hoek (2004) A Framework for a Global Assessment of the Extent of Wastewater Irrigation: The Need for a Common Typology. In. Scott CA, Faruqui NI, Raschid-Sally L (eds.) Wastewater Use in Irrigated Agriculture: Confronting the Livelihood and Environmental Realities. Wallingford: CABI.
- Wang L, Guo Z, Xiao X, Chen T, Liao X, Song J, Wu B. Heavy metal pollution of soils and vegetables in the midstream and downstream of the Xiangjiang River, Hunan Province. J Geogr Sci. 2008;18:353–362. [Google Scholar]
- Wang Y, Qiao M, Liu Y, Zhu Y. Health risk assessment of heavy metals in soils and vegetables from wastewater irrigated area, Beijing–Tianjin city cluster. China J Environ Sci. 2012;24(4):690–698. doi: 10.1016/s1001-0742(11)60833-4. [DOI] [PubMed] [Google Scholar]
- Weldegebriel Y, Chandravanshi BS, Wondimu T. Concentration levels of metals in vegetables grown in soils irrigated with river water in Addis Ababa, Ethiopia. Ecotoxicol Environ Saf. 2012;77:57–63. doi: 10.1016/j.ecoenv.2011.10.011. [DOI] [PubMed] [Google Scholar]
- WHO (2006) WHO Guidelines for the Safe Use of Wastewater, Excreta and Greywater. Vol. I: Policy and Regulatory Aspects. Vol. II: Wastewater Use in Agriculture. Vol. III: Watewater and Excreta Use in Aquaculture. Vol. IV: Excreta and Greywater Use in Agriculture. World Health Organization, Geneva.
- WHO World Health Organization (2003) Diet, nutrition, and the prevalence of chronic diseases. Geneva, Switzerland: World Health Organization; Contract No.: WHO Technical Report Series No. 916. [PubMed]
- World Bank . Improving Wastewater Use in Agriculture : An Emerging Priority. Washington, DC: World Bank Energy Transport and Water Department Water Anchor; 2010. [Google Scholar]
- WWF (2016) Water Scarcity: Overview. Retrieved March 1, 2016, from https://www.worldwildlife.org/threats/water-scarcity
- Xue ZJ, Liu SQ, Liu YL, Yan YL. Health risk assessment of heavy metals for edible parts of vegetables grown in sewage-irrigated soils in suburbs of Baoding City, China. Environ Monitor Assess. 2012;184:3503–3513. doi: 10.1007/s10661-011-2204-6. [DOI] [PubMed] [Google Scholar]
- Zhuang P, Mcbride MB, Xia H, Li NY, Li ZA. Health risk from heavy metals via consumption of food crops in the vicinity of Dabaoshan mine. South China Sci Total Environ. 2008;407(5):1551–1561. doi: 10.1016/j.scitotenv.2008.10.061. [DOI] [PubMed] [Google Scholar]
- Zhuang P, Zou B, Li NY, Li ZA. Heavy metal contamination in soils and food crops around Dabaoshan mine in Guangdong, China: Implication for human health. Environ Geochem and Health. 2009;31:707–715. doi: 10.1007/s10653-009-9248-3. [DOI] [PubMed] [Google Scholar]