

Abstract
Minimal hepatic encephalopathy (MHE) is characterized by diffuse abnormalities in cerebral structure, such as reduced cortical thickness and altered brain parenchymal volume. This study tested the potential of gray matter (GM) volumetry to differentiate between cirrhotic patients with and without MHE using a support vector machine (SVM) learning method. High-resolution, T1-weighted magnetic resonance images were acquired from 24 cirrhotic patients with MHE and 29 cirrhotic patients without MHE (NHE). Voxel-based morphometry was conducted to evaluate the GM volume (GMV) for each subject. An SVM classifier was employed to explore the ability of the GMV measurement to diagnose MHE, and the leave-one-out cross-validation method was used to assess classification accuracy. The SVM algorithm based on GM volumetry achieved a classification accuracy of 83.02%, with a sensitivity of 83.33% and a specificity of 82.76%. The majority of the most discriminative GMVs were located in the bilateral frontal lobe, bilateral lentiform nucleus, bilateral thalamus, bilateral sensorimotor areas, bilateral visual regions, bilateral temporal lobe, bilateral cerebellum, left inferior parietal lobe, and right precuneus/posterior cingulate gyrus. Our results suggest that SVM analysis based on GM volumetry has the potential to help diagnose MHE in cirrhotic patients.
Subject terms: Cognitive neuroscience, Computational neuroscience, Learning and memory, Computational biology and bioinformatics, Neuroscience, Neurology
Introduction
Cirrhotic patients with liver dysfunction often exhibit alterations in brain structure. Neuronal cell loss was shown to be associated with liver failure and is likely induced by chronic portosystemic shunting and ammonia exposure1. Many neuropathological studies have reported that cirrhosis involves a loss of brain parenchyma2. Previous findings from in vivo computed tomography studies also revealed brain atrophy in alcoholic and non-alcoholic cirrhosis3,4. In addition, Zeneroli and colleagues5 showed compelling evidence of brain atrophy in cirrhotic patients with hepatic encephalopathy (HE) using magnetic resonance imaging (MRI). Quite recently, reductions in the density of gray matter and white matter in cirrhotic patients without overt HE were reported6. From the findings above, we see that the literature has repeatedly documented a decline in brain mass that accompanied advanced liver disease3,6. Additionally, it was implied that brain structural impairments may increase susceptibility to various neurotoxic substances derived from hepatic dysfunction-associated metabolic disorders, such as ammonia and manganese7. More importantly, these structural alterations were suggested to be associated with abnormal brain electrophysiological activity and poor psychometric performance in cirrhotic patients8. Therefore, measurement of structural alterations in the brain may be helpful to assess potential brain dysfunction in cirrhotic patients.
As an early stage of HE, minimal HE (MHE) represents the mildest form of neuropsychological dysfunction related to cirrhosis. The symptoms of MHE include an array of mild neurocognitive impairments, such as psychomotor retardation, memory impairments, attention deficits, and diminished executive function9. There is increasing evidence showing that MHE negatively affects quality of life10, impairs driving capabilities11, predicts the development of overt HE12, and heightens the risk of death13,14. The clinical manifestations of MHE are too mild to be identified by routine physical and neurological examinations. MHE patients are often misdiagnosed or left untreated because their subtle neurocognitive impairments require specific neuropsychological and neurophysiological tests to be detected15.
Notably, the structural abnormalities occurring in the gray matter (GM) are considered to contribute to the neuropsychological dysfunction in MHE and have been associated with the progression of HE6,16,17. Several studies even proposed that regional GM morphometry (such as regional volume and cortical thickness measurements) could help to predict the existence of MHE18,19. Given these findings, we used a support vector machine (SVM) learning method to test the extent to which GM volumetry can distinguish between cirrhotic patients with and without MHE. Additionally, this study aimed to identify the specific GM regions that contributed the most to differentiating between the two patient groups.
Subjects and Methods
Subjects
This study was approved by the Research Ethics Committee of Fujian Medical University Union Hospital and was conducted in accordance with the Declaration of Helsinki. Written informed consent was obtained from all the study subjects: cirrhotic patients with MHE (n = 24) and those without MHE (NHE, n = 29). Table 1 lists the demographic and clinical characteristics of the study participants. Exclusion criteria included a current diagnosis of overt HE or other neuropsychiatric disorders, the use of psychotropic medications, the presence of uncontrolled endocrine diseases and metabolic diseases such as thyroid dysfunction, or recent alcohol abuse (less than six months prior to the study). The diagnosis of OHE was based on the West Haven criteria15. MHE was diagnosed using the Psychometric Hepatic Encephalopathy Score (PHES), which is comprised of a battery of neuropsychological assessments including the digit symbol test, number connection test A, number connection test B, serial dotting test, and line tracing test. The patient with PHES score ≤ 5 was diagnosed as MHE. Details about the PHES examination and MHE diagnosis have been described previously20,21.
Table 1.
Demographic and clinical features of the study cohort (cirrhotic patients with and without minimal hepatic encephalopathy, MHE and NHE).
| Characteristics | NHE patients (n = 29) | MHE patients (n = 24) | P-value |
|---|---|---|---|
| Age (years) | 52.6 ± 9.7 | 50.6 ± 8.9 | 0.46 |
| Sex (male/female) | 24/5 | 20/4 | 0.96 (χ2-test) |
| Education (years) | 8.3 ± 3.2 | 8.7 ± 2.7 | 0.64 |
| Etiology of cirrhosis (HBV/alcoholism/HBV + alcoholism/other) | 21/3/2/3 | 14/5/2/3 | — |
| Child–Pugh stage (A/B/C) | 19/8/2 | 4/14/6 | 0.001 |
| Previous episode of overt hepatic encephalopathy (no/yes) | 19/10 | 10/14 | 0.08 (χ2-test) |
| PHES test | |||
| Final PHES (score) | −0.6 ± 2.2 | −7.8 ± 3.3 | <0.001 |
| Number connection test A (seconds) | 39.3 ± 10.8 | 55.7 ± 17.6 | <0.001 |
| Number connection test B (seconds) | 74.6 ± 26.9 | 127.8 ± 63.1 | <0.001 |
| Serial dotting test (seconds) | 46.7 ± 9.6 | 64.0 ± 18.2 | <0.001 |
| Digit symbol test (raw score) | 41.1 ± 12.8 | 28.2 ± 9.5 | <0.001 |
| Line tracing test (raw score) | 141.4 ± 34.0 | 192.5 ± 46.6 | <0.001 |
MRI acquisition
A 3-T MR scanner (Siemens, Verio, Germany) was used to acquire high-resolution T1-weighted images with a magnetization-prepared rapid gradient echo (MPRAGE) sequence. Image acquisition parameters were as follows: time to repetition (TR) = 1900 ms, time to echo (TE) = 2.48 ms, flip angle = 9 °, field of view (FOV) = 256 mm × 256 mm, matrix = 256 × 256, number of sagittal slices = 176, and slice thickness = 1 mm.
MRI processing
Image processing was performed using Statistical Parametric Mapping software (SPM8) (http://www.fil.ion.ucl.ac.uk/spm/software/spm8/). In brief, the standard unified segmentation model in SPM8 was used to separate the structural MRI images into gray matter, white matter, and cerebrospinal fluid. Then, the Diffeomorphic Anatomical Registration Through Exponentiated Lie algebra (DARTEL) approach was employed to generate a GM template from all the images22 and the template was spatially registered to the tissue probability map in standard Montreal Neurological Institute space. Following this affine registration, each gray matter MR image was non-linearly warped to the above GM template with a 1.5-mm cubic resolution. The GM volume of a single voxel was calculated by multiplying the GM map by the non-linear determinants derived from the spatial normalization step. Finally, the resulting images were refined by smoothing with an 8 mm3 full-width at half-maximum (FWHM) kernel.
Support vector machine analysis
Compared to other classification algorithms, SVMs have good performance and generalization capability when processing small-sample data23,24. Through the kernel transformation, SVMs can map the input objects into a higher dimension space. In order to make the classification accuracy as high as possible, a hyperplane needs to be selected to maximize the margin of separation between distinct classes. The key problem for SVMs is how to construct the optimal hyperplane.
Assuming a binary classification problem, the input training data has samples in the form of , where is an -dimensional vector and is the class label. The optimal hyperplane that separates the given data is then defined as
| 11 |
where w is the “normal vector” perpendicular to the hyperplane, b is the offset parameter, Φ is the function of nonlinear transformation, and T represents the matrix transpose. Through mathematical derivation, the SVM classifier with the maximum margin can be obtained by optimizing the following function:
| 1.2 |
where is the “slack variable” representing the amount by which each data point deviates from the separation margin, and is a predetermined constant that controls the balance between the training errors and the misclassification tolerance. Once the “normal vector” and the offset parameter b in Eq. (1.2) are calculated, the classification (class label yi) can be predicted for a new sample based on Eq. (1.1). Accordingly, as shownin Fig. 1, when the parameters w and b were calculated, the decision boundary could be described by the equations wTx + b = +1 and wTx + b = −1. These decision boundaries were chosen in order to achieve the maximum margin separating the two classes. The data points lying on the decision boundaries are called “support vectors”.
Figure 1.
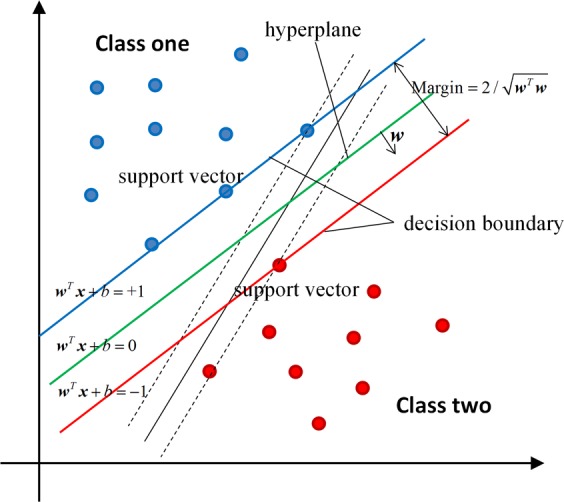
A schematic diagram demonstrating the SVM concept with a linear kernel. The optimal hyperplane is defined by . The sample whose feature x satisfies the condition was classified as NHE, while the sample whose feature x satisfies the condition was classified as MHE.
In this study, the SVM algorithm was carried out using the PRoNTo software (Pattern Recognition for Neuroimaging Toolbox, version 2.1, http://www.mlnl.cs.ucl.ac.uk/pronto/prtsoftware.html)25. Each T1-weighted structural image was considered one data point in a high-dimensional space defined by the GM volume (GMV) value. In this high dimensional space, the linear decision boundaries classified the brain scans based on their class label (i.e., the NHE and MHE groups). Specifically, the classifier was trained by providing the samples in the form of to find the optimal hyperplane, where represented the input GMV feature and was the class label (NHE and MHE). The optimal hyperplane was computed based on the varying patterns of GMV values across each T1-weighted image.
We chose a linear kernel over a non-linear kernel for several reasons. Firstly, non-linear kernels do not improve prediction accuracy in the high-dimensional space26,27. More importantly, a linear kernel reduces the risk of over-fitting, can greatly increase computational efficiency, and permits whole-brain classification without dimensionality reduction28. The similarity matrix was pre-computed using the linear kernel in the PRoNTo software and was then provided to the SVM classifier. The elements in the similarity matrix were calculated as the “dot product” of the input GMV features in the high-dimensional space. Then, the SVM classifier can extract the weight vector (i.e. the “normal vector” w) as an SVM discrimination map. The weight metric (Wi in Table 2) indicates the strength of the contribution of the GMV feature to the SVM classifier. In our study, we set the parameter C = 1 according to previous neuroimaging studies29,30. It is noted that the several factors (i.e. individual age, sex, and education level), were included as covariates and regressed out using PRoNTo software, before building the SVM model.
Table 2.
Brain regions contributing to the identification of MHE vs. NHE.
| Cluster size (voxel number) | Gray matter region | Brodmann area | MNI coordinates | Wi (×10−3) | ||
|---|---|---|---|---|---|---|
| x | y | z | ||||
| NHE group > MHE group | ||||||
| 1115 | Left Inferior Parietal Lobule | 40/7 | −30 | −49.5 | 42 | 9.998 |
| 369 | Left Middle and Superior Occipital Gyrus | 19/18 | −27 | −81 | 19.5 | 5.695 |
| 795 | Left Middle and Inferior Temporal Gyrus | 38/20 | −34.5 | 0 | −45 | 5.679 |
| 622 | Left Middle and Superior Temporal Gyrus | 22/21 | −52.5 | −40.5 | 0 | 5.580 |
| 936 | Left Inferior Frontal Gyrus | 9/6 | −55.5 | −4.5 | 22.5 | 5.508 |
| 259 | Right Superior and Middle Occipital Gyrus | 18/19 | 24 | −85.5 | 21 | 5.007 |
| 265 | Left Middle Frontal Gyrus | 6 | −24 | −4.5 | 51 | 5.001 |
| 261 | Right Fusiform Gyrus | 20/36 | 43.5 | −30 | −22.5 | 4.856 |
| 331 | Right Cerebellum Posterior Lobe | 21 | −66 | −49.5 | 4.797 | |
| 246 | Left Middle Frontal Gyrus | 9 | −34.5 | 31.5 | 30 | 4.659 |
| 255 | Right Inferior and Middle Frontal Gyrus | 9/6 | 39 | 4.5 | 33 | 4.655 |
| 349 | Right Putamen and Pallidum | 21 | 10.5 | −4.5 | 4.564 | |
| 259 | Right Middle Frontal Gyrus | 9 | 34.5 | 33 | 28.5 | 4.548 |
| 616 | Left Superior and Middle Frontal Gyrus | 11/10 | −25.5 | 48 | −15 | 4.350 |
| 306 | Right Precuneus and Posterior Cingulate Gyrus | 7/31 | 4.5 | −55.5 | 34.5 | 4.220 |
| 213 | Left Supramarginal Gyrus | 40 | −55.5 | −43.5 | 30 | 4.095 |
| 218 | Right Calcarine | 30 | 24 | −63 | 7.5 | 4.053 |
| 316 | Right Middle and Superior Frontal Gyrus | 10/11 | 39 | 54 | −3 | 4.031 |
| 208 | Left Putamen and Pallidum | −22.5 | 7.5 | −1.5 | 4.023 | |
| 296 | Right Cerebellum Posterior Lobe | 24 | −82.5 | −34.5 | 3.755 | |
| 302 | Left Cerebellum Posterior Lobe | −28.5 | −79.5 | −28.5 | 3.597 | |
| NHE group < MHE group | ||||||
| 3159 | Left Precentral and Postcentral Gyrus | 4/6/3 | −25.5 | −19.5 | 70.5 | −8.455 |
| 1837 | Bilateral Thalamus | −7.5 | −27 | 4.5 | −7.987 | |
| 1943 | Left Lingual Gyrus | 18/17/19 | 0 | −90 | −18 | −6.352 |
| 841 | Right Precentral and Postcentral Gyrus | 4/5/3 | 27 | −33 | 70.5 | −5.644 |
| 376 | Left Supramarginal Gyrus and Superior Temporal Gyrus | 39/22 | −46.5 | −54 | 19.5 | −5.563 |
| 972 | Left Cerebellum Posterior Lobe | −25.5 | −43.5 | −49.5 | −5.342 | |
| 548 | Right Cuneus and Precuneus | 31/7 | 18 | −64.5 | 28.5 | −5.026 |
| 244 | Right Cerebellum Posterior Lobe | 24 | −42 | −49.5 | −5.019 | |
| 827 | Right Middle and Inferior Occipital Gyrus | 19/18 | 43.5 | −69 | −13.5 | −4.910 |
| 440 | Left Middle Occipital Gyrus and Middle Temporal Gyrus | 39/19 | −42 | −76.5 | 16.5 | −4.865 |
| 716 | Left Insula | 13 | −37.5 | −3 | −4.5 | −4.776 |
| 333 | Bilateral Rectus | 25 | 1.5 | 22.5 | −22.5 | −4.448 |
| 274 | Left Postcentral Gyrus | 2 | −57 | −30 | 31.5 | −4.308 |
| 725 | Left Cerebellum Anterior Lobe | −24 | −34.5 | −27 | −4.127 | |
| 248 | Left Inferior Temporal Gyrus | 20 | −51 | −22.5 | −30 | −4.048 |
| 346 | Right Inferior Temporal Gyrus | 20 | 43.5 | −10.5 | −39 | −4.001 |
Note: The above brain regions were identified by setting the classification threshold to ≥30% of the maximum weight vector scores. The first column lists only clusters larger than 200 voxels. Wi (reported in the last column) is the weight of each cluster centroid, i.e., the value that indicates the relative contribution of the GMV feature to the SVM-based classification.
The “leave-one-out” cross-validation strategy was adopted in accordance with previous studies31,32, which excludes a single subject for testing and uses the remaining subjects for training. Every subject was excluded once to evaluate classification performance. This procedure was applied to all subjects in order to assess the overall accuracy of the SVM23. A permutation test (permutations = 1000 times) was applied to determine the statistical significance of the classification accuracy33,34.
We analyzed the correlation between the test margin and the PHES results using Pearson correlation analysis. The test margin was computed by projecting the input GMV feature onto the “normal vector” of the hyperplane. Accordingly, a larger absolute value of the test margin meant that the subject lay further away from the hyperplane.
Results
MHE patients performed significantly worse in all five subtests of the PHES assessment (resulting in a lower final score), indicating significant cognitive deficits compared to the NHE subjects.
Figure 2 shows the SVM classification performance based on GMV between the 29 NHE subjects and the 24 MHE patients. The overall accuracy rate was 83.02% (P = 0.001), with a sensitivity of 83.33% and a specificity of 82.76%. As shown in Fig. 3, the area under the receiver operating characteristic (ROC) curve was 0.94, indicating a high possibility of correctly discriminating between the NHE and MHE individuals. Pearson correlation analysis indicated a positive correlation between the test margin and the PHES results (r = 0.647, P = 1.6 × 10⁻⁷). Taken together, these results suggested that when the PHES score is far from diagnostic criteria, the subject is unlikely to be misclassified.
Figure 2.
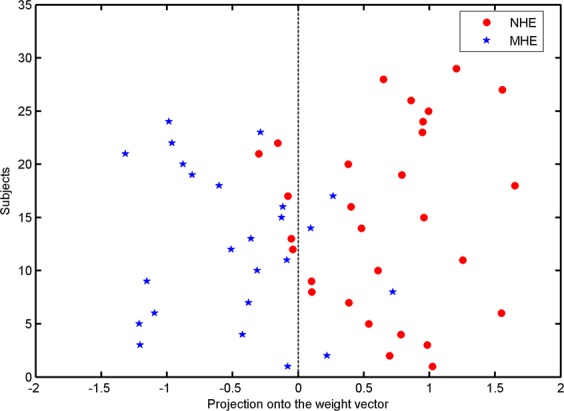
A classification plot comparing NHE patients (n = 29) and MHE patients (n = 24) using the GMV-based discrimination map generated from the T1-weighted MRI scans. The overall accuracy was 83.02% (P = 0.001), with a sensitivity of 83.33% and a specificity of 82.76%.
Figure 3.
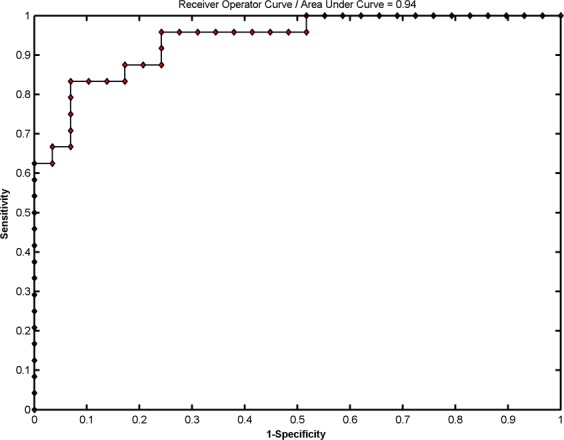
Receiver operating characteristic (ROC) curve showing the classification performance.
We identified the GM regions that were more associated with MHE or more associated with NHE by setting the threshold to ≥30% of the maximum weight vector scores, as per previous studies30,35. Those GM regions with a high absolute value of Wi had a higher discriminant power between groups. Specifically, GM regions with positive weight values were stronger contributors to recognizing individuals in the NHE group and those with negative weight values were stronger contributors to recognizing individuals in the MHE group (Table 2). Figure 4 uses a color map to indicate the GM regions with positive values (warm colors) and negative values (cold colors) in the discrimination map. The regions that contributed to identifying NHE included the bilateral frontal lobe, bilateral putamen and pallidum, bilateral middle and superior occipital gyrus, bilateral cerebellum posterior lobe, left middle and superior temporal gyrus, left middle and inferior temporal gyrus, left inferior parietal lobule, left supramarginal gyrus, right precuneus and posterior cingulate gyrus, right fusiform gyrus, and the right calcarine. GM regions that identified the MHE group included the bilateral thalamus, bilateral precentral and postcentral gyrus, bilateral inferior temporal gyrus, bilateral rectus, left lingual gyrus, left insula, left cerebellum posterior and anterior lobe, left occipital-temporal junction area, left parietal-temporal junction area, right middle and inferior occipital gyrus, right cuneus and precuneus, and the right cerebellum posterior lobe.
Figure 4.

Brain regions classified as MHE and NHE based on gray matter volumetry. The threshold was set to ≥30% of the maximum weight vector scores, and only clusters larger than 200 voxels are shown. The color bar indicates the weight value from the SVM classification, with warm colors (positive weights) representing higher parameter values in NHE subjects and cold colors (negative weights) representing higher parameter values in MHE subjects.
Discussion
In this study, SVM classification analysis with regional GMV as the indicator yielded 83.02% accuracy (83.33% sensitivity and 82.76% specificity) in classifying the MHE and NHE groups, suggesting the usefulness of gray matter volumetry in identifying early-stage hepatic encephalopathy among cirrhotic patients. Given that GM structural abnormalities exacerbate in stages as HE progresses in cirrhotic patients, and the changes of GM volume and thickness are correlated with cognitive impairments in cirrhosis, it is not unanticipated that gray matter volumetry is successful in differentiating between MHE and NHE diagnoses6,18,19. The PHES was designated as the current “gold standard” for MHE diagnosis15,36, although its disadvantages are also noted37, such as the reliance on the considerable motor activity and the existence of learning effect across the multiple tests. The GM volumetry may be helpful to overcome these disadvantages and play the important role in the assisted diagnosis. In terms of GMV data, the most informative regions were the bilateral frontal lobe, bilateral lentiform nucleus, bilateral thalamus, bilateral sensorimotor areas, bilateral visual regions, bilateral temporal lobe, bilateral cerebellum, left inferior parietal lobe, right precuneus, and the right posterior cingulate gyrus. All of these areas have been frequently reported to be affected by liver dysfunction that often induces energy metabolism disorders and deposition of neurotoxic substances in the brain38–41.
The GM regions that contributed to the identification of NHE patients had significantly higher GMV values in control NHE subjects than in the MHE subjects. This reduction of GMV that we observed in the MHE group reflected the previously reported regional atrophy in MHE6,17,18,42. For example, cirrhotic patients with MHE have consistently shown a loss of gray matter in both cortical and subcortical structures, such as the frontal and parietal lobes, limbic areas, and striatum6,42, and all of these regions were identified in the discrimination map obtained by our SVM procedure. Additionally, this decreased GMV occurred in several brain networks such as the frontoparietal network, the default mode network, and the primary and secondary visual networks. Therefore, network-oriented, regional GM atrophy may also be able to predict the relevant neurological dysfunctions that are common in MHE, such as executive dysfunction, attention deficits, and impaired visuospatial ability9,43–45. Similarly, MHE-associated neuronal loss in the basal ganglia and frontal lobe may induce the disintegration of cortico-striatal circuits subserving motor and cognitive processes46, and the reduction in cerebellar volume can affect sensorimotor processing in cirrhotic patients with MHE.
The brain regions that contributed to the identification of MHE subjects showed significantly higher GMV in MHE patients compared with NHE subjects. In agreement with this result, previous studies also revealed similar enlargements in these specific GM regions in cirrhotic patients. For example, cirrhotic patients with cognitive impairment have demonstrated a significant increase in cortical thickness in the bilateral lingual and parahippocampal gyrus, right posterior cingulate cortex, precuneus, peri-calcarine sulcus, and the fusiform gyrus47. In addition, cirrhosis is often accompanied by an increase in thalamic volume19,42,48, so much so that increased GMV in the thalamus has been regarded as an additional characteristic of MHE. Accordingly, it was not unexpected to find that GM regions, such as the bilateral thalamus, bilateral precentral and postcentral gyrus, bilateral inferior temporal gyrus, bilateral occipital lobe, bilateral cerebellum, left insula, and right precuneus, were identified in our study by SVM classification in the discrimination map.
It is important to note that the mechanisms underlying increased GMV in MHE are not well understood. One possible reason may be the diffuse, low-grade, cerebral edema related to Alzheimer’s type II astrocytes during chronic liver disease47,49. The existence of both decreases and increases in GMV in MHE may reflect brain structural reorganization due to chronic liver failure. This MHE-associated neural plasticity possibly represents a compensatory mechanism to balance the negative influences of neural metabolic abnormalities.
Despite the compelling results of our study, its limitations are three-fold. 1) The relatively small sample size restricts the statistical power of the results. Accordingly, we encourage future studies to validate the classification potential of GMV using a larger number of study subjects. 2) The MHE patients in our study exhibited mild heterogeneity in terms of the etiology of their cirrhosis and their history of overt HE. This may introduce bias in the classification results since these factors can induce varying degrees of structural and functional impairments in the brain6,48,50. 3) While we only examined the discriminative potential of gray matter changes in MHE, mapping abnormal white matter alterations may also be useful to diagnose MHE51, which should be investigated in future studies.
In summary, we successfully differentiated between cirrhotic patients with and without MHE using gray matter volumetry and an SVM classification system. The brain regions with the highest discriminant power included both cortical and subcortical structures. Therefore, our findings suggest that regional changes in GMV can be employed as a biomarker to detect MHE in cirrhotic patients.
Acknowledgements
This study was funded by the grants from the National Natural Science Foundation of China (No. 81501450), Fujian Provincial Science Fund for Distinguished Young Scholars (No. 2018J06023), Fujian Provincial Program for Distinguished Young Scholars (No. 2017B023), and Fujian Provincial Health Commission Project for Scientific Research Talents (No. 2018-ZQN-28).
Author contributions
H.J.C. and Q.F.C. conceived and designed the study, acquired and analyzed the data, and wrote the manuscript; T.X.Z. and Z.T.Y. contributed to data analysis. All authors have read and approved the manuscript.
Competing interests
The authors declare no competing interests.
Footnotes
Publisher’s note Springer Nature remains neutral with regard to jurisdictional claims in published maps and institutional affiliations.
References
- 1.Butterworth RF. Neuronal cell death in hepatic encephalopathy. Metab. Brain Dis. 2007;22:309–320. doi: 10.1007/s11011-007-9072-3. [DOI] [PubMed] [Google Scholar]
- 2.Kril JJ, Butterworth RF. Diencephalic and cerebellar pathology in alcoholic and nonalcoholic patients with end-stage liver disease. Hepatology. 1997;26:837–841. doi: 10.1002/hep.510260405. [DOI] [PubMed] [Google Scholar]
- 3.Zeneroli ML, et al. Prevalence of brain atrophy in liver cirrhosis patients with chronic persistent encephalopathy. Evaluation computed tomography. J. Of. Hepatology. 1987;4:283–292. doi: 10.1016/s0168-8278(87)80536-6. [DOI] [PubMed] [Google Scholar]
- 4.Tarter RE, et al. Cerebral morphological abnormalities associated with non-alcoholic cirrhosis. Lancet. 1986;2:893–895. doi: 10.1016/S0140-6736(86)90413-7. [DOI] [PubMed] [Google Scholar]
- 5.Zeneroli ML, et al. Globus pallidus alterations and brain atrophy in liver cirrhosis patients with encephalopathy: an MR imaging study. Magnetic Reson. Imaging. 1991;9:295–302. doi: 10.1016/0730-725X(91)90414-H. [DOI] [PubMed] [Google Scholar]
- 6.Guevara M, et al. Cerebral magnetic resonance imaging reveals marked abnormalities of brain tissue density in patients with cirrhosis without overt hepatic encephalopathy. J. Of. Hepatology. 2011;55:564–573. doi: 10.1016/j.jhep.2010.12.008. [DOI] [PubMed] [Google Scholar]
- 7.Amodio P, et al. Characteristics of minimal hepatic encephalopathy. Metab. Brain Dis. 2004;19:253–267. doi: 10.1023/B:MEBR.0000043975.01841.de. [DOI] [PubMed] [Google Scholar]
- 8.Amodio P, et al. Neuropsychological-neurophysiological alterations and brain atrophy in cirrhotic patients. Metab. Brain Dis. 2003;18:63–78. doi: 10.1023/A:1021982719654. [DOI] [PubMed] [Google Scholar]
- 9.Bajaj JS, Wade JB, Sanyal AJ. Spectrum of neurocognitive impairment in cirrhosis: Implications for the assessment of hepatic encephalopathy. Hepatology. 2009;50:2014–2021. doi: 10.1002/hep.23216. [DOI] [PubMed] [Google Scholar]
- 10.Prasad S, et al. Lactulose improves cognitive functions and health-related quality of life in patients with cirrhosis who have minimal hepatic encephalopathy. Hepatology. 2007;45:549–559. doi: 10.1002/hep.21533. [DOI] [PubMed] [Google Scholar]
- 11.Wein C, et al. Minimal hepatic encephalopathy impairs fitness to drive. Hepatology. 2004;39:739–745. doi: 10.1002/hep.20095. [DOI] [PubMed] [Google Scholar]
- 12.Romero-Gomez M, et al. Subclinical hepatic encephalopathy predicts the development of overt hepatic encephalopathy. Am. J. Gastroenterol. 2001;96:2718–2723. doi: 10.1016/S0002-9270(01)02692-2. [DOI] [PubMed] [Google Scholar]
- 13.Dhiman RK, et al. Diagnosis and prognostic significance of minimal hepatic encephalopathy in patients with cirrhosis of liver. Dig. Dis. Sci. 2010;55:2381–2390. doi: 10.1007/s10620-010-1249-7. [DOI] [PubMed] [Google Scholar]
- 14.Romero-Gomez M, Grande L, Camacho I. Prognostic value of altered oral glutamine challenge in patients with minimal hepatic encephalopathy. Hepatology. 2004;39:939–943. doi: 10.1002/hep.20152. [DOI] [PubMed] [Google Scholar]
- 15.Ferenci P, et al. Hepatic encephalopathy–definition, nomenclature, diagnosis, and quantification: final report of the working party at the 11th World Congresses of Gastroenterology, Vienna, 1998. Hepatology. 2002;35:716–721. doi: 10.1053/jhep.2002.31250. [DOI] [PubMed] [Google Scholar]
- 16.Zhang LJ, et al. The effect of hepatic encephalopathy, hepatic failure, and portosystemic shunt on brain volume of cirrhotic patients: a voxel-based morphometry study. PLoS One. 2012;7:e42824. doi: 10.1371/journal.pone.0042824. [DOI] [PMC free article] [PubMed] [Google Scholar]
- 17.Iwasa M, et al. Regional reduction in gray and white matter volume in brains of cirrhotic patients: voxel-based analysis of MRI. Metab. Brain Dis. 2012;27:551–557. doi: 10.1007/s11011-012-9314-x. [DOI] [PubMed] [Google Scholar]
- 18.Montoliu C, et al. Focal cortical damage parallels cognitive impairment in minimal hepatic encephalopathy. Neuroimage. 2012;61:1165–1175. doi: 10.1016/j.neuroimage.2012.03.041. [DOI] [PubMed] [Google Scholar]
- 19.Tao R, et al. The thalamus in cirrhotic patients with and without hepatic encephalopathy: a volumetric MRI study. Eur. J. Of. Radiology. 2013;82:e715–720. doi: 10.1016/j.ejrad.2013.07.029. [DOI] [PubMed] [Google Scholar]
- 20.Chen HJ, et al. White matter abnormalities correlate with neurocognitive performance in patients with HBV-related cirrhosis. J. Of. Neurological Sci. 2012;321:65–72. doi: 10.1016/j.jns.2012.07.056. [DOI] [PubMed] [Google Scholar]
- 21.Chen HJ, et al. Resting-state functional connectivity abnormalities correlate with psychometric hepatic encephalopathy score in cirrhosis. Eur. J. Radiol. 2015;84:2287–2295. doi: 10.1016/j.ejrad.2015.08.005. [DOI] [PubMed] [Google Scholar]
- 22.Ashburner J. A fast diffeomorphic image registration algorithm. Neuroimage. 2007;38:95–113. doi: 10.1016/j.neuroimage.2007.07.007. [DOI] [PubMed] [Google Scholar]
- 23.Pereira F, Mitchell T, Botvinick M. Machine learning classifiers and fMRI: A tutorial overview. Neuroimage. 2009;45:S199–S209. doi: 10.1016/j.neuroimage.2008.11.007. [DOI] [PMC free article] [PubMed] [Google Scholar]
- 24.Vapnik Vladimir N. The Nature of Statistical Learning Theory. New York, NY: Springer New York; 1995. [Google Scholar]
- 25.Schrouff J, et al. PRoNTo: pattern recognition for neuroimaging toolbox. Neuroinformatics. 2013;11:319–337. doi: 10.1007/s12021-013-9178-1. [DOI] [PMC free article] [PubMed] [Google Scholar]
- 26.Cox DD, Savoy RL. Functional magnetic resonance imaging (fMRI) “brain reading”: detecting and classifying distributed patterns of fMRI activity in human visual cortex. Neuroimage. 2003;19:261–270. doi: 10.1016/S1053-8119(03)00049-1. [DOI] [PubMed] [Google Scholar]
- 27.LaConte S, et al. Support vector machines for temporal classification of block design fMRI data. Neuroimage. 2005;26:317–329. doi: 10.1016/j.neuroimage.2005.01.048. [DOI] [PubMed] [Google Scholar]
- 28.Maji, S. et al. Classification using intersection kernel support vector machines is efficient. 2008 Ieee Conference on Computer Vision and Pattern Recognition, 1-12:2245− (2008).
- 29.Mourao-Miranda J, Friston KJ, Brammer M. Dynamic discrimination analysis: a spatial-temporal SVM. Neuroimage. 2007;36:88–99. doi: 10.1016/j.neuroimage.2007.02.020. [DOI] [PubMed] [Google Scholar]
- 30.Li F, et al. Multivariate pattern analysis of DTI reveals differential white matter in individuals with obsessive-compulsive disorder. Hum. Brain Mapp. 2014;35:2643–2651. doi: 10.1002/hbm.22357. [DOI] [PMC free article] [PubMed] [Google Scholar]
- 31.Gong Q, et al. Prognostic prediction of therapeutic response in depression using high-field MR imaging. Neuroimage. 2011;55:1497–1503. doi: 10.1016/j.neuroimage.2010.11.079. [DOI] [PubMed] [Google Scholar]
- 32.Modinos G, et al. Multivariate pattern classification reveals differential brain activation during emotional processing in individuals with psychosis proneness. Neuroimage. 2012;59:3033–3041. doi: 10.1016/j.neuroimage.2011.10.048. [DOI] [PubMed] [Google Scholar]
- 33.Nichols TE, Holmes AP. Nonparametric permutation tests for functional neuroimaging: a primer with examples. Hum. Brain Mapp. 2002;15:1–25. doi: 10.1002/hbm.1058. [DOI] [PMC free article] [PubMed] [Google Scholar]
- 34.Ojala M, Garriga GC. Permutation Tests for Studying Classifier Performance. J. Mach. Learn. Res. 2010;11:1833–1863. [Google Scholar]
- 35.Ecker C, et al. Investigating the predictive value of whole-brain structural MR scans in autism: a pattern classification approach. Neuroimage. 2010;49:44–56. doi: 10.1016/j.neuroimage.2009.08.024. [DOI] [PubMed] [Google Scholar]
- 36.Vilstrup H, et al. Hepatic encephalopathy in chronic liver disease: 2014 Practice Guideline by the American Association for the Study Of Liver Diseases and the European Association for the Study of the Liver. Hepatology. 2014;60:715–735. doi: 10.1002/hep.27210. [DOI] [PubMed] [Google Scholar]
- 37.Iduru S, Mullen KD. The demise of the pencil? New computer-assisted tests for minimal hepatic encephalopathy. Gastroenterology. 2008;135:1455–1456. doi: 10.1053/j.gastro.2008.09.040. [DOI] [PubMed] [Google Scholar]
- 38.Miese F, et al. 1H-MR spectroscopy, magnetization transfer, and diffusion-weighted imaging in alcoholic and nonalcoholic patients with cirrhosis with hepatic encephalopathy. AJNR Am. J. Neuroradiol. 2006;27:1019–1026. [PMC free article] [PubMed] [Google Scholar]
- 39.Rovira A, Alonso J, Cordoba J. MR imaging findings in hepatic encephalopathy. AJNR Am. J. Neuroradiol. 2008;29:1612–1621. doi: 10.3174/ajnr.A1139. [DOI] [PMC free article] [PubMed] [Google Scholar]
- 40.Zhang LJ, Zhong J, Lu GM. Multimodality MR imaging findings of low-grade brain edema in hepatic encephalopathy. AJNR Am. J. Neuroradiol. 2013;34:707–715. doi: 10.3174/ajnr.A2968. [DOI] [PMC free article] [PubMed] [Google Scholar]
- 41.Iversen P, et al. Low cerebral oxygen consumption and blood flow in patients with cirrhosis and an acute episode of hepatic encephalopathy. Gastroenterology. 2009;136:863–871. doi: 10.1053/j.gastro.2008.10.057. [DOI] [PubMed] [Google Scholar]
- 42.Qi, R. et al. Grey and white matter abnormalities in minimal hepatic encephalopathy: a study combining voxel-based morphometry and tract-based spatial statistics. European Radiology (2013). [DOI] [PubMed]
- 43.Qi R, et al. Selective impairments of resting-state networks in minimal hepatic encephalopathy. PLoS One. 2012;7:e37400. doi: 10.1371/journal.pone.0037400. [DOI] [PMC free article] [PubMed] [Google Scholar]
- 44.Vogt BA. Pain and emotion interactions in subregions of the cingulate gyrus. Nat. Rev. Neurosci. 2005;6:533–544. doi: 10.1038/nrn1704. [DOI] [PMC free article] [PubMed] [Google Scholar]
- 45.Weissman DH, et al. The neural bases of momentary lapses in attention. Nat. Neurosci. 2006;9:971–978. doi: 10.1038/nn1727. [DOI] [PubMed] [Google Scholar]
- 46.Di Martino A, et al. Functional connectivity of human striatum: a resting state FMRI study. Cereb. Cortex. 2008;18:2735–2747. doi: 10.1093/cercor/bhn041. [DOI] [PubMed] [Google Scholar]
- 47.Wu X, et al. Cortical signature of patients with HBV-related cirrhosis without overt hepatic encephalopathy: a morphometric analysis. Front. Neuroanat. 2015;9:82. doi: 10.3389/fnana.2015.00082. [DOI] [PMC free article] [PubMed] [Google Scholar]
- 48.Chen HJ, et al. Structural and functional cerebral impairments in cirrhotic patients with a history of overt hepatic encephalopathy. Eur. J. Of. Radiology. 2012;81:2463–2469. doi: 10.1016/j.ejrad.2011.10.008. [DOI] [PubMed] [Google Scholar]
- 49.Haussinger D, et al. Hepatic encephalopathy in chronic liver disease: a clinical manifestation of astrocyte swelling and low-grade cerebral edema? J. Of. Hepatology. 2000;32:1035–1038. doi: 10.1016/S0168-8278(00)80110-5. [DOI] [PubMed] [Google Scholar]
- 50.Chen HJ, et al. Brain dysfunction primarily related to previous overt hepatic encephalopathy compared with minimal hepatic encephalopathy: resting-state functional MR imaging demonstration. Radiology. 2013;266:261–270. doi: 10.1148/radiol.12120026. [DOI] [PubMed] [Google Scholar]
- 51.Montoliu, C. et al. Reduced white matter microstructural integrity correlates with cognitive deficits in minimal hepatic encephalopathy. Gut (2013). [DOI] [PubMed]