Abstract
1,3-Butadiene (BD) is a known human carcinogen found in cigarette smoke, automobile exhaust, and urban air. Workers occupationally exposed to BD in the workplace have an increased incidence of leukemia and lymphoma. BD undergoes cytochrome P450-mediated metabolic activation to 3,4-epoxy-1-butene (EB), 1,2,3,4-diepoxybutane (DEB) and 1,2-dihydroxy-3,4-epoxybutane (EBD), which form covalent adducts with DNA. We have previously reported a quantitative nanoLC/ESI+-HRMS3 method for urinary N7-(1-hydroxy-3-buten-2-yl) guanine (EB-GII) adducts as a mechanism-based biomarker of BD exposure. In the present study, the method was updated to include high throughput 96-well solid phase extraction (SPE) and employed to establish urinary EB-GII biomarker stability and association with smoking. Urinary EB-GII levels were measured bimonthly for 1 year in 19 smokers to determine whether single adduct measurement provides reliable levels of EB-GII in an individual smoker. In addition, association of EB-GII with smoking was studied in 17 individuals participating in a smoking cessation program. EB-GII levels decreased 34% upon smoking cessation, indicating that it is associated with smoking status, but may also originate from sources other than exposure to cigarette smoke.
Introduction
Lung cancer is the leading cause of cancer-related deaths (1). While cigarette smoking is a major factor in lung cancer development, the risk differs greatly among smokers, with ~15% of smokers developing lung cancer (2). It is important to identify smokers at highest risk, so that they can be targeted for smoking cessation and chemopreventive intervention. Carcinogen–DNA adducts can provide important information regarding carcinogen exposure and potentially lung cancer risk (3, 4).
1,3-butadiene (BD) is among the most abundant carcinogens in tobacco smoke (5). BD concentrations in tobacco smoke (20–75 µg per cigarette in mainstream smoke and 205–361 µg per cigarette in side stream smoke) are several orders of magnitude higher than those of other tobacco smoke carcinogens such as tobacco specific nitrosamines and polycyclic aromatic hydrocarbons (6, 7). BD is also found in urban air, automobile emissions, smoke from wood burning, and in the synthetic polymer industries (8–11). BD is a multi-site carcinogen in laboratory animals, inducing lymphocytic lymphoma, neoplasms of the heart, forestomach, Harderian gland, mammary gland, ovary, liver and the lung (12). Malignant lung tumors were observed following inhalation exposure of laboratory mice to as low as 6.25 ppm BD (13). Furthermore, BD causes chromosomal abnormalities and increases incidence of lymphatic and hematopoietic cancer in occupationally exposed workers (14–16). The International Agency for Research on Cancer classifies BD as a “known human carcinogen” based on the evidence for increased occupational cancer risk in humans and carcinogenicity studies in laboratory animals (17).
The high prevalence of BD in tobacco smoke and urban environments and the significant potential for BD-mediated health effects warrant investigations into genetic factors that govern an individual’s susceptibility to butadiene-induced cancer (6, 7, 18, 19). BD is metabolised to reactive epoxides 3,4-epoxy-1-butene (EB), 1,2,3,4-diepoxybutane (DEB) and 1,2-dihydroxy-3,4-epoxybutane (EBD) by cytochrome P450 monooxygenases (20–22). BD epoxides are detoxified by glutathione S transferases to form monohydroxybutenyl mercapturic acid (MHBMA) and dihydroxybutyl mercapturic acid (DHMBA) from EB and trihydroxylbutyl mercapturic acid (THBMA) from EBD, which are excreted in urine (23–25). BD-mercapturic acids have previously been investigated as urinary biomarkers of exposure to BD (3, 18, 23–36). Urinary MHBMA levels decreased 80–90% upon smoking cessation, confirming its association with smoking status (3, 24). In contrast, DHBMA was unaffected by smoking status, suggesting that it is not associated with smoking (3, 24).
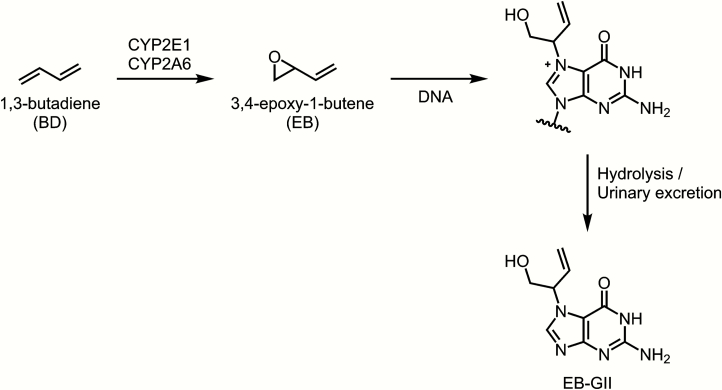
Unlike BD-mercapturic acids, which represent the metabolically inactivated dose of butadiene (19), BD-DNA adducts can be considered as mechanism-based biomarkers of exposure to BD. They can serve as useful indicators of a biologically relevant dose since they reflect the formation of reactive intermediates available for binding to DNA and other biomolecules (37, 38). EB reacts with the N7 position of guanine to form N7-(2-hydroxy-3-buten-1-yl)guanine (EB-GI) and N-7-(1-hydroxy-3-buten-2-yl)guanine (EB-GII) adducts (39, 40). The formation of EB-GII is illustrated in Figure 1. BD-DNA adducts such as EB-GI and EB-GII represent the biologically relevant carcinogen dose which is available for binding to DNA. DNA–DNA cross-links such as 1,4-bis-(guan-7-yl)-2,3-butanediol (bis-N7G-BD) and 1-(guan-7-yl)-4-(aden-1-yl)-2,3-butanediol (N7G-N1A-BD) and stable adducts such as 1,N6-(2-hydroxy-3-hydroxymethylpropan-1,3-diyl)-2′-deoxyadenosine are thought to be responsible for the carcinogenicity of BD, as they can lead to DNA polymerase errors during replication (41, 42). In contrast, the highly abundant N7-(2-hydroxy-3-buten-1-yl)guanine (EB-GI) and N-7-(1-hydroxy-3-buten-2-yl)guanine (EB-GII) adducts are not expected to be mutagenic, but can be used as biomarkers of risk associated with BD exposure (39, 43–45). These adducts are hydrolytically labile and are excreted in urine, and have been previously detected in current smokers belonging to several ethnic groups (45).
Figure 1.
Formation of EB-GII adducts from 1,3-butadiene.
Many large-scale epidemiological studies in smokers, for practical reasons, utilise a single urine sample from each individual. It is therefore important to characterise any variability in urinary EB-GII levels in the same smoker over time. We have previously developed a nanoLC-isotope dilution accurate mass spectrometry-based method for EB-GII in human urine (45). In the present study, we quantified EB-GII in 19 smokers who provided urine samples every 2 months over the course of one year in order to evaluate the use of a single measurement as typical butadiene adduct load in a given individual. Furthermore, EB-GII adduct levels were quantified in urine samples from 17 subjects participating in a smoking cessation study to examine the association of urinary EB-GII adducts with smoking and to determine its endogenous concentrations in humans.
Experimental section
Materials
LC-MS grade water, methanol and acetonitrile were purchased from Fisher Scientific (Pittsburgh, PA). Strata X polymeric reversed phase SPE cartriges (30 mg/1 ml) were purchased from Phenomenex (Torrance, CA). EB-GII and 15N5-EB-GII standards were prepared as previously reported (46, 47). 96-well plates were purchased from Analytical Sales and Services, Inc. (Ledgewood, NJ). All other chemicals and solvents were obtained from Sigma-Aldrich (Millwaukee, WI; St. Louis, MO) unless otherwise specified.
Human urine samples
Urine samples for temporal stability study were obtained as described elsewhere (4). Subjects (N = 19) were asked to collect their first void of the morning before each clinic visit. 60.9% were Caucasian, 31.9% African American, 1.5% Asian and 5.8% other ethnicity. They reported smoking 24.1 ± 10.5 (range 10–50) cigarettes per day.
Human urine samples for smoking cessation study were obtained from a previously described study (3). Baseline 24 h urine samples were collected 14 and 7 days before smoking cessation. The urine collection started with the second void on the morning of their visit and continued through the first void of the next day. Twenty-four–hour urine samples were also collected on 3, 7, 28 and 56 days after smoking cessation at clinic visits on each of those days. Seventeen (11 female) subjects participated in the study. Sixteen subjects were Caucasian, one was African American. Their mean age was 43.9 ± 11.0 years (range: 23–58). Subjects had been smoking an average of 17.3 ± 12.3 years and smoked 21.8 ± 6.7 cigarettes per day.
Urine sample processing and EB-GII adduct enrichment
Urine (200 μl) was centrifuged at 10 000g for 15 min to remove any particulate matter. The supernatants were spiked with 15N5-EB-GII (5 fmol, internal standard for mass spectrometry) and subjected to solid phase extraction (SPE) on Strata X cartridges (30 mg/1 ml; Phenomenex). SPE 96-well plate was conditioned with 2 ml of methanol, followed by 2 ml of Milli-Q water. Urine samples (200 μl) were loaded onto prepared 96-well plates, and each well was washed with 1 ml of water followed by 1 ml of 10% methanol in water. EB-GII and its internal standard were eluted with 60% methanol in water, dried under vacuum and reconstituted with 102 μl of 0.4% formic acid in water containing a 2′-deoxythymidine (dT) as an HPLC retention time marker (2.1 nmol). Offline HPLC purification of SPE-enriched EB-GII and its internal standard was achieved on an Agilent 1100 series HPLC system equipped with a UV detector and an automated fraction collector (Agilent Technologies, Santa Clara, CA). A Zorbax Eclipse XDB-C18 column (4.6 mm × 150 mm, 5 μm; Agilent Technologies, Santa Clara, CA) was eluted at a flow rate of 1 ml/min with a gradient of 0.4% formic acid in Milli-Q water (A) and HPLC-grade acetonitrile (B). Solvent composition was maintained at 0% B for 5 min and then linearly increased to 3% B in 15 min and further to 40% B in 5 min. Solvent composition was returned to 0% acetonitrile in 5 min and held at 0% for 15 min for column equilibration. UV absorbance was monitored at 254 nm. dT was used as a retention time marker. Under these conditions, dT eluted at ~17.4 min, and the retention time of EB-GII was ~15.6 min. HPLC fractions containing EB-GII and its internal standard (14.1−16.1 min) were collected into 2 ml 96-well plates (Analytical Sales and Services, Inc., Ledgewood, NJ), concentrated under vacuum, and redissolved in LC/MS grade water containing 0.01% acetic acid (30 μl) for nanoHPLC/nanoESI+-HRMS3 analysis. The injection volume was 5 μl. HPLC blanks were injected in the beginning of each sequence and after every 20 runs to detect any analyte carryover.
NanoLC/ESI+-HRMS3 analysis of urinary EB-GII
All nanoLC/ ESI+-HRMS3 analyses were conducted on a Dionex UltiMate 3000 RSLCnano HPLC system (Thermo Fisher Scientific Corp., Waltham, MA) fitted with a 5 μl injection loop and interfaced to an LTQ Orbitrap Velos instrument equipped with a nanospray source (Thermo Fisher Scientific Corp.) using a method previously reported by our laboratory (45). Gradient elution was achieved using LC/MS-grade water containing 0.01% acetic acid (A) and LC/MS-grade acetonitrile containing 0.02% acetic acid (B). Samples were loaded onto a nanoLC column (0.075 mm × 200 mm) manually packed with Synergi Hydro-RP 80 Å (4 μm) chromatographic packing (Phenomenex). The initial flow rate was maintained at 1 μl/min (with 2% B) for 5 min, followed by flow rate decrease to 300 nl/min solvent composition at 2% B for 1 min. The percentage of solvent B was linearly increased to 25% B for 9 min and further to 50% B in 10 min at a flow rate of 300 nl/min. The flow rate was increased to 1 μl/min, and solvent B was returned to 2% in 1 min, followed by 5 min column equilibration. Under these conditions, EB-GII eluted as a sharp peak at 13 min. Tandem mass spectrometry analysis was performed by fragmenting [M + H]+ ions of EB-GII (m/z 222.1) via collision induced dissociation (CID) in the linear ion trap portion of the instrument using the collision energy (CE) of 25 and an isolation width (IW) of 1.0 amu. MS/MS fragment ions at m/z 152.1 [Gua + H]+ were subjected to further fragmentation in the high collision dissociation (HCD) cell of the instrument using nitrogen as a collision gas (CE = 75 units, IW = 1.0 amu). The resulting MS3 fragment ions at m/z 135.0301 ([Gua − NH3]+) and m/z 153.0411 ([Gua − NH3 + H2O]+) were detected in the mass range of m/z 50−270 using the Orbitrap mass analyzer (HRMS) at a mass resolution of 25 000. The 15N5 labeled internal standard ([15N5]-EB-GII) was detected using an analogous MS3 scan event consisting of fragmentation of m/z 227.1 ([M + H]+) to m/z 157.1 ([15N5-Gua + H]+) and further to m/z 139.0183 ([15N5-Gua - NH3]+) and m/z 157.0283 ([15N5-Gua - NH3 + H2O]+). Neutral gain of water has been previously shown to occur in the MS collision cell due to the presence of residual water (48). Extracted ion chromatograms corresponding to the sum of m/z 135.0301 ([Gua − NH3]+) and m/z 153.0411 ([Gua − NH3 + H2O]+) were used for quantitation of EB-GII, whereas fragment ions at m/z 139.0183 ([15N5-Gua − NH3]+) and m/z 157.0283 ([15N5-Gua − NH3 + H2O]+) at 5 ppm were used for quantitation of [15N5]-EB-GII. A full scan event was also performed over the mass range of m/z 100−500 at a resolution of 15 000 to monitor for any co-eluting matrix components. EB-GII amounts were determined by comparing the areas of the nanoLC/ESI+-HRMS3 peaks corresponding to the analyte and its internal standard using standard curves generated by analysing known analyte amounts. The final EB-GII urine concentrations were normalised to urinary creatinine levels (determined separately, data not shown) to account for interindividual variability in urine flow rate and dilution.
Quality control
Internal QC samples (pooled smoker urine) were included after every 10 samples onto 96-well plates. Statistical analyses were conducted to determine coefficient of variation, and data from plates exhibiting variation >20% were discarded.
Statistical analyses
For the cessation study, a paired t-test was used to compare the initial change from baseline to Day 3. The repeated measures analysis of variance evaluated the rate of change during follow-up, starting from Day 3 to Day 56. A P-value <0.05 was considered statistically significant.
For the stability study, EB-GII measurements for each subject were plotted against time to examine the data for variability over time. Means, medians, standard deviations and coefficients of variation (CV) were computed for each time point across individuals, CV were computed for each individual over time. To examine the reliability of individual measurements of EB-GII over time, we estimated the intraclass correlation coefficient () for the logarithm of the measurements, where is the within-subject variance and is the between-subject variance:
It is estimated by
where MSb = mean-square between subjects, MSw = mean-square within subjects and k = number of measurements per subject.
Results
High throughput 96-well plate method development and validation
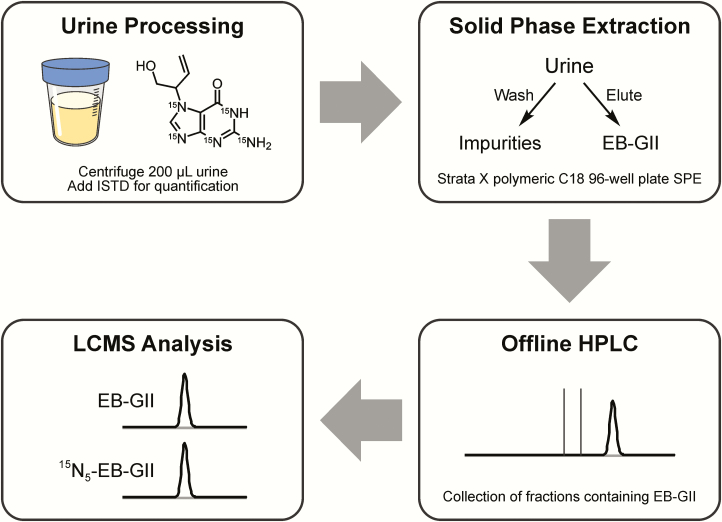
Our previous nanoLC-ESI-MS/MS methodology (45) had a relatively low throughput (<20 samples at a time) due to the use of traditional solid phase extraction as the first step in sample processing. Since the current study includes a large number of samples, we have developed a high throughput 96 well SPE (Strata™-X 33 µm polymeric reversed phase, 30 mg/well, 96-well plates) methodology using True-taper 96-well, 2 ml Polypropylene Square Tapered 100 µl Tear-Bottom plate. This new method is illustrated in Figure 2.
Figure 2.
Sample preparation procedure for high-throughput nanoLC/ESI+-HRMS3 analysis of EB-GII in urine.
For initial method validation, 200 μl aliquots of water, synthetic urine, or pooled nonsmoker urine (in triplicate) were spiked with 5 fmol of EB-GII and 5 fmol of 15N5-EB-GII (isotopically labeled internal standard) either before or after performing SPE. These samples were then dried, HPLC purified and analysed by nanoLC-ESI-MS/MS on a Thermo LTQ Quantiva to determine the analyte recovery. SPE recovery was determined by comparing the observed and theoretical 15N5-EB-GII:EB-GII peak area ratios. The analyte recovery from 96 well SPE plates was determined to be 83% in water and 75% in synthetic urine.
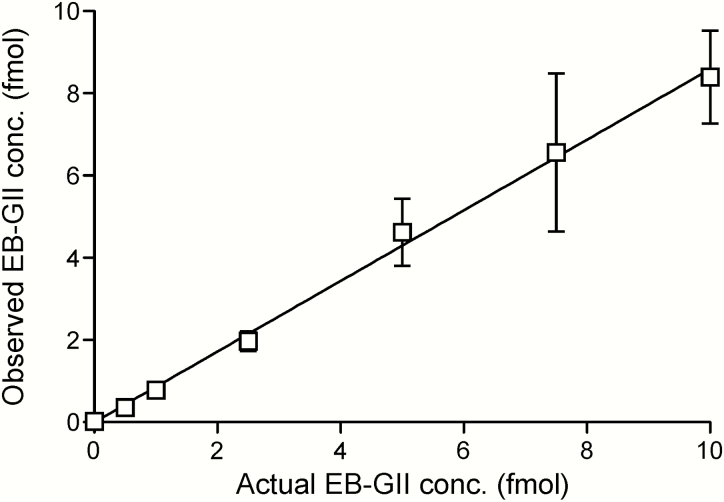
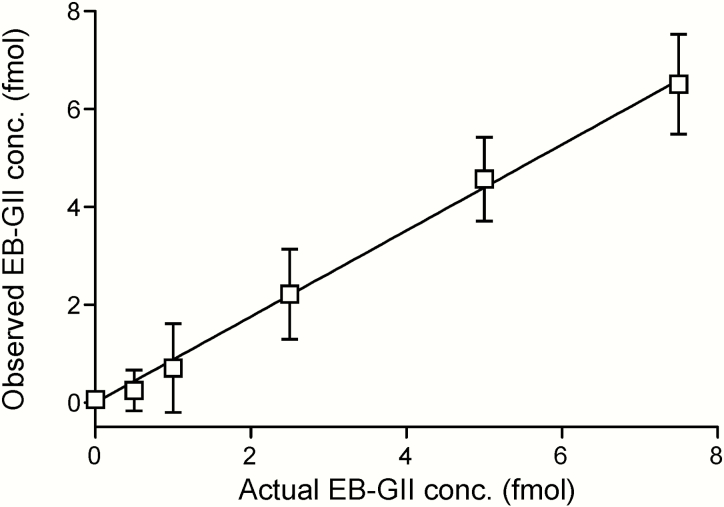
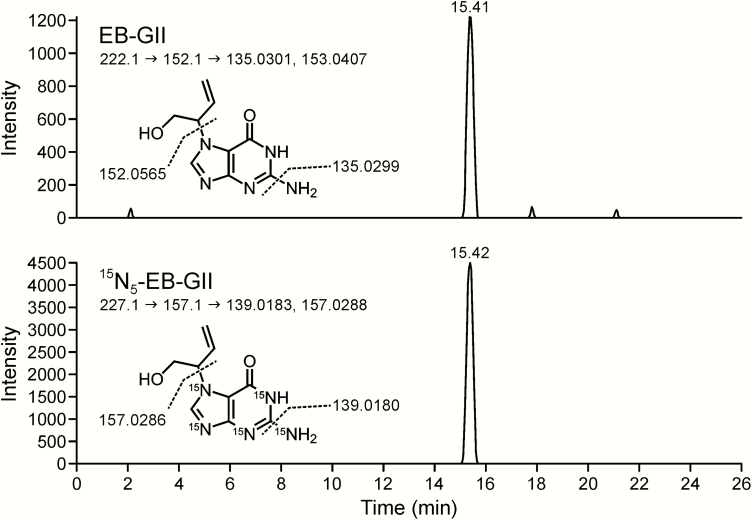
Method standard curves were constructed by analysing aqueous solutions containing 15N5-EB-GII (5 fmol) and EB-GII (0.5–10.0 fmol) in triplicate. Method validation curves were constructed by analysing synthetic urine spiked with 15N5-EB-GII (5 fmol) and EB-GII (0.5–7.5 fmol) in triplicate, followed by the sample preparation steps described above. The observed EB-GII values were plotted against the actual values. Standard curves in water produced linear curves (y = 0.859x, R2 = 0.997) (Figure 3). A linear correlation was also observed between the actual and observed EB-GII amounts in the synthetic urine matrix (y = 0.8791x, R2 = 0.9968) (Figure 4). A representative nanoLC/ESI+HRMS3 chromatogram of EB-GII quantitation in a smoker sample is shown in Figure 5.
Figure 3.
NanoLC/ESI+HRMS3 method validation: correlation between the added and observed amounts of EB-GII spiked into 30 µl water.
Figure 4.
NanoLC/ESI+HRMS3 method validation: correlation between the spiked and observed amounts of EB-GII spiked into 200 µl of synthetic urine.
Figure 5.
Representative nanoLC/ESI+HRMS3 detection of EB-GII in urine of a smoker. Top and bottom panels show extracted ion chromatogram MS3 spectra from EB-GII and 15N5-EB-GII (internal standard), respectively.
Accuracy ranging 90–110% was observed with internal QC samples analysed in the cessation sample batch. The coefficient of variation among internal QC samples analysed in the stability batch was 7.3%.
Determination of urinary EB-GII biomarker stability and intra-individual variation
To evaluate temporal biomarker stability, sensitive and specific isotope dilution nanoLC/ESI+-HRMS3 methodology was utilised to quantify EB-GII concentrations in urine of 19 smokers over time. Urine was sampled bimonthly over a period of a year for each smoker. The median, mean, SD, 95% confidence levels and range of EB-GII levels at each time point in the study are given in Table 1. Overall, urinary EB-GII concentrations ranged between 0.02 and 7.08 pg/mg creatinine among individuals and time points across the study. This illustrates the typical range of values for urinary EB-GII (45), as well as the inter-individual variation in urinary EB-GII levels.
Table 1.
Urinary EB-GII levels (pg/mg creatinine) over the course of the study
| Sampling month | N | Median | Mean | SD | 95% LCL | 95% UCL | Minimum | Maximum |
|---|---|---|---|---|---|---|---|---|
| 0 | 18 | 0.19 | 0.64 | 1.33 | −0.02 | 1.3 | 0.03 | 5.67 |
| 2 | 19 | 0.21 | 0.81 | 1.73 | −0.03 | 1.64 | 0.06 | 7.08 |
| 4 | 17 | 0.19 | 0.37 | 0.59 | 0.07 | 0.68 | 0.02 | 2.52 |
| 6 | 15 | 0.19 | 0.3 | 0.32 | 0.12 | 0.47 | 0.06 | 1.37 |
| 8 | 13 | 0.37 | 0.63 | 0.97 | 0.05 | 1.22 | 0.09 | 3.62 |
| 10 | 13 | 0.43 | 0.9 | 1.36 | 0.08 | 1.73 | 0.05 | 4.86 |
| 12 | 11 | 0.57 | 1.25 | 1.83 | 0.02 | 2.47 | 0.02 | 6.19 |
The results for intra-individual variation in urinary EB-GII levels are presented in Table 2. The coefficient of variation was calculated and averaged for each subject’s urinary EB-GII levels to obtain the overall mean coefficient of variation. The mean coefficient of variation for EB-GII was 79% when normalised to urinary creatinine levels and 82% for urinary EB-GII described as fmol/ml urine. The intraclass correlation coefficient for urinary EB-GII as 68% when normalised to creatinine and 59% if expressed as fmol/ml urine.
Table 2.
Average coefficient of variation (CV) within subjects and within- and between-subject variance and intraclass correlation coefficient for log-transformed urinary EB-GII
| Urinary EB-GII in log scale | N | Average CV within subjects (CV × 100%) (%) | Between subject variance | Within subject variance | Intraclass correlation coefficient (%) |
|---|---|---|---|---|---|
| ln(fmol/ml) | 19 | 82 | 0.6834 | 0.4818 | 59 |
| ln(pg/mg creatinine) | 19 | 79 | 0.9482 | 0.4555 | 68 |
Association of EB-GII with smoking status
To examine the association of urinary EB-GII adducts with smoking, they were quantified in urine samples from seventeen subjects participating in a smoking cessation study at the University of Minnesota (3). These subjects had been smoking for an average of 17.3 ± 12.3 years and smoked 21.8 ± 6.7 cigarettes per day. Urinary metabolites of butadiene were quantified in samples before smoking cessation and 3, 7, 28 and 56 days after smoking cessation using the nanoLC/ESI+-HRMS3 methodology described above. Abstinence from smoking was confirmed by total NNAL analyses (3).
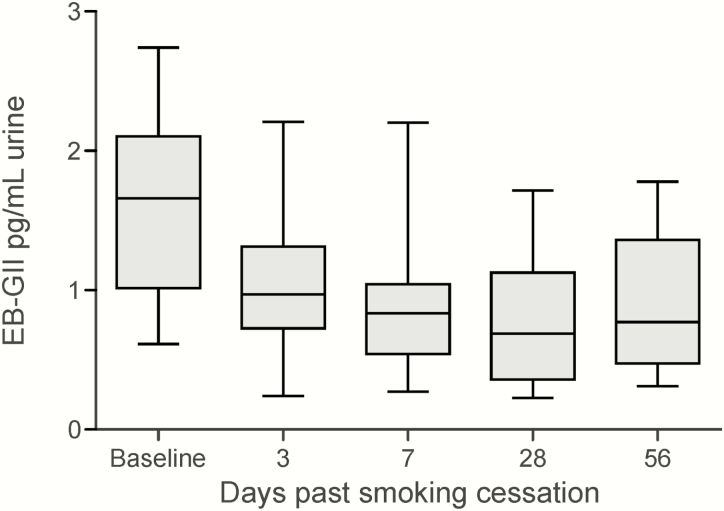
Smoking cessation data are summarised in Figure 6. Baseline urinary EB-GII adduct load in smokers was 1.63 ± 0.64 pg/ml urine. Following smoking cessation, urinary EB-GII levels rapidly dropped to 1.073 ± 0.558 pg/ml at day 3. This change was statistically significant. (P = 0.006). After the initial decline at 3 days. Further decrease on Days 7, 28, and 56 was not statistically significant.
Figure 6.
Urinary EB-GII levels (pg/ml urine) in subjects participating in a smoking cessation program. EB-GII levels decrease significantly from baseline to Day 3. Further decreases are not statistically significant.
Discussion
Smokers are exposed to a wide range of toxins and carcinogens in cigarette smoke. Exposure to tobacco smoke results in an increased risk of lung cancer development (2–5). Reliable measurements of carcinogen-DNA adducts in smokers are vital for the understanding of their exposure and cancer risk.
Toxicological risk assessments have identified BD as having a relatively high cancer risk index among all chemicals present in tobacco smoke (7). This rating is a result of high abundance of BD in cigarette smoke, its ability to induce malignant lung tumors in laboratory mice at concentrations as low as 6.25 ppm and increased cancer incidence in occupationally exposed workers (12–16).
We have previously quantified mercapturic acid metabolites of BD in urine of current smokers belonging to four different ethnic groups from the Multiethnic Cohort (18, 19). These studies had revealed that White smokers excreted the highest amounts of MHBMA, followed by African American, Native Hawaiian and Japanese smokers (18, 19). These results are consistent with low susceptibility of Japanese individuals to smoking-induced lung cancer, but cannot explain high lung cancer incidence in African Americans and Native Hawaiians (18, 19, 49, 50).
Unlike urinary mercapturic acids, which represent metabolically inactivated butadiene, nucleobase adducts such as N7-(2-hydroxy-3,4-epoxybut-1-yl)guanine (EB-GII) can be used as true biomarkers of risk associated with exposure to BD as they reflect the amount of carcinogen bound to cellular DNA. N7-(2-hydroxy-3,4-epoxybut-1-yl)guanine (EB-GII) adducts are formed when 3,4-epoxy-1-butene (EB) alkylates the N7 position of guanine in DNA. EB-GII adducts undergo spontaneous hydrolysis (depurination) under physiological conditions, followed by excretion in urine as free base adducts. We have developed ultra-sensitive analytical methodologies for quantitation of butadiene-DNA adducts in human urine and have shown that White smokers excrete 3-fold higher levels of EB-GII than African Americans (45).
The main focus of the present study was to validate EB-GII as a non-invasive biomarker of exposure to BD and to examine its association with smoking. To achieve this goal, our previous mass spectrometry method for urinary EB-GII (45) was updated to include high-throughput sample processing utilising 96-well plate solid phase extraction. EB-GII adducts were quantified in urine of 19 smokers over a period of a year. The intraclass correlation coefficient quantifies the amount of total variability that is caused by variability within subjects; the smaller the variance of measurements within subjects relative to between subjects will have an intraclass correlation coefficient closer to 100% (4). We found that the intraclass correlation coefficient for EB-GII was greater than 50%, indicating that EB-GII adducts are less variable within an individual than between individuals. These results for the first time validate the use of single point measurements of urinary EB-GII as representative of an individual’s overall EB-GII adduct load. We also found that while EB-GII is stable when described as fmol/ml urine (intraclass correlation coefficient = 59%), the variability in urinary EB-GII further decreases upon normalisation to creatinine values (intraclass correlation coefficient = 68%).
To establish their association with smoking status, urinary EB-GII adducts were quantified in 17 smokers participating in a smoking cessation study. A significant reduction in EB-GII levels were observed as early as 3 days after smoking cessation (Figure 4). These results indicate that smoking is a significant source of exposure to 1,3-butadiene and a significant factor in EB-GII DNA adduct formation. However, they also reveal the presence of endogenous, environmental or dietary sources of EB-GII in humans. Our ongoing studies will evaluate the contributions of these other sources to BD-DNA adduct formation by exploring potential dietary/endogenous sources of THBG and EB-GII adducts following the incorporation of stable isotope labeled butadiene-d6 in animals and the incorporation of 13C-labeled cellular metabolites into human cells. These experiments will elucidate the quantity of endogenous (unlabeled) and exogenous (labeled) BD-DNA adducts and identify their metabolic/dietary sources.
In summary, our results described here show that urinary EB-GII adducts are associated with smoking and are stable in human subjects over time, validating their use as a biomarker of cigarette smoke-induced DNA damage. Urinary EB-GII levels can be reliably measured from point urine samples and are associated with smoking status. Therefore, studies measuring EB-GII levels from point urine samples can provide reliable estimates of the associations between urinary EB-GII with lung cancer risk. Future studies are required to investigate the associations between EB-GII adduct levels and lung cancer development.
Funding
This work was supported by the National Cancer Institute at the National Institutes of Health [CA 138338 and CA 100670 to N.Y.T.]
References
- 1. Siegel R. L., Miller K. D. and Jemal A (2018) Cancer statistics, 2018. CA Cancer J. Clin., 68, 7–30. [DOI] [PubMed] [Google Scholar]
- 2. International Agency for Research on Cancer. (2004) Tobacco smoke and involuntary smoking. In Kaplan S. (ed.), IARC Monographs on the Evaluation of Carcinogenic Risks to Humans, vol. 83 IARC, Lyon, FR, pp. 33–1187. [PMC free article] [PubMed] [Google Scholar]
- 3. Carmella S. G., Chen M., Han S., Briggs A., Jensen J., Hatsukami D. K. and Hecht S. S (2009) Effects of smoking cessation on eight urinary tobacco carcinogen and toxicant biomarkers. Chem. Res. Toxicol., 22, 734–741. [DOI] [PMC free article] [PubMed] [Google Scholar]
- 4. Church T. R., Anderson K. E., Le C., Zhang Y., Kampa D. M., Benoit A. R., Yoder A. R., Carmella S. G. and Hecht S. S (2010) Temporal stability of urinary and plasma biomarkers of tobacco smoke exposure among cigarette smokers. Biomarkers, 15, 345–352. [DOI] [PMC free article] [PubMed] [Google Scholar]
- 5. Hecht S. S. (2003) Tobacco carcinogens, their biomarkers and tobacco-induced cancer. Nat. Rev. Cancer, 3, 733–744. [DOI] [PubMed] [Google Scholar]
- 6. Brunnemann K. D., Kagan M. R., Cox J. E. and Hoffmann D (1990) Analysis of 1,3-butadiene and other selected gas-phase components in cigarette mainstream and sidestream smoke by gas chromatography-mass selective detection. Carcinogenesis, 11, 1863–1868. [DOI] [PubMed] [Google Scholar]
- 7. Fowles J. and Dybing E (2003) Application of toxicological risk assessment principles to the chemical constituents of cigarette smoke. Tob. Control, 12, 424–430. [DOI] [PMC free article] [PubMed] [Google Scholar]
- 8. Fajen J. M., Roberts D. R., Ungers L. J. and Krishnan E. R (1990) Occupational exposure of workers to 1,3-butadiene. Environ. Health Perspect., 86, 11–18. [DOI] [PMC free article] [PubMed] [Google Scholar]
- 9. Grant R. L., Leopold V., McCant D. and Honeycutt M (2007) Spatial and temporal trend evaluation of ambient concentrations of 1,3-butadiene and chloroprene in Texas. Chem. Biol. Interact., 166, 44–51. [DOI] [PubMed] [Google Scholar]
- 10. Gustafson P., Barregard L., Strandberg B. and Sällsten G (2007) The impact of domestic wood burning on personal, indoor and outdoor levels of 1,3-butadiene, benzene, formaldehyde and acetaldehyde. J. Environ. Monit., 9, 23–32. [DOI] [PubMed] [Google Scholar]
- 11. Pelz N., Dempster N. M. and Shore P. R (1990) Analysis of low molecular weight hydrocarbons including 1,3-butadiene in engine exhaust gases using an aluminum oxide porous-layer open-tubular fused-silica column. J. Chromatogr. Sci, 28, 230–235. [DOI] [PubMed] [Google Scholar]
- 12. Himmelstein M. W., Acquavella J. F., Recio L., Medinsky M. A. and Bond J. A (1997) Toxicology and epidemiology of 1,3-butadiene. Crit. Rev. Toxicol, 27, 1–108. [DOI] [PubMed] [Google Scholar]
- 13. Melnick R. L., Huff J., Chou B. J. and Miller R. A (1990) Carcinogenicity of 1,3-butadiene in C57BL/6 x C3H F1 mice at low exposure concentrations. Cancer Res., 50, 6592–6599. [PubMed] [Google Scholar]
- 14. Cheng H., Sathiakumar N., Graff J., Matthews R. and Delzell E (2007) 1,3-Butadiene and leukemia among synthetic rubber industry workers: exposure–response relationships. Chem. Biol. Interact., 166, 15–24. [DOI] [PubMed] [Google Scholar]
- 15. Delzell E., Sathiakumar N., Hovinga M., Macaluso M., Julian J., Larson R., Cole P. and Muir D. C (1996) A follow-up study of synthetic rubber workers. Toxicology, 113, 182–189. [DOI] [PubMed] [Google Scholar]
- 16. Sathiakumar N., Graff J., Macaluso M., Maldonado G., Matthews R. and Delzell E (2005) An updated study of mortality among North American synthetic rubber industry workers. Occup. Environ. Med, 62, 822–829. [DOI] [PMC free article] [PubMed] [Google Scholar]
- 17. International Agency for Research on Cancer. (2008) 1,3-Butadiene, ethylene oxide and vinyl halides (vinyl fluoride, vinyl chloride and vinyl bromide). In Mitchell J. (ed.), IARC Monographs on the Evaluation of Carcinogenic Risks to Humans, vol. 97 IARC, Lyon, FR. [PMC free article] [PubMed] [Google Scholar]
- 18. Boldry E. J., Patel Y. M., Kotapati S., Esades A., Park S. L., Tiirikainen M., Stram D. O., Le Marchand L. and Tretyakova N (2017) Genetic determinants of 1,3-butadiene metabolism and detoxification in three populations of smokers with different risks of lung cancer. Cancer Epidemiol. Biomarkers Prev., 26, 1034–1042. [DOI] [PMC free article] [PubMed] [Google Scholar]
- 19. Park S. L., Kotapati S., Wilkens L. R., Tiirikainen M., Murphy S. E., Tretyakova N. and Le Marchand L (2014) 1,3-Butadiene exposure and metabolism among Japanese American, Native Hawaiian, and White smokers. Cancer Epidemiol. Biomarkers Prev., 23, 2240–2249. [DOI] [PMC free article] [PubMed] [Google Scholar]
- 20. Csanády G., Guengerich F.P. and Bond J.A (1993) Comparison of the biotransformation of 1,3-butadiene and its metabolite, butadiene monoepoxide, by hepatic and pulmonary tissues from humans, rats and mice. Carcinogenesis, 14, 783–784. [DOI] [PubMed] [Google Scholar]
- 21. Duescher R. J. and Elfarra A. A (1994) Human liver microsomes are efficient catalysts of 1,3-butadiene oxidation: evidence for major roles by cytochromes P450 2A6 and 2E1. Arch. Biochem. Biophys., 311, 342–349. [DOI] [PubMed] [Google Scholar]
- 22. Elfarra A. A., Krause R. J. and Selzer R. R (1996) Biochemistry of 1,3-butadiene metabolism and its relevance to 1,3-butadiene-induced carcinogenicity. Toxicology, 113, 23–30. [DOI] [PubMed] [Google Scholar]
- 23. Boogaard P. J., van Sittert N. J. and Megens H. J (2001) Urinary metabolites and haemoglobin adducts as biomarkers of exposure to 1,3-butadiene: a basis for 1,3-butadiene cancer risk assessment. Chem. Biol. Interact., 135–136, 695–701. [DOI] [PubMed] [Google Scholar]
- 24. Kotapati S., Matter B. A., Grant A. L. and Tretyakova N. Y (2011) Quantitative analysis of trihydroxybutyl mercapturic acid, a urinary metabolite of 1,3-butadiene, in humans. Chem. Res. Toxicol, 24, 1516–1526. [DOI] [PMC free article] [PubMed] [Google Scholar]
- 25. van Sittert N. J., Megens H. J., Watson W. P. and Boogaard P. J (2000) Biomarkers of exposure to 1,3-butadiene as a basis for cancer risk assessment. Toxicol. Sci, 56, 189–202. [DOI] [PubMed] [Google Scholar]
- 26. Bechtold W. E., Strunk M. R., Chang I. Y., Ward J. B. Jr and Henderson R. F (1994) Species differences in urinary butadiene metabolites: comparisons of metabolite ratios between mice, rats, and humans. Toxicol. Appl. Pharmacol, 127, 44–49. [DOI] [PubMed] [Google Scholar]
- 27. Ding Y. and Blount B (2009) Simultaneous determination of six mercapturic acid metabolites of volatile organic compounds in human urine. Chem. Res. Toxicol., 22, 1018–1025. [DOI] [PubMed] [Google Scholar]
- 28. Fustinoni S., Perbellini L., Soleo L., Manno M. and Foà V (2004) Biological monitoring in occupational exposure to low levels of 1,3-butadiene. Toxicol. Lett., 149, 353–360. [DOI] [PubMed] [Google Scholar]
- 29. Fustinoni S., Soleo L., Warholm M., Begemann P., Rannug A., Neumann H. G., Swenberg J. A., Vimercati L. and Colombi A (2002) Influence of metabolic genotypes on biomarkers of exposure to 1,3-butadiene in humans. Cancer Epidemiol. Biomarkers Prev., 11, 1082–1090. [PubMed] [Google Scholar]
- 30. Kotapati S., Esades A., Matter B., Le C. and Tretyakova N (2015) High throughput HPLC-ESI(−)-MS/MS methodology for mercapturic acid metabolites of 1,3-butadiene: biomarkers of exposure and bioactivation. Chem. Biol. Interact., 241, 23–31. [DOI] [PMC free article] [PubMed] [Google Scholar]
- 31. Kotapati S., Sangaraju D., Esades A., Hallberg L., Walker V. E., Swenberg J. A. and Tretyakova N. Y (2014) Bis-butanediol-mercapturic acid (bis-BDMA) as a urinary biomarker of metabolic activation of butadiene to its ultimate carcinogenic species. Carcinogenesis, 35, 1371–1378. [DOI] [PMC free article] [PubMed] [Google Scholar]
- 32. Li W., Chen J., Jiang D., Xin C., Cao Y. and Li F (2015) Sensitive determination of two major mercapturic acid metabolites of 1,3-butadiene in human urine based on the isotope dilution ultrahigh performance liquid chromatography-tandem mass spectrometry. Anal Methods, 7, 4691–4698. [Google Scholar]
- 33. Sapkota A., Halden R. U., Dominici F., Groopman J. D. and Buckley T. J (2006) Urinary biomarkers of 1,3-butadiene in environmental settings using liquid chromatography isotope dilution tandem mass spectrometry. Chem. Biol. Interact., 160, 70–79. [DOI] [PubMed] [Google Scholar]
- 34. Schettgen T., Musiol A., Alt A., Ochsmann E. and Kraus T (2009) A method for the quantification of biomarkers of exposure to acrylonitrile and 1,3-butadiene in human urine by column-switching liquid chromatography-tandem mass spectrometry. Anal. Bioanal. Chem, 393, 969–981. [DOI] [PubMed] [Google Scholar]
- 35. Urban M., Gilch G., Schepers G., van Miert E. and Scherer G (2003) Determination of the major mercapturic acids of 1,3-butadiene in human and rat urine using liquid chromatography with tandem mass spectrometry. J. Chromatogr. B. Analyt. Technol. Biomed. Life Sci, 796, 131–140. [DOI] [PubMed] [Google Scholar]
- 36. Zhang X., Hou H., Chen H., Liu Y., Wang A. and Hu Q (2015) A column-switching LC-MS/MS method for simultaneous quantification of biomarkers for 1,3-butadiene exposure and oxidative damage in human urine. J. Chromatogr. B. Analyt. Technol. Biomed. Life Sci, 1002, 123–129. [DOI] [PubMed] [Google Scholar]
- 37. Cochrane J. E. and Skopek T. R (1994) Mutagenicity of butadiene and its epoxide metabolites: II. mutational spectra of butadiene, 1,2-epoxybutene and diepoxybutane at the hprt locus in splenic T cells from exposed B6C3F1 mice. Carcinogenesis, 15, 719–723. [DOI] [PubMed] [Google Scholar]
- 38. Kirman C. R., Albertini R. A. and Gargas M. L (2010) 1,3-Butadiene: III. assessing carcinogenic modes of action. Crit. Rev. Toxicol., 40(suppl. 1), 74–92. [DOI] [PubMed] [Google Scholar]
- 39. Koc H., Tretyakova N. Y., Walker V. E., Henderson R. F. and Swenberg J. A (1999) Molecular dosimetry of N-7 guanine adduct formation in mice and rats exposed to 1,3-butadiene. Chem. Res. Toxicol, 12, 566–574. [DOI] [PubMed] [Google Scholar]
- 40. Tretyakova N. Y., Lin Y. P., Upton P. B., Sangaiah R. and Swenberg J. A (1996) Macromolecular adducts of butadiene. Toxicology, 113, 70–76. [DOI] [PubMed] [Google Scholar]
- 41. Carmical J. R., Nechev L. V., Harris C. M., Harris T. M. and Lloyd R. S (2000) Mutagenic potential of adenine N(6) adducts of monoepoxide and diolepoxide derivatives of butadiene. Environ. Mol. Mutagen., 35, 48–56. [PubMed] [Google Scholar]
- 42. Kotapati S., Wickramaratne S., Esades A., Boldry E. J., Quirk Dorr D., Pence M. G., Guengerich F. P. and Tretyakova N. Y (2015) Polymerase bypass of N(6)-deoxyadenosine adducts derived from epoxide metabolites of 1,3-butadiene. Chem. Res. Toxicol, 28, 1496–1507. [DOI] [PMC free article] [PubMed] [Google Scholar]
- 43. Boysen G., Pachkowski B. F., Nakamura J. and Swenberg J. A (2009) The formation and biological significance of N7-guanine adducts. Mutat. Res., 678, 76–94. [DOI] [PMC free article] [PubMed] [Google Scholar]
- 44. Gates K. S., Nooner T. and Dutta S (2004) Biologically relevant chemical reactions of N7-alkylguanine residues in DNA. Chem. Res. Toxicol., 17, 839–856. [DOI] [PubMed] [Google Scholar]
- 45. Sangaraju D., Boldry E. J., Patel Y. M., Walker V., Stepanov I., Stram D., Hatsukami D. and Tretyakova N (2017) Isotope dilution nanoLC/ESI+-HRMS3 quantitation of urinary N7-(1-Hydroxy-3-buten-2-yl) guanine adducts in humans and their use as biomarkers of exposure to 1,3-butadiene. Chem. Res. Toxicol., 30, 678–688. [DOI] [PMC free article] [PubMed] [Google Scholar]
- 46. Citti L., Gervasi P. G., Turchi G., Bellucci G. and Bianchini R (1984) The reaction of 3,4-epoxy-1-butene with deoxyguanosine and DNA in vitro: synthesis and characterization of the main adducts. Carcinogenesis, 5, 47–52. [DOI] [PubMed] [Google Scholar]
- 47. Tretyakova N., Lin Y., Sangaiah R., Upton P. B. and Swenberg J. A (1997) Identification and quantitation of DNA adducts from calf thymus DNA exposed to 3,4-epoxy-1-butene. Carcinogenesis, 18, 137–147. [DOI] [PubMed] [Google Scholar]
- 48. Tuytten R., Lemière F., Van Dongen W., Esmans E. L., Witters E., Herrebout W., Van Der Veken B., Dudley E. and Newton R. P (2005) Intriguing mass spectrometric behavior of guanosine under low energy collision-induced dissociation: H2O adduct formation and gas-phase reactions in the collision cell. J. Am. Soc. Mass Spectrom., 16, 1291–1304. [DOI] [PubMed] [Google Scholar]
- 49. Haiman C. A., Stram D. O., Wilkens L. R., Pike M. C., Kolonel L. N., Henderson B. E. and Le Marchand L (2006) Ethnic and racial differences in the smoking-related risk of lung cancer. N. Engl. J. Med, 354, 333–342. [DOI] [PubMed] [Google Scholar]
- 50. Stram D. O., Park S. L., Haiman C. A., Murphy S. E., Patel Y., Hecht S. S. and Le Marchand L (2019) Racial/ethnic differences in lung cancer incidence in the Multiethnic Cohort Study: an update. J. Natl. Cancer Inst. 111, 811–819. [DOI] [PMC free article] [PubMed] [Google Scholar]


