

Abstract
Objective
The aim of this study was to compare arch changes before and after maxillary expansion with Transverse Maxillary Sagittal Expander (TSME) and Hyrax Palatal Expander (HPE), in growing patients with diagnosis of maxillary hypoplasia.
Materials and methods
The sample consisted of 40 patients’ records (20 males 20 females mean age 9.2 ± 2.6 years) were selected from the archive of the Orthodontic Department of the University of Milan, Italy. Patients were randomly divided in two groups: patients in group 1 were treated with HPE as they presented only transverse deficiency of the maxilla and in group 2 were treated with TSME. Plaster models have been measured with a Verniere caliper to evaluate the differences in maxillary expansion of the two devices. Measurements were performed on casts poured from impressions taken before appliance bonding (T0), immediately after appliance debonding (T1) and at 6 months follow-up (T2). The variations in the following distances have been considered: inter-molar distance, inter-canine distance, palatal depth, palatal length and arch circumference. Shapiro-Wilk test was performed to assess normality distribution. ANOVA for repeated measures with multiple paired t-test for pairwise comparisons and its non-parametric equivalent Friedman’s test with multiple Wilcoxon tests for pairwise comparisons were performed to evaluate changes in time of each variable in each group. Between groups comparisons were performed for each variable at each observing time using independent t-test or Mann-Whitney test. Significance level was set at p < 0,05.
Results
Both the Friedman test and the rm-ANOVA test and their respective post-hoc show that within both groups the respective variables have a statistically significant increase between T0 and T1 (p < 0,05) and a slight decrease between T1 and T2 (p < 0,05) that is not clinically relevant remaining always T2 greater than T0 in a statistically and clinically relevant way (p < 0,05). The analysis between the differences of the measurements at different timing measured by the Mann-Whitney test shows that for all the variables there is no statistically significant difference between the 2 devices (p < 0,05), except for the perimeter of the arch and the length of the palate; in this case it appeared that the TSME is better statistically (p < 0,05).
Conclusions
The study has shown that RPE and TSME can achieve similar results in transversal palatal expansion. Differences have been found in the palatal length and in the arch perimeter where TSME seems to be more efficient.
Keywords: Rapid maxillary expansion, Transverse sagittal maxillary expander (TSME), Maxillary hypoplasia, Cross bite
1. Introduction
Maxillary hypoplasia is one of the most common orthodontic problem in clinical practice. It is usually characterized by aesthetic and functional impairments that may be accompanied by a low tongue position that predispose to oral breathing and apnoea, crowding in the upper and lower jaws, crossbites, a deep palatal vault and midfacial deficiency. Maxillary constriction may restrict mandibular transverse and sagittal growth and cause a class II malocclusion (Bishara and Staley, 1987, Portelli et al., 2012, Martina et al., 2012, Adkins et al., 1990).
The etiological factors that are responsible may be genetic and environmental. In 1972 Harvold concluded that a reduction in the maxillary diameter of the jaw is generally due to parafunctions (Harvold et al., 1972).
In order to facilitate the normal function, the correct tongue positioning and the physiological growth pattern, the treatment of a narrow maxilla should be performed as soon as possible. (Clark, 2005).
Early treatment approaches have been suggested for the correction of maxillary hypoplasia (McNamara and Brudon, 1993).
Among them, rapid palatal expansion has shown orthopaedic effects on the maxilla involving skeletal structures rather than the movement of the teeth through the alveolar bone (Maspero et al., 2016, Manuelli et al., 2018, Farronato et al., 2007, Farronato et al., 2011).
McNamara and Brudon (1993) have observed that after maxillary expansions in class II malocclusions the mandible is pulled forward improving the sagittal dimension. The Authors have suggested that the teeth themselves act as an inside functional device that involves both the jaws (McNamara and Brudon, 1993).
TSME appliance was proposed in clinical practice in 2007 by Farronato et al. and it is designed to expand the maxilla in the transverse and sagittal dimensions (Farronato et al., 2007).
TSME is a fixed appliance designed to develop archform in patients with constricted dental arches both in transverse and in antero-posterior plane. The TSME consists of two bands cemented to the right and left first upper molars, a Hyrax-type transverse expansion screw, two 0.045-inch stainless steel wires extending to the palatal superficies of the incisors, and two Hyrax-type screws (8 mm) between the molar bands and the incisors. This appliance can be associated with extraoral devices.
The purpose of this study is to compare dental effects as assessed on dental stone casts taken at three observational times (before treatment, immediately after appliance removal and at six months follow-up), of rapid palatal expansion in growing patients treated with Hyrax expander (Fig. 1) and the TSME expander (Fig. 2).
Fig. 1.

Hyrax Palatal Expander cemented on the second deciduous molars.
Fig. 2.

TSME appliance before activation. Hyrax-type transverse expansion screw, two 0.045-inch stainless steel wires extending to the palatal superficies of the incisors, and two Hyrax-type screws (8 mm).
2. Materials and methods
2.1. Sample selection
Forty patients, 20 males and 20 females (mean age 9.2 ± 2.6 years) were included in this study. They all have been treated for maxillary hypoplasia with a HPE (group 1, 20 subjects, 10 female and 10 male) or with a TSME (group 2, 20 subjects, 10 female and 10 male) at the Orthodontic Department of the University of Milan between January 2018 and June 2018.
All patients were selected according to the inclusion and exclusion criteria described in (Table 1).
Table 1.
Inclusion and exclusion criteria.
| Inclusion criteria | Exclusion criteria |
|---|---|
| Caucasian ethnicity | Congenital and dental anomalies |
| No previous orthodontic treatment | Syndrome or cranio-facial anomaly |
| Dynamic phase of growth: mixed dentition in initial phase and skeletal age among the I and III stadium, according to the CVM method | Previous orthodontic treatment |
| Pre and post-treatment models study | Asymmetries of the face |
| Maxillary crossbite due to maxillary hypoplasia | Loss of two or more appointments |
Patients in group 1 had the Hyrax screw activated twice per day (quarter turn per activation) until the desired expansion was obtained. Then, the device has been left in the mouth as passive retention for 6 months.
Patients in group 2 had the transverse Hyrax screw activated as in group 1. When the desired transversal expansion was accomplished, sagittal screws were activated a quarter turn every 15 days, for 6–8 months. The device was then left in the mouth for further 4 months as passive retention.
2.2. Model analysis
Plaster models evaluated have been taken prior to appliance bonding (T0), immediately after its removal (T1) and after 6 months of retention (upper Schwartz appliance) (T2). T1 refers to a period of 6–7 months for group I and after 10–12 months for group II.
Blinded operators among the authors made the same direct measurements twice on plaster models, using a Vernier caliper, which has a precision of one tenth of a millimeter.
The following measurements have been considered:
-
•
Inter-molar distance: The inter-molar distance is the distance between the mesio-palatal tip of the cusps of the first upper molars (Fig. 3) (Fig. 3)
-
•
Distance between first deciduous molars or premolars The distance E-E is the distance between the palatal cusps of the second deciduous molars of the upper arch (Fig. 4).
-
•
Inter-canine distance: It is the distance between the cusps of the canines of the upper arch (Fig. 5).
-
•
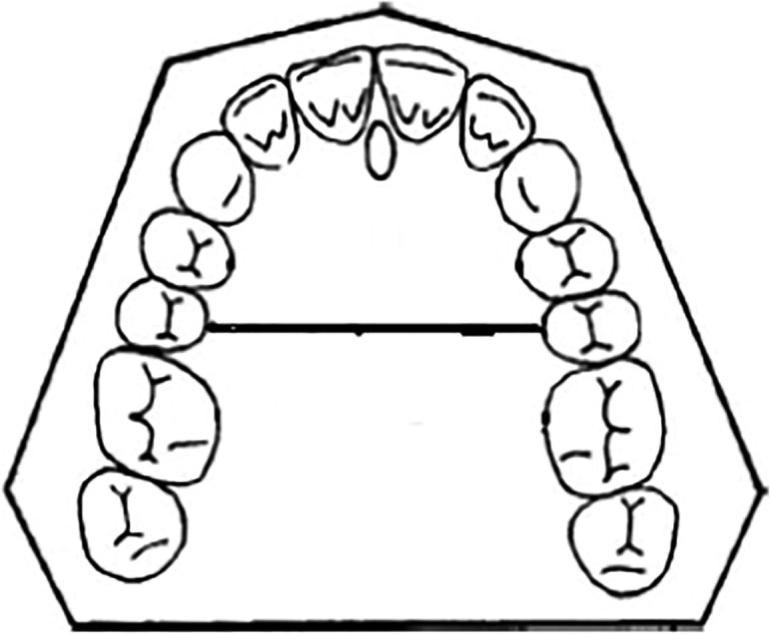
Palatal depth: It is the distance between the central and deepest part of the palate and the line connecting the distal-lingual cusps of the first upper right and left molars (Fig. 6).
-
•
Palatal length: It is the length of a virtual perpendicular line constructed from the mesial contact point of the upper incisors to a second virtual line that goes from the point of contact between the second premolars and the first upper molars (Fig. 7).
-
•
Arch perimeter length: It has been determined by measuring the length of the two lines connecting the contact points between the upper central incisors and the contact point between the second premolars and the first upper molars (Fig. 8).
Fig. 3.

Inter-molar distance. Distance between the mesio-palatal cusps of the first upper molars.
Fig. 4.
Distance between second deciduous molars. Distance between the palatal cusps of the second deciduous molars of the upper arch.
Fig. 5.
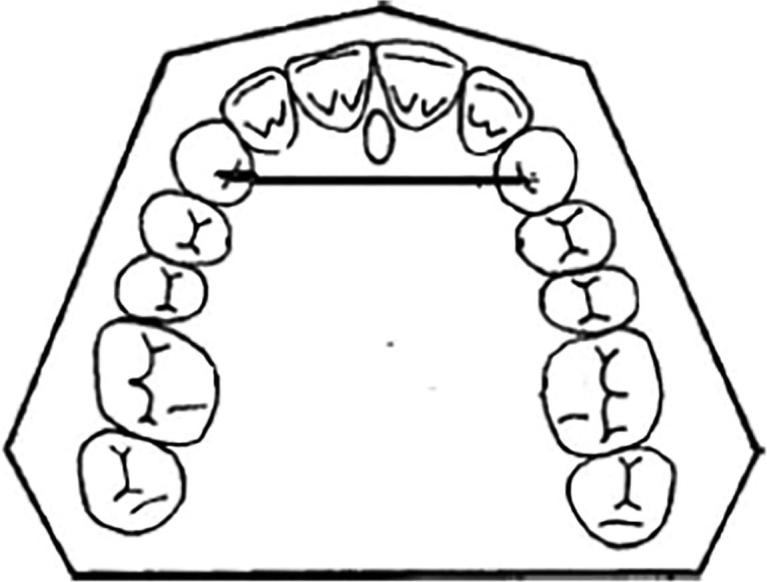
Inter-canine distance. Distance between the cusps of the canines of the upper arch.
Fig. 6.

Palatal depth. Distance between the central and deepest part of the palate and the line connecting the distal-lingual cusps of the first upper right and left molars.
Fig. 7.

Palatal length. The length of a virtual perpendicular line constructed from the mesial contact point of the upper incisors to a second virtual line that goes from the point of contact between the second premolars and the first upper molars.
Fig. 8.

Arch perimeter length. It has been determined by measuring the length of the two lines connecting the contact points between the upper central incisors and the contact point between the second premolars and the first upper molars.
2.3. Statistical analysis
Statistical analysis for the collected data was performed using SPSS software for Windows (version 23.0; SPSS, Chicago, IL). Data were analyzed by group and by treatment timing using descriptive statistics (mean, standard deviation, median, first and third quartile). Shapiro-Wilk test was used to check whether data were normally distributed. The mean changes of variables at different times, pre-treatment (T0), at appliance removal (T1) and 6 months post-retention (T2), were determined by repeated measure ANOVA or Friedman one-way repeated measure analysis of variance by ranks depending on Shapiro outcomes (respectively for normally distributed data and non non-normally distributed data). Pairwise comparisons were performed using the respective post-hoc tests: multiple paired t-tests with Bonferroni correction for repeated measure ANOVAs and multiple Wilcoxon signed-ranks for Friedman’s tests (Table 2).
Table 2.
Descriptive statistics of the analysis performed in group 1 and group 2 about all the measurements considered in the present study.
| Table 2 | Group-Time | Mean ± SD | Median(interquartile range) | F value/χ2 | rmANOVA/Friedman test (p value) | Pairwise comparisons | |
|---|---|---|---|---|---|---|---|
| G1_T0+ | 38.1 ± 2.2 | 37.5 (36.8; 40.0) | |||||
| InterMolar | G1_T1+ | 43.1 ± 2.7 | 41.5 (41.0; 45.0) | 99.41 | <0.001§ | T0 < T1 > T2; T0 < T2 | |
| G1_T2+ | 41.7 ± 2.3 | 41.5 (40.0; 43.0) | |||||
| G1_T0+ | 35.9 ± 2.8 | 36.0 (34.0; 36.8) | |||||
| EE | G1_T1+ | 41.9 ± 3.3 | 41.0 (40.0; 43.0) | 235.22 | <0.001§ | T0 < T1 > T2; T0 < T2 | |
| G1_T2+ | 41.2 ± 3.2 | 41.0 (39.3; 42.8) | |||||
| G1_T0+ | 33.6 ± 3.9 | 33.5 (30.0 35.8) | |||||
| InterCanine | G1_T1+ | 39.3 ± 3.9 | 38.3 (36.0; 41.8) | 486.32 | <0.001§ | T0 < T1 > T2; T0 < T2 | |
| G1_T2+ | 38.6 ± 3.6 | 38.0 (35.4; 40.8) | |||||
| G1_T0+ | 34.1 ± 2.5 | 34.0 (32.8; 36.0) | |||||
| PalatalDepth | G1_T1+ | 31.8 ± 2.9 | 32.0 (29.5; 34.0) | 84.84 | <0.001§ | T0 < T1; T0 < T2 | |
| G1_T2+ | 31.6 ± 3.0 | 31.5 (28.8; 34.0) | |||||
| G1_T0* | 70.4 ± 5.1 | 70.0 (66.9; 72.3) | |||||
| ArchPerimeter | G1_T1* | 74.4 ± 5.1 | 74.0 (70.8; 75.3) | 26.08 | <0.001§ | T0 < T1 > T2; T0 < T2 | |
| G1_T2* | 73.8 ± 4.9 | 73.0 (70.0; 75.3) | |||||
| G1_T0* | 29.5 ± 3.2 | 29.0 (26.8; 33.0) | |||||
| PalatalLenght | G1_T1+ | 30.8 ± 3.4 | 30.5 (27.8; 34.3) | 19.15 | <0.001§ | T0 < T1 > T2; T0 < T2 | |
| G1_T2+ | 30.3 ± 3.3 | 30.0 (27.0; 34.0) | |||||
| G2_T0* | 36.6 ± 4.8 | 37.5 (35.8; 40.3) | |||||
| InterMolar | G2_T1* | 41.6 ± 4.8 | 42.0 (40.0; 46.0) | 26.23 | <0.001§ | T0 < T1 > T2; T0 < T2 | |
| G2_T2* | 40.9 ± 5.1 | 41.3 (40.0; 45.0) | |||||
| G2_T0* | 35.9 ± 5.0 | 36.0 (34.8; 39.5) | |||||
| EE | G2_T1* | 41.7 ± 5.0 | 42.0 (40.5; 45.3) | 27.52 | <0.001§ | T0 < T1 > T2; T0 < T2 | |
| G2_T2* | 40.8 ± 5.1 | 41.8 (39.5; 44.3) | |||||
| G2_T0* | 34.9 ± 5.0 | 35.0 (33.8; 38.5) | |||||
| InterCanine | G2_T1* | 40.6 ± 5.5 | 41.0 (39.8; 44.5) | 26.75 | <0.001§ | T0 < T1 > T2; T0 < T2 | |
| G2_T2* | 39.8 ± 5.3 | 41.0 (38.8; 43.5) | |||||
| G2_T0* | 34.9 ± 4.3 | 36.5 (30.8; 38.5) | |||||
| PalatalDepth | G2_T1* | 32.7 ± 4.7 | 34.5 (27.0; 36.5) | 26.17 | <0.001§ | T0 < T1; T0 < T2 | |
| G2_T2* | 32.6 ± 4.7 | 35.0 (27.0; 36.5) | |||||
| G2_T0+ | 70.4 ± 6.5 | 70.0 (68.0; 73.5) | |||||
| ArchPerimeter | G2_T1+ | 77.4 ± 6.4 | 77.5 (75.0; 80.3) | 584.60 | <0.001 | T0 < T1 > T2; T0 < T2 | |
| G2_T2+ | 76.7 ± 6.5 | 77.5 (73.8; 80.0) | |||||
| G2_T0* | 29.9 ± 3.8 | 28.0 (27.0; 32.3) | |||||
| PalatalLenght | G2_T1* | 34.1 ± 3.7 | 32.5 (31.8; 36.0) | 26.46 | <0.001§ | T0 < T1 > T2; T0 < T2 | |
| G2_T2* | 33.4 ± 3.6 | 32.0 (30.8; 35.3) | |||||
Normally distributed, rm ANOVA Fvalue, p value and group relation based on pairwise comparisons are reported.
Non-normally distributed, Friedman’s test χ2, p value and group relation based on pairwise comparisons are reported.
Greenhouse-Geisser correction of p value is reported because sphericity is not met.
Differences between groups data were assessed as difference between T1-T0, to evaluate variable changes at appliance removal, difference between T2-T0, to assess residual change after 6 months retention period, and between T1-T2, to assess relapse after removal of the expander during the retention period. Shapiro-Wilk test was used to check the normality of transformed measurements which showed both non-normal distribution and normal distributions.
The mean differences between the two groups were compared by Mann-Whitney U test as no couple of measurements showed both a normal distribution. A p-value of ≤ 0.05 was assigned as statistically significant for all test results (Table 3).
Table 3.
Mean differences between the two groups of patients.
| Table 3 | Group-time | Mean ± SD | Median (inter-quartile range) | Mean rank | Group-time | Mean ± SD | Median (inter-quartile range) | Mean rank | Mann-Whitney U | P-value§ |
|---|---|---|---|---|---|---|---|---|---|---|
| Inter Molar distance | G1_T1-T0* | 5.0 ± 1.8 | 4.8 (4.0; 5.0) | 13.0 | G2_T1-T0* | 4.9 ± 0.7 | 5.0 (4.0; 5.3) | 16.0 | 77.0 | 0.300 |
| G1_T2-T0* | 3.6 ± 0.8 | 4.0 (3.0; 4.0) | 11.2 | G2_T2-T0* | 4.3 ± 0.7 | 4.0 (4.0; 5.0) | 17.8 | 51.5 | 0.022 | |
| G1_T2-T1* | −1.4 ± 1.4 | −1.0 (−1.1; −1.0) | 11.4 | G2_T2-T1* | −0.7 ± 0.6 | −1.0 (−1.0; 0.0) | 17.6 | 55.0 | 0.024 | |
| G1_T1-T0* | 6.0 ± 1.3 | 6.0 (5.8; 6.0) | 14.8 | G2_T1-T0* | 5.9 ± 0.4 | 6.0 (6.0; 6.0) | 14.2 | 94.0 | 0.809 | |
| E-E distance | G1_T2-T0* | 5.4 ± 1.3 | 5.0 (4.4; 5.6) | 15.7 | G2_T2-T0* | 4.9 ± 0.5 | 5.0 (4.9; 5.0) | 13.3 | 81.5 | 0.422 |
| G1_T2-T1* | −0.7 ± 0.6 | −1.0 (−1.0; −0.4) | 10.0 | G2_T2-T1* | −0.9 ± 0.3 | −1.0 (−1.0; −1.0) | 13.0 | 77.5 | 0.255 | |
| Inter Canine distance | G1_T1-T0* | 5.7 ± 0.9 | 6.0 (5.8; 6.0) | 14.5 | G2_T1-T0* | 5.8 ± 0.8 | 6.0 (6.0; 6.0) | 14.5 | 98.0 | 1 |
| G1_T2-T0* | 5.1 ± 0.9 | 5.0 (5.0; 5.6) | 15.6 | G2_T2-T0* | 5.0 ± 0.7 | 5.0 (5.0; 5.0) | 13.4 | 82.0 | 0.374 | |
| G1_T2-T1* | −0.6 ± 0.4 | −0.8 (−1.0; −0.4) | 16.3 | G2_T2-T1* | −0.8 ± 0.5 | −1.0 (−1.0; −0.8) | 12.7 | 72.5 | 0.180 | |
| G1_T1-T0+ | −2.3 ± 0.9 | −2.0 (−3.0; −1.75) | 13.5 | G2_T1-T0* | −2.2 ± 1.3 | −2.0 (−2.3; −1.8) | 15.5 | 83.5 | 0.476 | |
| Palatal Depth | G1_T2-T0+ | −2.5 ± 0.9 | −2.5 (−3.0; −2.0) | 12.9 | G2_T2-T0* | −2.3 ± 1.2 | −2.0 (−2.3; −2.0) | 16.1 | 75.5 | 0.264 |
| G1_T2-T1* | −0.2 ± 0.4 | 0.0 (0.3; 0.0) | 13.6 | G2_T2-T1* | −0.1 ± 0.5 | 0.0 (0.0; 0.0) | 15.4 | 85.5 | 0.421 | |
| G1_T1-T0* | 4.0 ± 1.0 | 4.0 (3.0; 4.3) | 7.8 | G2_T1-T0* | 7.0 ± 1.0 | 7.0 (6.8; 7.3) | 21.2 | 4.0 | <0.001 | |
| Arch Perimeter | G1_T2-T0* | 3.4 ± 0.8 | 3.0 (3.0; 4.0) | 7.6 | G2_T2-T0* | 6.3 ± 0.9 | 6.0 (6.0; 7.0) | 21.4 | 2.0 | <0.001 |
| G1_T2-T1* | −0.6 ± 0.7 | −0.8 (−1.0; 0.0) | 15.0 | G2_T2-T1+ | −0.7 ± 0.6 | −1.0 (−1.0; 0.0) | 14.0 | 91.5 | 0.769 | |
| G1_T1-T0* | 1.3 ± 1.0 | 1.0 (0.8; 2.0) | 7.9 | G2_T1-T0* | 4.1 ± 1.0 | 4.0 (3.8; 5.0) | 21.1 | 5.5 | <0.001 | |
| Palatal Lenght | G1_T2-T0* | 0.8 ± 0.7 | 1.0 (0.0; 1.0) | 7.7 | G2_T2-T0* | 3.4 ± 0.9 | 4.0 (2.8; 4.0) | 21.3 | 3.0 | <0.001 |
| G1_T2-T1+ | −0.5 ± 0.5 | −0.5 (−1.0; 0.0) | 16.0 | G2_T2-T1* | −0.7 ± 0.5 | −1.0 (−1.0; 0.0) | 13.0 | 77.0 | 0.352 | |
Normal distribution.
Non-normal distribution.
Statistically significant at 5% level of significance.
3. Results
Both the Friedman test and the rm-ANOVA test (Table 2) and their respective post-hoc show that within both groups the respective variables have a statistically significant increase between T0 and T1 (p < 0,05) and a slight decrease between T1 and T2 (p < 0,05) that is not clinically relevant remaining always T2 greater than T0 in a statistically and clinically relevant way (p < 0,05). The palatal depth variable is an exception in both groups as it does not decrease between T1 and T2. In fact palatal depth show a clinically and not statistically significant progressive increase (p > 0,05).
The analysis between the differences of the measurements at different timing measured by the Mann-Whitney test (Table 3) shows that for all the variables there is no statistically significant difference between the 2 devices (p < 0,05), except for the perimeter of the arch and the length of the palate; in this case it appeared that the TSME is better statistically (p < 0,05).
4. Discussion
4.1. General considerations
Maxillary expansion with HPE is often the treatment of choice in growing subjects with maxillary hypoplasia and posterior crossbite.
As maxillary hypoplasia is a three dimensional issue and it is often desirable to obtain as much sagittal arch development as possible, we evaluated arch effects of an appliance designed to be activated even in the sagittal dimension (TSME) and those produced by HPE.
4.2. Effects of the appliances over time
As it is reported in Table 2, all the parameters evaluated showed a statistically significant increase after the use of both appliances from T0 and T1 and T0 and T1.
Dentoalveolar transversal effects. The values in both groups show a statistically significant increase of all distances analyzed between T0 and T1 and T0 and T2(inter molar distance, E-E distance, inter canine distance). A slight decrease in all distances was found between T2 and T1 that was always below 2 mm. This event is quite investigated in orthodontic literature and it was explained as mainly due to a reduction in oro-vestibular tip of posterior elements of the dental arches.
Palatal depth. The values in both groups show a statistically significant increase of the distances analyzed between T0 and T1 and between T0 and T2. No statistically significant difference was found between measurements taken at T0 and T1. This result seems to indicate that the orthopedic effects over size and shape of palatine vault are stable.
Arch perimeter, palatal length the values of both variables in both groups show a trend that reflects the one of the variables that describe dentoalveolar transversal effects over time of the appliances probably due to similar reasons.
4.3. Comparison between the appliances of the effects at each observational time
Dentoalveolar transversal effects. In this study, the analysis of the models has shown that rapid palatal expansion has increased the transversal diameters in a similar way in the two groups of patients between T0 and T1, between T1 and T2, between T0 and T2.
The analysis of the inter molar distance has revealed that, after expansion, group 2 shows slightly higher values than group 1 in transversal expansion at T2 compared to baseline (T2-T0) and in the amount of transversal expansion lost due to relapse (T2-T1). The difference however is very small (mean values difference is 0.4 mm). Considering the limitations of this study we cannot be certain about the reason of this difference but, however, by taking into consideration all the other values of dentoalveolar transversal effects, that show no statistical differences between the two appliances, we can suppose that this difference could be partly due to difference in passive retention period after the last activation of the transverse Hyrax screw (in group 1 6 months and in group 2 6–8 months while activations of sagittal screws were performed and 3–4 months of passive retention of TSME). No differences were found in the values of E-E distance. The relapse of inter canine distance (T2-T1) has better results in group 1 than group 2 but besides non being statistically significant it cannot be considered clinically significant as the difference between the means is low (0,2 mm).
Palatal depth. Nor statistically significant nor clinically significant difference between the two appliances emerged regarding palatal depth. TSME appears to show a similar performance in this effect compared to the gold standard HPE. This result makes the Authors confident in stating that, at least regarding measurements on dental casts, palatal expansion can be performed obtaining similar results with both appliances.
The analysis of the depth of the palate has revealed that, after expansion, the values reached by group 1 and group 2 are almost similar, showing therefore a good capacity in decreasing the palatal depth.
Arch perimeter, palatal length. The most relevant differences found regard the parameters of the arch perimeter and palatal length.
Arch perimeter showed clinical and statistical significant higher increase in group 2 both between T0 and T1 (difference between means 3.0 mm) and between T0 and T2 (difference between means 2.6 mm). It could therefore be useful when there is the need of increasing the perimeter of the upper dental arch. Both groups showed a similar relapse between T1 and T2 with no statistically significant difference between the appliances. Both devices seem to be able to maintain a suitable length after 6 months from the removal of the device.
Similar conclusions can be drawn by analyzing palatal length. Between T0 and T1 difference between means was 2.7 mm, between T0 and T2 difference between means was 3.2 mm. Difference in relapse between two appliances was not statistically significant
These results are in agreement with the studies performed by Algharbi et al., 2018, Da Silva Filho et al., 1991, Farronato et al., 2007), Farronato et al., 2011, Farronato et al., 2012, Maspero et al., 2015, Proffit et al., 2018, Timms, 1976.
This study seems to suggest that TSME could be recommended in treatment of those cases of maxillary hypoplasia that would benefit from an increase in arch perimeter and in sagittal arch dimension.
Data obtained from previous studies Farronato et al., 2007, Maspero et al., 2015 show that the clinical use of TSME does not involve a statistically increase of skeletal vertical dimensions; so it is not contraindicated in the malocclusions characterized by a tendency to the skeletal openbite.
5. Conclusions
The study has shown that RPE and TSME can achieve similar results in transversal palatal expansion while differences have been found in the palatal length and in the arch perimeter where TSME seems to be more efficient due to its specific construction shape.
Moreover both RPE and TSME devices can maintain a proper perimetral maxillary arch after 6 months from the removal of the device.
Ethical approval
The present study was approved by a research project of Fondazione IRCCS Cà Granda Ospedale Maggiore Policlinico (n. 3 OU 420/425- current research year 2018) on plaster models. The ethic committee of the Fondazione IRCCS Cà Granda Ospedale Maggiore Policlinico answered that the approval was unnecessary because the research was done only on the casts and not on humans.
Declaration of Competing Interest
The Authors declare they do not have conflict of interest.
Footnotes
Peer review under responsibility of King Saud University.
References
- Adkins M.D., Nanda R.S., Currier G.F. Arch perimeter changes on rapid palatal expansion. Am. J. Orthod. Dentofacial Orthop. 1990;97:194–199. doi: 10.1016/S0889-5406(05)80051-4. [DOI] [PubMed] [Google Scholar]
- Algharbi M., Bazargani F., Dimberg L. Do different maxillary expansion appliances influence the outcomes of the treatment? Eur. J. Orthod. 2018;40(1):97–106. doi: 10.1093/ejo/cjx035. Jan 23. [DOI] [PubMed] [Google Scholar]
- Bishara S.E., Staley R.N. Maxillary expansion: clinical implications. Am. J. Orthod. Dentofacial Orthop. 1987;91:3–14. doi: 10.1016/0889-5406(87)90202-2. [DOI] [PubMed] [Google Scholar]
- Clark W.J. Transforce lingual appliances for arch development. J. Clin. Orthod. 2005;39:137–142. [PubMed] [Google Scholar]
- Da Silva Filho O.G., Boas M.C., Capelozza L.Filho. Rapid maxillary expansion in the primary and mixed dentitions: a cephalometric evaluation. Am. J. Orthod. Dentofacial Orthop. 1991;100:171–179. doi: 10.1016/s0889-5406(05)81524-0. [DOI] [PubMed] [Google Scholar]
- Farronato G., Cordasco G., Farronato D., Esposito L., Briguglio E. The transverse sagittal maxillary expander. J. Clin. Orthod. 2007;41:387–389. [PubMed] [Google Scholar]
- Farronato G., Giannini L., Galbiati G., Maspero C. Sagittal and vertical effects of rapid maxillary expansion in Class I, II, and III occlusions. Angle Orthod. 2011;81:298–303. doi: 10.2319/050410-241.1. [DOI] [PMC free article] [PubMed] [Google Scholar]
- Farronato G., Giannini L., Galbiati G., Maspero C. Comparison of the dental and skeletal effects of two different rapid palatal expansion appliances for the correction of the maxillary asymmetric transverse discrepancies. Minerva Stomatol. 2012;61:45–55. [PubMed] [Google Scholar]
- Harvold E.P., Chierici G., Vargervik K. Experiments on the development of dental malocclusions. Am. J. Orthod. 1972;61:38–44. doi: 10.1016/0002-9416(72)90174-1. [DOI] [PubMed] [Google Scholar]
- McNamara J.A., Brudon W.L. Needham Press; Ann Arbor: 1993. Orthodontic and orthopedic treatment in the mixed dentition. [Google Scholar]
- Manuelli M., Huanca L.G., Farronato M., Martintoni A., Marcolina M., Lucchese A. Comparison of linear transverse measures between plaster and resin printed digital models. J. Biolog. Regulat. Homeostatic Agents. 2018;32:81–85. (2 Suppl. 2) [PubMed] [Google Scholar]
- Martina R., Cioffi I., Farella M., Leone P., Manzo P., Matarese G., Portelli M., Nucera R., Cordasco G. Transverse changes determined by rapid and slow maxillary expansion – a low dose CT- based randomized controlled trial. Orthod. Craniofac. Res. 2012;15:159–168. doi: 10.1111/j.1601-6343.2012.01543.x. [DOI] [PubMed] [Google Scholar]
- Maspero C., Galbiati G., Giannini L., Farronato G. Sagittal and vertical effects of transverse sagittal maxillary expander (TSME) in three different malocclusion groups. Prog. Orthod. 2015 Apr;25(16):6. doi: 10.1186/s40510-015-0075-z. [DOI] [PMC free article] [PubMed] [Google Scholar]
- Maspero C., Giannini L., Galbiati G., Feresini M., Farronato G. Effect of rapid palatal expansion in early tratment and spontaneous correction of maxillary canine-first premolar transposition. Minerva Stomatol. 2016;65(3):134–143. [PubMed] [Google Scholar]
- Portelli M., Matarese G., Militi A., Cordasco G., Lucchese A. A proportional correlation index for space analysis in mixed dentition derived from an Italian population sample. Eur. J. Paed. Dent. 2012;13:113–117. [PubMed] [Google Scholar]
- Proffit W.R., Fields H.W., Larson B., Sarver D.M. Elsevier Health Sciences; 2018. Contemporary orthodontics. [Google Scholar]
- Timms D.J. Long term follow-up of cases treated by rapid maxillary expansion. Trans. European Orthodontic. Soc. 1976:211–215. [Google Scholar]