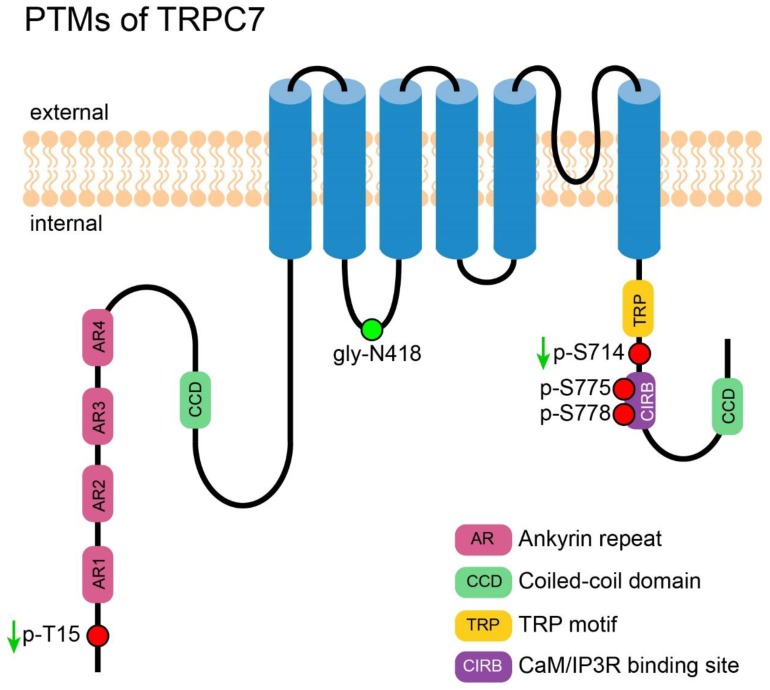
Figure 6.
PTMs of TRPC7. A cartoon depicting TRPC7 with its important motifs and PTMs (those exact positions had been reported). PTMs are presented in circles. Red circles represent the reported phosphorylation sites of TRPC7, which are labeled in the format of a “p-amino acid-position”. The green circle represents the reported N-glycosylation site, which is labeled in the format of a “gly-amino acid-position”. The green arrows near the labels denote the PTMs decrease the channel’s activity.

