Figure 8.
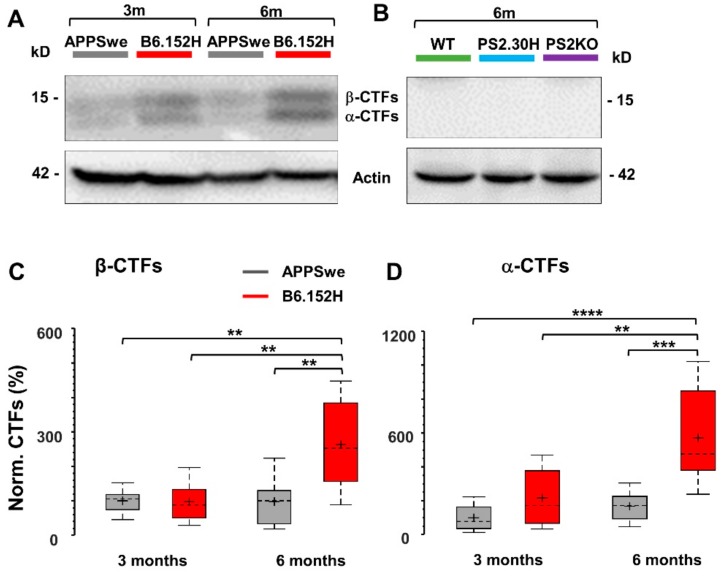
Expression levels of APP-CTFs. Right cortices obtained from three- and six-month-old WT and tg mice were assayed with SDS-PAGE and WB, as described in Supplementary Materials. Representative WB of APP-CTFs, assayed with an anti-APP-CTF (CT695), from APPSwe and B6.152H (A) and WT, PS2.30H and PS2KO (B) mice. In panel B, even at higher exposure, the CTFs were below threshold. Boxplots of α-(C) and β-(D) CTFs (n = 15 samples from six mice per age and genotype); note the different scales in panels C and D. Values were normalized to actin and expressed as the percentage of the average value measured in three-month-old APPSwe mice (non-parametric Kruskal-Wallis test with the Dunn-Sydak correction for multiple comparisons, **** p < 0.0001, *** p < 0.001, ** p < 0.01).

