Abstract
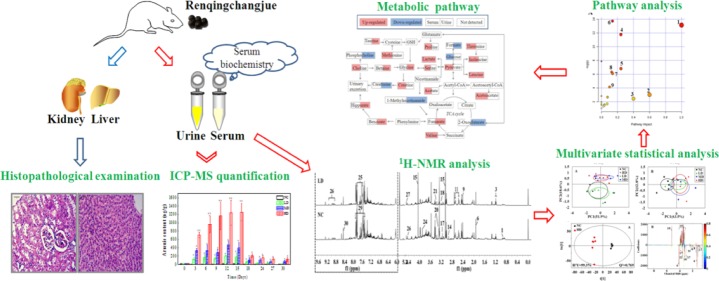
Renqingchangjue (RQCJ), a kind of Traditional Tibetan Medicine, has been widely utilized to treat various gastroenteritis diseases. However, the biosafety and toxicity of RQCJ was still indefinite because of toxic components in RQCJ, which included a variety of heavy metals. Thus, this study was aimed to evaluate the toxicity and expound the toxicological mechanism of RQCJ. In this study, rats were intragastrically administered with different doses of RQCJ for 15 days, and then, the restorative observation period lasted for 15 days. Liver and kidney tissues were collected for histopathological examination, and simultaneously serum and urine samples were collected for 1H nuclear magnetic resonance (1H NMR) spectroscopy analysis and biochemical analysis combined with inductively coupled plasma mass spectrometry (ICP-MS) measurement. The 1H NMR-based metabolomics analysis revealed that the administration of RQCJ significantly altered the concentrations of 14 serum metabolites and 14 urine metabolites, which implied disturbances in energy metabolism, amino acid metabolism, intestinal flora environment, and membrane damage. Besides, the biochemical analysis of serum samples was consistent with the histopathological results, which indicated slight hepatotoxicity and nephrotoxicity. The quantification of As and Hg in urine and serum samples by ICP-MS provided more evidence about the toxicity of RQCJ. This work provided an effective method to systematically and dynamically evaluate the toxicity of RQCJ and suggested that precautions should be taken in the clinic to monitor the potential toxicity of RQCJ.
Introduction
Renqingchangjue (RQCJ), a kind of empirical Tibetan prescription, is a pill composed by hundreds of precious components such as pearl, cinnabar, sandalwood, agrwood, medlar, bezoar, artificial musk, saffron, and so on.1 Up to now, RQCJ has been utilized to treat chronic gastroenteritis, atrophic gastritis, and gastric ulcer.2 However, similar to some other ethnomedicines, Tibetan medicine also faces severe challenges, for example, the wide use of heavy metals as pharmaceutical components and toxic element.3 As one of essential components of RQCJ, Tsothel (Zuotai) is a notable metal-containing Traditional Tibetan Medicine.4 It is regarded as the “king of essence” in Tibetan medicine because it has been considered an important therapeutic ingredient for more than 1000 years.1 Tsothel contains 54% mercuric sulphide (HgS) and is also rich in arsenic (As), plumbum (Pb), copper (Cu), cadmium (Cd), and so forth.5,6 It has been reported that tsothel includes a high content of heavy metals such as Hg and As.7 Therefore, it is of great significance to investigate the safety of RQCJ and clarify its potential mechanisms to assuage public concerns.
Metabolomics, based on the qualitative and quantitative analysis of small molecule metabolites in biofluids or tissues, is an indispensable approach to monitor the biochemical changes influenced by endogenous and exogenous factors such as drug interventions and disease invasions.8,9 As a kind of systemic approach, metabolomics has demonstrated great potential in many fields such as toxicology research,8,10,11 disease diagnosis,12,13 and mechanism research.14,151H nuclear magnetic resonance (1H NMR) has proved to be one of the widely analytical techniques in metabonomics research due to its characteristics such as nondestruction, high throughput (5–8 min, possibly),16 minimum sample preparation, and good reproducibility.16−18 The NMR-based metabolomics approach has been widely applied to reveal biochemical changes and disturbed pathways in body fluids such as serum and urine.19,20 As is reported, serum contains various endogenous small-molecule metabolites which could reflect the comprehensive metabolic changes in different levels of human bodies.21 Simultaneously urine also plays an irreplaceable role in toxicology research and biomarker screening, as it contains less protein and lipid and can be accessible with noninvasive approach.19 Thus, in this research, NMR-based serum and urine metabolomics were applied to evaluate the toxicity of RQCJ. In addition, the inductively coupled plasma mass spectrometry (ICP-MS), which has been proved to be a kind of rapid, simple, accurate, and reliable method,22−24 was performed to identify and quantify the content of heavy metals in serum and urine.
In this study, the 1H NMR-based metabolomics approach was utilized to identify potential biomarkers and reveal a series of metabolic pathway perturbations in serum and urine from RQCJ-administered rats. Finally, above results complemented with biochemical and histopathological examinations and ICP-MS were used to expound the toxicological effects of RQCJ. It may improve our cognition of potential toxicity of RQCJ and be beneficial to its safety evaluation and rational application.
Results
Body Weight Profiling
During the whole experiment, there were no evident abnormalities in food intake of rats in neither the normal control (NC) group nor the RQCJ dose groups. The body weights of rats are recorded in Figure S1. There was no significant difference in body weight among the four groups at an early stage of RQCJ administration. However, on the 10th day, compared with the NC group, there was a slower weight growth in RQCJ groups, which was slowest on the 15th day. From the 18th to 30th day, there was a steady weight growing in all groups, while the body weight in RQCJ group rats decreased with the increase of administrated dose.
Clinical Biochemistry Parameters
Clinical biochemical results of aspartate aminotransferase (AST), alanine aminotransferase (ALT), blood urea nitrogen (BUN), and alkaline phosphatase (ALP) are displayed in Figure 1 and Table S1. Compared with the NC group, levels of AST in MD and HD groups were increased, and ALT was slightly elevated, which indicated a mild liver injury induced by RQCJ. Simultaneously, decreased levels of BUN were found in the RQCJ administered groups, suggesting the disorder of renal function. The ALP levels showed a slight decrease between the RQCJ groups and NC group. All of the above differences were gradually moderate after 15 days of recovery.
Figure 1.
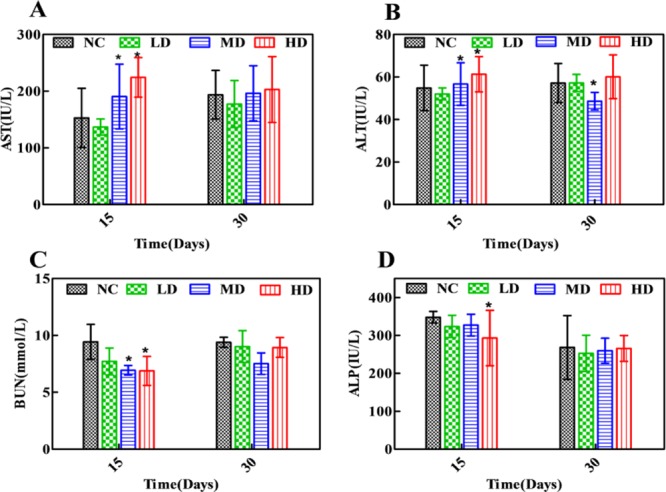
Distribution of AST (A), ALT (B), BUN (C), and ALP (D) in serum of rats. *p < 0.05 vs NC group. NC: normal control group, LD: low-dose group, MD: middle-dose group, HD: high-dose group.
Histopathology
Histopathological examination of liver and kidney tissues is showed in Figure 2. There were no apparent histological changes in the NC group on days 15 and day 30, whereas some morphological changes such as inflammatory cell infiltration, slight necrosis of hepatocytes, and mild renal tubular lesions were observed in RQCJ dosed groups on day 15. The occurred morphological changes in liver and kidney recovered on the 30th day.
Figure 2.
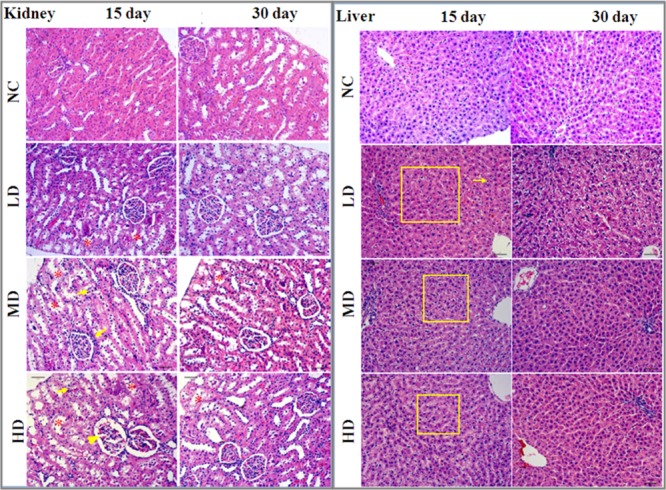
Histopathological examination of liver and kidney tissues of rats among the four groups by H&E staining (10×). Renal tubular lesions (*), inflammatory cell infiltration (↓), and necrosis of hepatocytes (□). NC: normal control group, LD: low-dose group, MD: middle-dose group, HD: high-dose group.
1H NMR Spectroscopic Analysis of Serum and Urine Samples
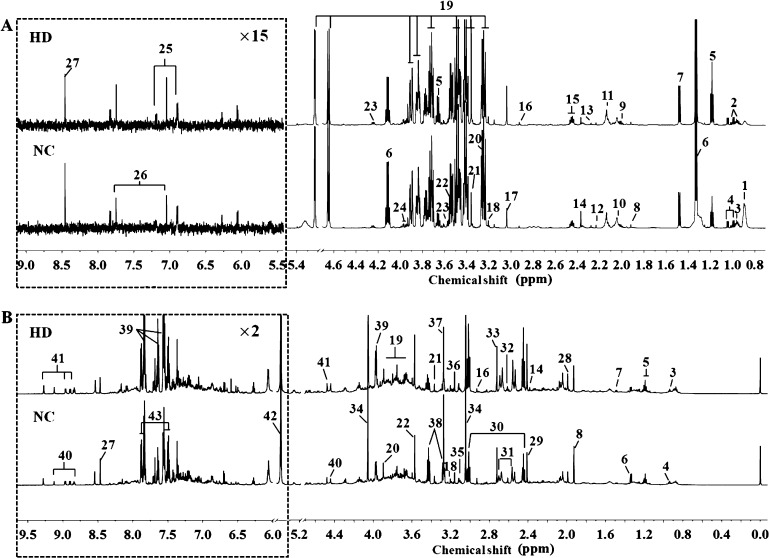
Representative 600 MHz 1H NMR spectra of serum and urine samples from NC and HD groups on 15th day are displayed in Figure 3. Metabolites were identified based on the reported literature studies,10,25−30 chenomx NMR Suite database (version 7.5, Chenomx, Canada) and the Human Metabolome Database database (HMDB, http://www.hmdb.ca/). The identified metabolites were further confirmed by two-dimensional spectra such as 1H–1H COSY (correlation spectroscopy), 1H–1H TOCSY (total correlation spectroscopy), and 1H–13C HSQC (heteronuclear single quantum correlation). Finally, a total of 27 metabolites in serum and 30 metabolites in urine were identified.
Figure 3.
Representative 600 MHz 1H NMR spectra of serum (A) and urine (B) samples obtained from NC and HD groups on 15th day. Metabolites: (1) LDL&VLDL; (2) isoleucine; (3) leucine; (4) valine; (5) ethanol; (6) lactate; (7) alanine; (8) acetate; (9) proline; (10) N-acetylglycoprotein; (11) methionine; (12) acetone; (13) acetoacetate; (14) pyruvate; (15) glutamine; (16) N,N-dimethylglycine; (17) creatine; (18) choline; (19) glucose; (20) betaine; (21) methanol; (22) glycine; (23) threonine; (24) serine; (25) tyrosine; (26) methylhistidine; (27) formate; (28) acetamide; (29) succinate; (30) 2-oxoglutarate; (31) citrate; (32) methylamine; (33) dimethylamine; (34) creatinine; (35) cis-aconitate; (36) malonate; (37) trimethylamine N-oxide (TMAO); (38) taurine; (39) hippurate; (40) trigonelline; (41) 1-methylnicotinamide; (42) allantoin; (43) benzoate. NC: normal control group, HD: high-dose group. (Dotted square) ×15 magnification in serum spectra and ×2 magnification in urine spectra.
Multivariate Statistical Analysis of Serum 1H NMR Data
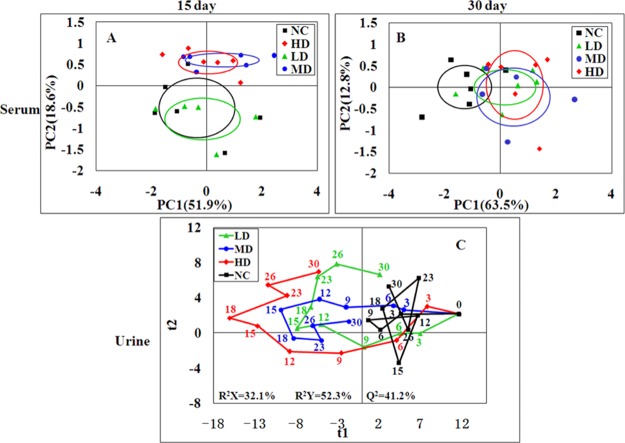
The serum 1H NMR data of the four groups were subjected into principal component analysis (PCA) to investigate the differences between all groups. LD group clusters was close to the NC group while the MD and HD groups were significantly separated from the controls in the score plots of 15th day (Figure 4A). After 15 days of recovery, all RQCJ group clusters were close to the control group, and the separation was less obvious (Figure 4B). Partial least squares discriminant analysis (PLS-DA) was performed to obtain better group separation, and there were same trends observed in PLS-DA score plots (Figure S2) on 15th day and 30th day, which indicate that the metabolic phenotype of the rats was disturbed by RQCJ.
Figure 4.
PCA score plot of serum (A,B) samples from the four groups at day 15 and day 30 and PLS-DA score trajectory plots of urine (C) samples from the four groups at days 0, 3, 6, 9, 12, 15, 18, 23, 26, and 30. Day 0: one day before treatment, days 3–15: the time points of administration, days 18–30: the time points of stop administration. In PLS-DA score trajectory plots, each point represented the mean position of a group (n = 12). NC: normal control group, LD: low-dose group, MD: middle-dose group, HD: high-dose group.
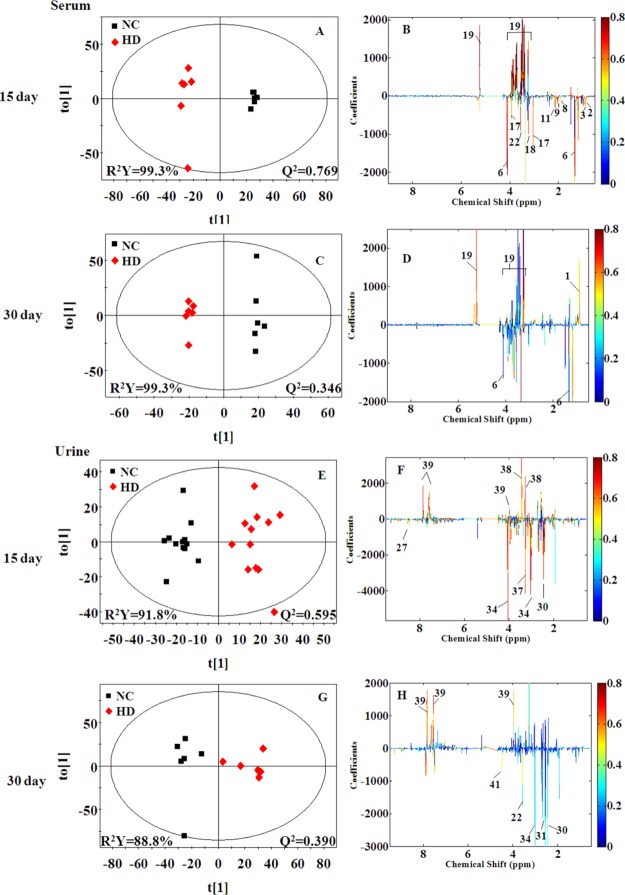
In order to reveal the differences in metabolites between two groups, orthogonal partial least squares discriminant analysis (OPLS-DA) models were further constructed. In the OPLS-DA score plots (Figures 5 and S3), all RQCJ groups were well separated from the NC group. The OPLS-DA color-coded coefficient plots (Figures 5 and S3) displayed the metabolites contributing to the group separation.
Figure 5.
OPLS-DA score plots (A,C,E, and G) and color-coded coefficient plots (B,D,F, and H) of serum (A–D) and urine (E–H) samples from the NC and HD groups on days 15 and day 30. Metabolite variation could be visualized by the color-coded coefficient plots. The alteration of metabolites between groups were identified according to the first principal component [t(1)]. The upper section of the coefficient plots indicated the increased metabolites of the group in the positive direction of [t(1)], and vice versa. NC: normal control group, HD: high-dose group.
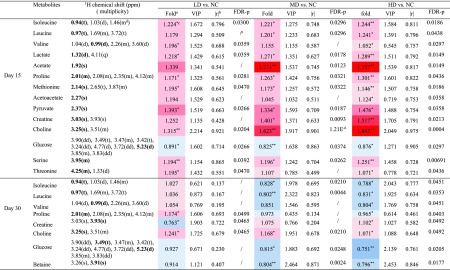
Compared with the NC group on the 15th days, increased levels (upper section of the coefficient plots) of isoleucine, leucine, valine, lactate, acetate, proline, methionine, acetoacetate, pyruvate, creatine, choline, serine, threonine, and decreased levels (lower section of the coefficient plots) of glucose were determined in serum samples of the HD group. On the 30th day, the amounts of altered metabolites in serum of HD group rats were reduced, including higher levels of creatine and choline and lower levels of isoleucine, leucine, valine, proline, glucose, and betaine. The results from statistical analysis of NC versus each RQCJ groups based on serum 1H NMR data are shown in Table 1.
Table 1. NMR Signals Assignments of Metabolites with Significant Changes in Serum on Days 15 and 30, with Their Fold Change Values, p Values, FDR p Values, VIP Values and Correlation Coefficient Values (r).
Fold
change values were colored
according to log 2(fold) using color bar:  red
and blue indicates increasing and decreasing concentration
of each group compared to NC.
The absolute of correlation coefficient |r| obtained from PLS-DA model, the cutoff of |r| was set to 0.707.
The p values were obtained from independent samples t-test. The chemical shifts in boldface are used in calculating the relevant integrals and p values (*p < 0.05, **p < 0.01).
Multiplicity: s-singlet; d-doublet; t-triplet; q-quartet; dd-doublet of doublets; m-multiplet.
The FDR p values were calculated from p values, the p values with no significant difference (P > 0.05) were not calculated and expressed by “/”.
Multivariate Statistical Analysis of Urine 1H NMR Data
In order to dynamically observe the changes in urine metabolism profile of rats, PCA was performed in urine 1H NMR data at days of 0, 3, 6, 9, 12, 15, 18, 23, 26, and 30. In the PCA score plots (Figure S4), the separation between RQCJ groups and the NC group were gradually obvious from day 1 to day 15. Then, from the 15th day, each dosed group cluster was close to the NC group and could not be easily distinguished from the NC group, especially on the 30th day. The dynamically metabolic changes among 30 days are displayed by the PLS-DA score trajectory plots (Figure 4C), where each point represented the mean position of a group. It could be seen that all RQCJ groups were markedly separated from the control group, especially the high dose group which was away from normal levels and started to recover on the 18th day. The general recoveries of other two RQCJ groups were found around the 15th day.
Based on OPLS-DA score plots, the altered metabolites in urine were further selected by using the coefficient plots (Figures 5 and S5). Compared with the NC group, in the HD group there were the increased levels of leucine, valine, lactate, taurine, glycine, betaine, hippurate, fumarate, and benzoate (upper section of the coefficient plots) and decreased levels of 2-oxoglutarate, phosphocholine, creatinine, 1-methylnicotinamide, and formate (lower section of the coefficient plots) in urine samples on the 15th day. After a 15 day recovery, in the HD group, there were still an increased level of hippurate and benzoate and decreased levels of leucine, succinate, citrate, malonate, and TMAO in urine. Based on urine 1H NMR data, the results from statistical analysis of NC versus RQCJ groups are shown in Table 2.
Table 2. NMR Signals Assignments of Metabolites with Significant Changes in Urine on days 15 and 30, with Their Fold Change Values, p Values, FDR p Values, VIP Values and Correlation Coefficient Values (r)a,b,c,d.
Fold
change values were colored
according to log 2(fold) using color bar:  red
and blue indicates increasing and decreasing concentration
of each group compared to NC.
The absolute of correlation coefficient |r| obtained from PLS-DA model, the cutoff of |r| was set to 0.707.
The p values were obtained from independent samples t-test. The chemical shifts in boldface are used in calculating the relevant integrals and p values (*p < 0.05, **p < 0.01).
Multiplicity: s-singlet; d-doublet; t-triplet; q-quartet; dd-doublet of doublets; m-multiplet.
The FDR p values were calculated from p values, the p values with no significant difference (P > 0.05) were not calculated and expressed by “/”.
Pathway Analysis
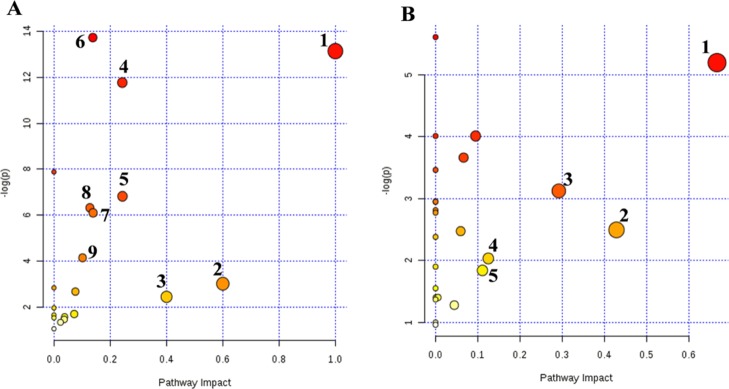
To investigate the relevant metabolic pathways disturbed by RQCJ, the selected potential biomarkers were analyzed by MetaboAnalyst 4.0. The details of all matched pathways are showed in Figure 6 and Tables S2 and S3. Among them, based on impact value >0.1, pathways were considered closely related to toxicity induced by RQCJ. Consequently, nine pathways including valine, leucine, and isoleucine biosynthesis, synthesis and degradation of ketone bodies, methane metabolism, glycine, serine, and threonine metabolism, pyruvate metabolism, aminoacyl-tRNA biosynthesis, cysteine and methionine metabolism, glycolysis or gluconeogenesis, and butanoate metabolism in serum samples were selected, and five pathways in urine samples including valine, leucine, and isoleucine biosynthesis, taurine and hypotaurine metabolism, glycine, serine, and threonine metabolism, nicotinate and nicotinamide metabolism, and glyoxylate and dicarboxylate metabolism were selected. Metscape is a plugin of Cytoscape for visualization and interpretation of metabolomics data.31 It allows users to track the connections between metabolites and genes, visualize compound networks, and display pathway information as well as reaction, enzyme, gene, and so forth.32 To reveal the biochemical relationship associated with these potential biomarkers, the compound networks analysis results are shown in Figures S6 and S7. The network also reflected complex biochemical relationships and provided evidence for the involvement of altered metabolism in serum and urine influenced by RQCJ.
Figure 6.
Metabolic pathway analysis of potential biomarkers in serum (A) and urine (B) serum: (1) valine, leucine and isoleucine biosynthesis; (2) synthesis and degradation of ketone bodies; (3) methane metabolism; (4) glycine, serine and threonine metabolism; (5) pyruvate metabolism; (6) aminoacyl-tRNA biosynthesis; (7) cysteine and methionine metabolism; (8) glycolysis or gluconeogenesis; (9) butanoate metabolism. Urine: (1) valine, leucine and isoleucine biosynthesis; (2) taurine and hypotaurine metabolism; (3) glycine, serine and threonine metabolism; (4) nicotinate and nicotinamide metabolism; (5) glyoxylate and dicarboxylate metabolism.
Quantification of As and Hg in Urine and Serum Samples by ICP-MS
The presence of heavy metal in RQCJ has raised public concerns. Even low metal concentrations may threaten the health of people.33 Therefore, it was necessary to determinate the heavy-metal contents in biofluid to evaluate the toxicological effects of RQCJ. There were significant dose-dependent changes of As and Hg in serum (Figure 7A,B) and urine (Figure 7C,D) in RQCJ groups. On the 15th day, the concentrations of As and Hg in serum (Figure 7 and Table S4) samples of RQCJ groups increased, especially in the HD group which was much higher than the NC group. After a 15 day recovery, reduced levels of Hg and a slightly decreasing of As were shown in serum samples of RQCJ groups. The dynamic changes of As and Hg content in rats’ urine are recorded by Figure 7C,D and Table S5. From day 0 to 15, the contents of As and Hg in urine of RQCJ groups raised gradually, which peaked the highest level on the 15th day. Compared with the NC group, the RQCJ groups showed reduced urinary levels of As and Hg from the 18th day.
Figure 7.
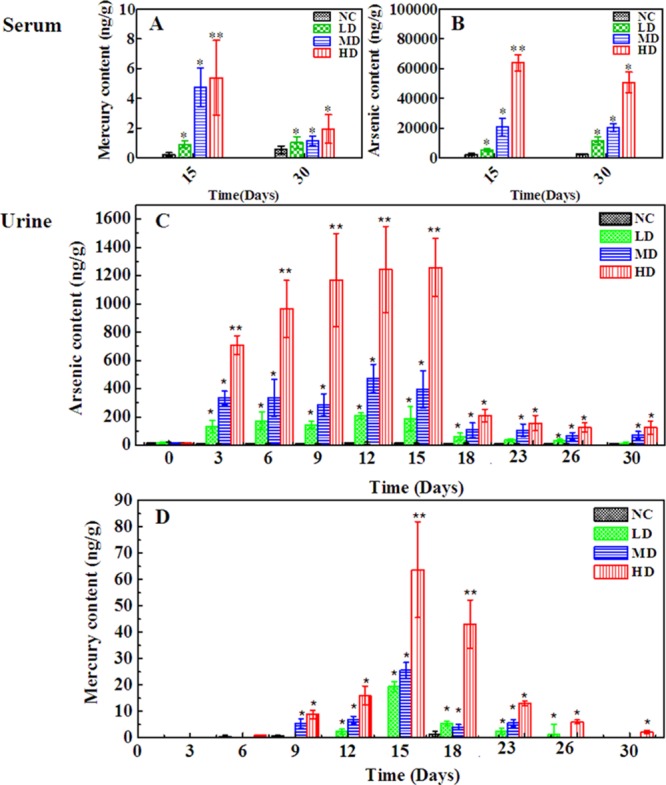
Content of As and Hg in rats serum (A,B) and urine samples (C,D) from the four groups. *p < 0.05, **p < 0.01 vs control group. NC: normal control group, LD: low-dose group, MD: middle-dose group, HD: high-dose group.
Discussion
In this study, the toxic effects of RQCJ were evaluated by 1H NMR-based metabolomics methods combined with serum biochemistry, histopathology, and ICP-MS. There were increased levels of AST and ALT and decreased BUN in RQCJ groups from serum biochemistry results, which was consistent with the results of histopathological examination: slight necrosis, dilation of hepatocytes, and mild renal tubular lesions in liver samples. Meanwhile, the ICP-MS results indicated dose-dependent changes of As and Hg in urine and serum from RQCJ groups. The statistical analysis of 1H NMR metabolomic profiles of urine and serum samples revealed potential biomarkers and the relevant metabolic pathways induced by RQCJ, such as disturbances in energy metabolism and amino acid metabolism, imbalance of intestinal flora environment and membrane damage, and injury of liver and kidney.
Compared with the NC group, there were lower levels of 2-oxoglutarate, phosphocholine, creatinine, 1-methylnicotinamide, and formate and higher levels of leucine, valine, lactate, taurine, glycine, betaine, hippurate, fumarate, and benzoate in the urine samples of RQCJ groups. In addition, compared with the NC group, levels of isoleucine, leucine, valine, lactate, acetate, proline, methionine, acetoacetate, pyruvate, creatine, choline, serine, and threonine increased significantly while levels of glucose was decreased in serum samples. The disturbed metabolic pathways are shown in Figure 8.
Figure 8.
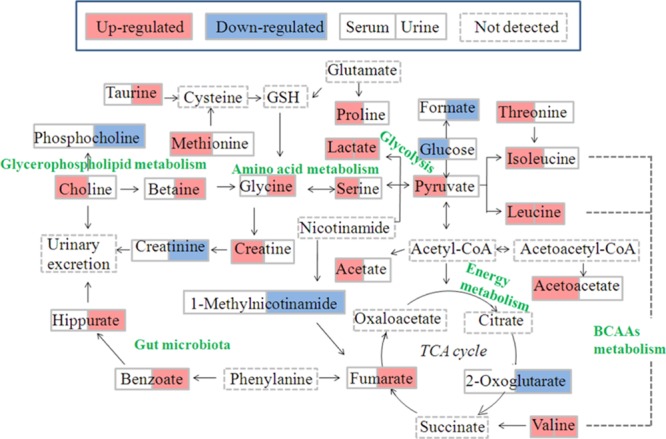
Schematic diagram of the disturbed metabolic pathways related to toxicity induced by RQCJ, showing the interrelationship of the identified metabolic pathways.
Fumarate and 2-oxoglutarate, regarded as important intermediates of the tricarboxylic acid cycle (TCA cycle), were reported associated with energy supply.34 The level of 2-oxoglutarate was decreased and fumarate was increased in urine samples from RQCJ groups, suggesting the imbalance of the TCA cycle was caused by the mitochondrial dysfunction and insufficient energy supply.35 On this condition, glycolysis was used for energy production. On account of the decreased level of glucose and increased levels of pyruvate and lactate which could be metabolized from glucose, energy provided from aerobic metabolism could not meet the body needs. As a core constituent of ketone bodies, acetoacetate is formed according to incomplete oxidation of fatty acid.36 When the lipolysis was enhanced, the long chain fatty acyl-CoA increased and accumulated. In mitochondria, acetyl-CoA, especially long-chain acyl-CoA, increased and inhibited citric acid synthase by isomerization, which made it difficult for acetyl-CoA to enter TCA cyclic oxidation and condenses acetyl-CoA accumulated in liver to form ketones.37 Increased levels of acetate and acetoacetate in serum samples of RQCJ-treated groups suggested energy metabolism disorders which might be related to the increased levels of ketone bodies.
Branched chain amino acids (BCAAs), including valine, leucine, and isoleucine, are mainly produced by daily intake of protein foods.38 The levels of BCAAs were upregulated to a certain extent in serum samples of RQCJ treated rats. On the one hand, it might indicate an inhibition of the synthesis of proteins, branched fatty acids, and neurotransmitters, which induced the accumulation of valine, leucine, and isoleucine. On the other hand, the feedback against Hg toxicity could promote leucine and isoleucine to synthesize oxidoreductases or DNA-repair enzymes for repairing oxidative damage caused by Hg,39 which might contribute to the upregulation of BCAA levels in RQCJ treated rats. As is known, BCAAs could be converted to asparagine and further produce aspartate. Aspartate was a synthetic precursor of lysine, threonine, methionine, and so forth. Accompanied by the increased levels of BCAAs, asparagine was also upregulated which might affect the metabolic processes of threonine and methionine. It has been reported that the increased level of methionine might result from the intake of As.40 Hence, the upregulation of methionine supported that the concentrations of As in RQCJ treated groups were much higher than the NC group.
As a nonessential amino acid, serine is a precursor of synthetic purine, thymine, and choline.41 In addition, serine is used for promoting the metabolism of fats and fatty acids and maintaining the normal function of immune system.42 If necessary, serine will be synthesized from glycine. However, excessive accumulation of serine might cause immune suppression and psychological symptoms, either.43 In this study, the increased serum concentration of serine and urine concentration of glycine provided evidence for adverse effects of RQCJ on immune system.
Creatinine is produced by the catabolism of creatine and is excreted by the kidney. Both creatinine and creatine are associated with the processes of ATP delivery and consumption.44 In this study, the levels of creatinine decreased in the urine after RQCJ intervention. At the same time, a decreased level of 1-methylnicotinamide was detected, which was considered as a sign of tubular dysfunction.45 These results indicated the dysfunction of energy metabolism and renal function in RQCJ groups.
The level of choline was increased in serum, and phosphocholine was decreased in urine of RQCJ groups. As the major component of the cell membrane, choline can be produced through decomposition of phosphatidylcholine and plays an important role in maintaining cell integrity.46 An increasing serum level of choline in RQCJ groups suggested the impairment of membrane in fluidity, which had been verified in the previous studies on the toxicity assessment of Arisaematis Rhizoma in rats.41 Meanwhile, it has been reported that As could cause membrane damage by destroying the membrane structure and increasing membrane permeability.47 Thus, high levels of As in serum of RQCJ groups also supported membrane damage. Besides, as a metabolite of choline, the increased level of betaine might also indicate disorders in choline metabolism.
There are several important physiological functions of Taurine, including promoting glycolipid metabolism, antioxidation accompanied with regulating osmotic pressure, and so forth.27 Taurine is considered as a specific marker of hepatotoxicity48 for it is produced by the liver in response to a toxic injury and subsequently released from damaged cells. Thus, the increased level of taurine in urine indicated the liver dysfunction induced by RQCJ, consistent with the histological examination and clinical chemistry results.
Hippurate is synthesized from benzoate and glycine in the liver. Moreover, benzoate is a metabolite of intestinal microbiota.49 Therefore, an increase of the hippurate level in urine implied a disruption or imbalance of intestinal microbiota. According to the previous study, urinary hippurate synthesis was considered to be influenced by metabolites of As.50 In this study, the elevated hippurate level in urine might support the high concentration of As.
After 15 days of recovery, there was an obvious trend of resumption for most of the altered metabolites in both serum and urine. The restored metabolites mainly included acetoacetate, 3-HB, valine, lysine, threonine, methionine, serine, and taurine. However, there were still remained some significantly altered metabolites, which were involved in the disturbances of energy metabolism, perturbation of intestinal microenvironment, membrane damage, and so forth.
Conclusions
In the present study, the 1H NMR-based metabonomics approach combined with histopathology, clinical biochemistry, and ICP-MS were applied to the systemic evaluation of RQCJ toxicity on rats. These findings demonstrated that the administration of RQCJ might induce obvious metabolic changes in serum and urine samples, which is related to perturbation in energy metabolism, amino acid metabolism, gut microbiota environment, membrane damage, and so forth. In addition, long-term administration of RQCJ might induce slight and reversible hepatotoxicity and nephrotoxicity. In addition, As and Hg were detected at a high level both in serum and urine after RQCJ administration, which might be caused by toxic constituents of RQCJ. Therefore, precautions should be taken in the clinic to monitor the potential toxicity of RQCJ. Our present study explored the toxicity of RQCJ from a systematic and holistic perspective and provided data support for the application of RQCJ in clinic.
Experimental Procedures
Chemicals
RQCJ was obtained from Tso-Ngon Tibetan Medicine Hospital (QingHai, China). Analytical pure K2HPO4 and NaH2PO4 were purchased from Sigma-Aldrich (St. Louis, MO, U.S.A.). Deuterium oxide (D2O, 99.9% D) and 3-(trimethylsilyl)-propionic-2,2,3,3-d4 acid sodium salt (TSP, 98.0% D) were purchased from Cambridge Isotope Laboratories, Inc. (MA, U.S.A.). Standard stock solutions of mercury and arsenic were obtained from the Central Iron & Steel Research Institute (Beijing, China).
Animals
Forty-eight SPF Sprague-Dawley male rats (200–220 g, 7 weeks old, Rodent license no. SCXK 2011-0004) were purchased from Sibeifu Laboratory Animal Technology Co., Ltd. (Beijing, China). The experimental animals were housed at 22 ± 2 °C and the relative humidity was 55 ± 5%, with a 12/12 h light–dark cycles. All rats were acclimatized for a week before administration. The animal experiments were approved by the Animal Ethics Committee of Beijing University of Chinese Medicine and were in strict accordance with the guidelines for Care and Use of Laboratory Animals.
Drug Administration and Sample Collection
Rats were randomly divided into four groups (n = 12): NC group, low-dose (LD) group, middle-dose (MD) group, and high-dose (HD) group. The NC group was intragastrically administered with normal saline (1 mL/100 g). LD, MD, and HD groups were intragastrically administered with equal volume RQCJ at a dose of 250.0, 666.7, and 1666.7 mg·kg–1, respectively. The experimental doses were equivalent to 15, 40, and 100 times of the human (60 kg adults) clinical dose (1 g per human per day, Chinese Pharmacopoeia, version 2015). Rats were intragastrically administered for 15 consecutive days and then recovered for 15 days. The total experiment lasted for 30 days.
On the 15th day, half of rats in each group were sacrificed, while the rest half were sacrificed on the 30th day. The blood samples were collected and separated by centrifugation (13,000 rpm, 4 °C, 15 min). Urine samples were collected in ice-cooled tubes containing 50 μL sodium azide (1%, w/v) at day 0 (one day before treatment), days 3, 6, 9, 12, and 15 (the time points of administration) and days 18, 23, 26, and 30 (the time points of stop administration). All of the samples were stored at −80 °C for further 1H NMR spectroscopy analysis, serum biochemical and ICP-MS determination. The liver and kidney tissues were immediately removed from rats, rinsed with cold phosphate buffer saline, and immersed in 10% neutral-buffered formalin solution for histopathological examination.
Clinical Biochemistry and Histopathology
The clinical biochemical assays of serum samples were performed by an Olympus 2700 biochemistry analyzer (Olympus Co., Japan). Biochemical parameters included serum ALT, AST, ALP, and serum and urea nitrogen (BUN).
The formalin-fixed liver and kidney slices were dehydrated, embedded in paraffin, and then cut into 5 μm sections. The sections were stained with hematoxylin and eosin (H&E) for microscopic observation.
Sample Preparation for NMR Measurement
The serum and urine sample were thawed at room temperature. For serum, each 200 μL of sample was mixed with 400 μL of deuterated phosphate buffer (NaH2PO4/K2HPO4, 0.045 mol/L, pH = 7.47). For urine, 55 μL of deuterated phosphate buffer (NaH2PO4/K2HPO4, 1.5 mol/L, containing 0.01% TSP, pH = 7.47) was added to 550 μL of sample. All of the mixtures were allowed to stand at room temperature for 5 min and then centrifuged for 15 min to remove precipitates (13,000 rpm, 4 °C). The supernatant (550 μL) was transferred into a 5 mm NMR tube and maintained at 4 °C until NMR measurement.
1H NMR Spectroscopy Analysis of Urine and Serum Samples
NMR spectra of the serum and urine samples were acquired on a VARIAN VNMRS 600 MHz NMR spectrometer (Varian Inc, Palo Alto, Calif) equipped with a 5 mm inverse-proton (HX) triple resonance probe and z-axis gradient coil, operated at 1H frequency of 599.901 MHz and a temperature of 298 K. The urine spectra were measured using the following parameters: nuclear overhauser enhancement spectroscopy (NOESY) pulse sequence [relaxation delay (RD)–90°–t1–90°–tm–90°–acquisition] with water suppression [RD = 2.0 s, mixing time (tm) = 100 ms, short delay (t1) = 4 μs]. The 90° pulse length was adjusted to approximately 10 μs, 64 K data points were obtained form 128 transients using a spectral width of 20 ppm. Prior to fourier transformation, the free induction decays (FIDs) were weighted by an exponential function with a line-broadening factor of 0.5 Hz. The serum spectra were measured using the following parameters: the water-suppressed standard Carr–Purcell–Meibom–Gill pulse sequence (RD −90°–(τ–180°−τ)n–acquisition) with a fixed total spin–spin RD 2nτ of 320 ms. Weakening the broad NMR signals from macromolecules (such as proteins) by the sequence, the signals of micromolecules were obviously observed. The FIDs were collected into 64 K data points over a spectral width of 12,000 Hz with 128 scans. The FIDs were zero-filled to double size and multiplied by an exponential line-broadening factor of 0.5 Hz before fourier transformation.
ICP-MS Measurement of Urine and Serum Samples
Urine and serum samples were thawed at room temperature and then digested with HNO3 + H2O2 (5:1) dissolution system using a modified acid digestion method on microwave digestion instrument (CEM Co., MARS). The digested solution was then detected by ICP-MS (Agilent Technologies, 7500 Ce) for determination of the tracer elements of 75As and 202Hg. The Hg and As standard solutions (calibration curve, 0.1, 1, 10, and 100 ng/mL) were obtained by dilution 100 mg/L standard stock solutions with ultrapure deionized water (containing 5% (w/w) HNO3). Quantification was based on 72germanium (72Ge) as internal standards for As and 209bismuth (209Bi) for Hg.
Data Processing
All of the 1H NMR spectra of serum and urine were processed using MestReNova7.1.2 software (Mestrelab Research SL, Spain). Each spectrum manually phased adjustment and baseline corrected. Shift correction is based on lactate at δ 1.33 (serum samples) or TSP at δ 0.00 (urine samples). Then, the region of δ 9.0–0.5 in serum spectra and δ 9.5–0.5 in urine spectra were binned into 0.002 ppm integrated spectral buckets. In order to eliminate the influence of the residual water signals, the δ 5.2–4.7 region both in urine spectra and serum spectra were removed. For the urine spectra, the region of δ 6.0–5.45 was also excluded to avoid the effects of urea signals. The remaining integrated regions were normalized to total area of the spectra.
The normalized NMR data were imported into SIMCA-P+12.0 (Umetrics Inc, Sweden) for multivariate statistical analysis. PCA was performed using a mean-centered method, which can reflect the inherent clustering trends and determine the outliers. The analysis results were visualized using scores plots. The normalized data were subjected to unit variance-scaled approach for PLS-DA and OPLS-DA. PLS-DA was utilized to analyze the relationship between NMR data (X variable) and grouping variable (Y variable) and obtain variables that contributed most to the separation (variable projection importance (VIP) > 1). The quality and validity of PLS-DA model were assessed using a sevenfold cross-validation method and 200 permutation tests, while R2 and Q2 were utilized to indicate the interpretability of variables and predictability of the models. OPLS-DA was utilized to maximize the difference between the groups, and the coefficient plot corresponding to OPLS-DA model was generated using MATLAB R2012a software (Version 7.1, Mathworks Inc, USA) combined with self-programming. The coefficient plots were color-coded according to the absolute value of coefficients (r), and the metabolites with hot color (red) contributed more to the group separation than the ones with cold color (blue). Then, the independent sample t-test was followed by multivariate statistical analysis to further compare the significant difference in selected metabolites via SPSS 17.0 (SPSS Inc, USA), and the significance threshold was set to P < 0.05. In this research, metabolites were identified as potential biomarkers on the basis of correlation coefficients (|r| > 0.707, n = 12), variable importance (VIP > 1) and statistically significant (P < 0.05). The identified potential biomarkers were analyzed for metabolic pathway using the MetaboAnalyst 4.0 (http://www.metaboanalyst.ca). In order to visualize the metabolic network, we used MetScape (http://metscape.ncibi.org./) to integrate the compound network.
Acknowledgments
We acknowledge the financial supports from the National Natural Science Foundation of China (81573832), Beijing Municipal Natural Science Foundation (8153036), and Qinghai province Applied fundamental research (no. 2018-ZJ-708).
Supporting Information Available
The Supporting Information is available free of charge at https://pubs.acs.org/doi/10.1021/acsomega.9b03084.
Body weight of rats in four groups during RQCJ administration and withdrawal recovery; PLS-DA score plot of serum and urine samples at day 15 and day 30; OPLS-DA score plots and color-coded coefficient plots of serum samples; PCA score plot of urine samples at different day; OPLS-DA score plots and color-coded coefficient plots of urine samples at day 15 and day 30; network of potential biomarkers associated with RQCJ in serum by Metscape analysis; network of potential biomarkers associated with RQCJ in urine by Metscape analysis; summary of serum clinical biochemical parameters at day 15 and day 30; results from pathway analysis with MetPA from serum; results from pathway analysis with MetPA from urine; contents of As and Hg in serum sample of control and dosed-group (ng/g); and content of As and Hg in urine sample of control and dosed group (ng/g) (PDF)
Author Contributions
∥ X.W. and C.R. contributed equally to this work.
The authors declare no competing financial interest.
Supplementary Material
References
- Liu M.; He Y.; Ge S.; Cheng M.; Xie H.; Yu C.; Wang X. Chemical Form and Bioaccessibility of Mercury in Traditional Tibetan Medicines. Environ. Sci. Technol. Lett. 2018, 5, 552–557. 10.1021/acs.estlett.8b00371. [DOI] [Google Scholar]
- Cesnek M.; Štefánik M.; Miglierini M.; Kmječ T.; Sklenka L. U. Analysis of traditional Tibetan pills. Hyperfine Interact. 2017, 238, 93. 10.1007/s10751-017-1469-8. [DOI] [Google Scholar]
- Zhou L.-L.; Chen H.-J.; He Q.-Q.; Li C.; Wei L.-X.; Shang J. Evaluation of hepatotoxicity potential of a potent traditional Tibetan medicine Zuotai. J. Ethnopharmacol. 2019, 234, 112–118. 10.1016/j.jep.2018.12.028. [DOI] [PubMed] [Google Scholar]
- Sallon S.; Dory Y.; Barghouthy Y.; Tamdin T.; Sangmo R.; Tashi J.; Yangdon S.; Yeshi T.; Sadutshang T.; Rotenberg M.; Cohen E.; Harlavan Y.; Sharabi G.; Bdolah-Abram T. Is mercury in Tibetan Medicine toxic? Clinical, neurocognitive and biochemical results of an initial cross-sectional study. Exp. Biol. Med. 2017, 242, 316–332. 10.1177/1535370216672748. [DOI] [PMC free article] [PubMed] [Google Scholar]
- Li C.; Xu W.; Chu S.; Zheng Z.; Xiao Y.; Li L.; Bi H.; Wei L. The chemical speciation, spatial distribution and toxicity of mercury from Tibetan medicine Zuotai,β-HgS and HgCl2 in mouse kidney. J. Trace Elem. Med. Biol. 2018, 45, 104–113. 10.1016/j.jtemb.2017.08.010. [DOI] [PubMed] [Google Scholar]
- Martena M. J.; Van Der Wielen J. C. A.; Rietjens I. M. C. M.; Klerx W. N. M.; De Groot H. N.; Konings E. J. M.; De; Konings E. J. M. Monitoring of mercury, arsenic, and lead in traditional Asian herbal preparations on the Dutch market and estimation of associated risks. Food Addit. Contam., Part A: Chem., Anal., Control, Exposure Risk Assess. 2010, 27, 190–205. 10.1080/02652030903207235. [DOI] [PubMed] [Google Scholar]
- Xiang L.; Lin B.; Wang P.; Hu Y.; Wu J.; Zeng Y.; Meng X. Evaluation of the potential nephrotoxicity and mechanism in rats after long-term exposure to the traditional Tibetan medicine tsothel. Pharm. Biol. 2018, 56, 678–690. 10.1080/13880209.2018.1543332. [DOI] [PMC free article] [PubMed] [Google Scholar]
- Zira A.; Kostidis S.; Theocharis S.; Sigala F.; Engelsen S. B.; Andreadou I.; Mikros E. 1 H NMR-based metabonomics approach in a rat model of acute liver injury and regeneration induced by CCl 4 administration. Toxicology 2013, 303, 115–124. 10.1016/j.tox.2012.10.015. [DOI] [PubMed] [Google Scholar]
- Karakitsou E.; Foguet C.; de Atauri P.; Kultima K.; Khoonsari P. E.; Martins dos Santos V. A. P.; Saccenti E.; Rosato A.; Cascante M. Metabolomics in systems medicine: an overview of methods and applications. Curr. Opin. Syst. Biol. 2019, 15, 91–99. 10.1016/j.coisb.2019.03.009. [DOI] [Google Scholar]
- Zhang Y.; Hu H.; Shi Y.; Yang X.; Cao L.; Wu J.; Asweto C. O.; Feng L.; Duan J.; Sun Z. 1 H NMR-based metabolomics study on repeat dose toxicity of fine particulate matter in rats after intratracheal instillation. Sci. Total Environ. 2017, 589, 212–221. 10.1016/j.scitotenv.2017.02.149. [DOI] [PubMed] [Google Scholar]
- Kim K.-B.; So Young U.; Myeon Woo C.; Seung Chul J.; Seon O. J.; Seon Hwa K.; Sung N. H.; Byung Mu L.; Ki Hwan C. Toxicometabolomics approach to urinary biomarkers for mercuric chloride (HgCl?)-induced nephrotoxicity using proton nuclear magnetic resonance (1H NMR) in rats. Toxicol. Appl. Pharmacol. 2010, 249, 114–126. 10.1016/j.taap.2010.08.017. [DOI] [PubMed] [Google Scholar]
- MacKinnon N.; Ge W.; Han P.; Siddiqui J.; Wei J. T.; Chinnaiyan A. M.; Rajendiran T. M.; Ramamoorthy A.; Ramamoorthy A. NMR-Based Metabolomic Profiling of Urine: Evaluation for Application in Prostate Cancer Detection. Nat. Prod. Commun. 2019, 14, 1934578X1984997. 10.1177/1934578x19849978. [DOI] [Google Scholar]
- Zhang P.; Zhang W.; Lang Y.; Qu Y.; Chen J.; Cui L. 1H nuclear magnetic resonance-based metabolic profiling of cerebrospinal fluid to identify metabolic features and markers for tuberculosis meningitis. Infect., Genet. Evol. 2019, 68, 253–264. 10.1016/j.meegid.2019.01.003. [DOI] [PubMed] [Google Scholar]
- Xue L.-M.; Zhang Q.-Y.; Han P.; Jiang Y.-P.; Yan R.-D.; Wang Y.; Rahman K.; Jia M.; Han T.; Qin L.-P. Hepatotoxic constituents and toxicological mechanism of Xanthium strumarium L. fruits. J. Ethnopharmacol. 2014, 152, 272–282. 10.1016/j.jep.2013.12.024. [DOI] [PubMed] [Google Scholar]
- Kim J. W.; Ryu S. H.; Siwon K.; Hae Won L.; Mi-Sun L.; Sook Jin S.; Suhkmann K.; Young-Ran Y.; Kyu-Bong K. Pattern Recognition Analysis for Hepatotoxicity Induced by Acetaminophen Using Plasma and Urinary (1)H NMR-Based Metabolomics in Humans. Anal. Chem. 2013, 85, 11326–11334. 10.1021/ac402390q. [DOI] [PubMed] [Google Scholar]
- Vignoli A.; Ghini V.; Meoni G.; Licari C.; Takis P. G.; Tenori L.; Turano P.; Luchinat C. High-Throughput Metabolomics by 1D NMR. Angew. Chem., Int. Ed. 2019, 58, 968–994. 10.1002/anie.201804736. [DOI] [PMC free article] [PubMed] [Google Scholar]
- Nagana Gowda G. A.; Raftery D. Recent Advances in NMR-Based Metabolomics. Anal. Chem. 2016, 89, 490. 10.1021/acs.analchem.6b04420. [DOI] [PMC free article] [PubMed] [Google Scholar]
- Keun H. C.; Ebbels T. M. D.; Antti H.; Bollard M. E.; Beckonert O.; Schlotterbeck G.; Senn H.; Niederhauser U.; Holmes E.; Lindon J. C.; Nicholson J. K. Analytical reproducibility in (1)H NMR-based metabonomic urinalysis. Chem. Res. Toxicol. 2002, 15, 1380–1386. 10.1021/tx0255774. [DOI] [PubMed] [Google Scholar]
- Abdul Ghani Z. D. F.; Ab Rashid A. H.; Shaari K.; Chik Z. Urine NMR Metabolomic Study on Biochemical Activities to Investigate the Effect of P. betle Extract on Obese Rats. Appl. Biochem. Biotechnol. 2019, 189, 690–708. 10.1007/s12010-019-03042-w. [DOI] [PubMed] [Google Scholar]
- Madrid-Gambin F.; Brunius C.; Garcia-Aloy M.; Estruel-Amades S.; Landberg R.; Andres-Lacueva C. Untargeted 1H NMR-Based Metabolomics Analysis of Urine and Serum Profiles after Consumption of Lentils, Chickpeas, and Beans: An Extended Meal Study To Discover Dietary Biomarkers of Pulses. J. Agric. Food Chem. 2018, 66, 6997–7005. 10.1021/acs.jafc.8b00047. [DOI] [PubMed] [Google Scholar]
- Lécuyer L.; Victor Bala A.; Deschasaux M.; Bouchemal N.; Nawfal Triba M.; Vasson M.-P.; Rossary A.; Demidem A.; Galan P.; Hercberg S.; Partula V.; Le Moyec L.; Srour B.; Fiolet T.; Latino-Martel P.; Kesse-Guyot E.; Savarin P.; Touvier M. NMR metabolomic signatures reveal predictive plasma metabolites associated with long-term risk of developing breast cancer. Int. J. Epidemiol. 2018, 47, 484–494. 10.1093/ije/dyx271. [DOI] [PubMed] [Google Scholar]
- Grassin-Delyle S.; Martin M.; Hamzaoui O.; Lamy E.; Jayle C.; Sage E.; Etting I.; Devillier P.; Alvarez J.-C. A high-resolution ICP-MS method for the determination of 38 inorganic elements in human whole blood, urine, hair and tissues after microwave digestion. Talanta 2019, 199, 228–237. 10.1016/j.talanta.2019.02.068. [DOI] [PubMed] [Google Scholar]
- Chantada-Vázquez M. P.; Herbello-Hermelo P.; Bermejo-Barrera P.; Moreda-Piñeiro A. Discrete sampling based-flow injection as an introduction system in ICP-MS for the direct analysis of low volume human serum samples. Talanta 2019, 199, 220–227. 10.1016/j.talanta.2019.02.050. [DOI] [PubMed] [Google Scholar]
- Muñoz D.; Maynar M.; Barrientos G.; Siquier-Coll J.; Bartolomé I.; Grijota F. J.; Robles M. C. Effect of an Acute Exercise Until Exhaustion on the Serum and Urinary Concentrations of Cobalt, Copper, and Manganese Among Well-Trained Athletes. Biol. Trace Elem. Res. 2019, 189, 387–394. 10.1007/s12011-018-1500-1. [DOI] [PubMed] [Google Scholar]
- Su G.; Wang H.; Gao Y.; Chen G.; Pei Y.; Bai J. 1H-NMR-Based Metabonomics of the Protective Effect of Coptis chinensis and Berberine on Cinnabar-Induced Hepatotoxicity and Nephrotoxicity in Rats. Molecules 2017, 22, 1855. 10.3390/molecules22111855. [DOI] [PMC free article] [PubMed] [Google Scholar]
- Xu W.; Wang H.; Chen G.; Li W.; Xiang R.; Pei Y. 1H NMR-based metabonomics study on the toxicity alleviation effect of other traditional Chinese medicines in Niuhuang Jiedu tablet to realgar (As2S2). J. Ethnopharmacol. 2013, 148, 88–98. 10.1016/j.jep.2013.03.073. [DOI] [PubMed] [Google Scholar]
- Wang H.; Bai J.; Chen G.; Li W.; Xiang R.; Su G.; Pei Y. A metabolic profiling analysis of the acute hepatotoxicity and nephrotoxicity of Zhusha Anshen Wan compared with cinnabar in rats using 1H NMR spectroscopy. J. Ethnopharmacol. 2013, 146, 572–580. 10.1016/j.jep.2013.01.026. [DOI] [PubMed] [Google Scholar]
- Wang X.; Wang D.; Zhou Z.; Zhu W. Subacute oral toxicity assessment of benalaxyl in mice based on metabolomics methods. Chemosphere 2018, 191, 373–380. 10.1016/j.chemosphere.2017.10.085. [DOI] [PubMed] [Google Scholar]
- Xiong Z.; Lang L.; Gao X.; Xiao W.; Wang Z.; Zhao L. An integrative urinary metabolomic study of the therapeutic effect of Guizhi Fuling capsule on primary dysmenorrheal rats based 1H NMR and UPLC-MS. J. Pharm. Biomed. Anal. 2019, 164, 750–758. 10.1016/j.jpba.2018.11.039. [DOI] [PubMed] [Google Scholar]
- Jiang L.; Si Z.-H.; Li M.-H.; Zhao H.; Fu Y.-H.; Xing Y.-X.; Hong W.; Ruan L.-Y.; Li P.-M.; Wang J.-S. 1H NMR-based metabolomics study of liver damage induced by ginkgolic acid (15:1) in mice. J. Pharm. Biomed. Anal. 2017, 136, 44–54. 10.1016/j.jpba.2016.12.033. [DOI] [PubMed] [Google Scholar]
- Amiot A.; Dona A. C.; Wijeyesekera A.; Tournigand C.; Baumgaertner I.; Lebaleur Y.; Sobhani I.; Holmes E. 1H NMR Spectroscopy of Fecal Extracts Enables Detection of Advanced Colorectal Neoplasia. J. Proteome Res. 2015, 14, 3871–3881. 10.1021/acs.jproteome.5b00277. [DOI] [PubMed] [Google Scholar]
- Zong L.; Pi Z.; Shu L.; Liu Z.; Song F. Metabolomics analysis of multidrug-resistant breast cancer cells: In vitro using methyl- tert -butyl ether method. RSC Adv. 2018, 8, 15831–15841. 10.1039/c7ra12952a. [DOI] [PMC free article] [PubMed] [Google Scholar]
- Olmedo P.; Pla A.; Hernández A. F.; Barbier F.; Ayouni L.; Gil F. Determination of toxic elements (mercury, cadmium, lead, tin and arsenic) in fish and shellfish samples. Risk assessment for the consumers. Environ. Int. 2013, 59, 63–72. 10.1016/j.envint.2013.05.005. [DOI] [PubMed] [Google Scholar]
- Fan Y.; Liu S.; Chen X.; Feng M.; Song F.; Gao X. Toxicological effects of Nux Vomica in rats urine and serum by means of clinical chemistry, histopathology and 1 H NMR-based metabonomics approach. J. Ethnopharmacol. 2018, 210, 242–253. 10.1016/j.jep.2017.06.027. [DOI] [PubMed] [Google Scholar]
- Wang L.; Zheng L.; Luo R.; Zhao X.; Han Z.; Wang Y.; Yang Y. A 1H NMR-based metabonomic investigation of time-dependent metabolic trajectories in a high salt-induced hypertension rat model. RSC Adv. 2015, 5, 281–290. 10.1039/c4ra07215d. [DOI] [Google Scholar]
- Liu H.; Tayyari F.; Edison A. S.; Su Z.; Gu L. NMR-based metabolomics reveals urinary metabolome modifications in female Sprague–Dawley rats by cranberry procyanidins. J. Nutr. Biochem. 2016, 34, 136–145. 10.1016/j.jnutbio.2016.05.007. [DOI] [PMC free article] [PubMed] [Google Scholar]
- Yin J.; Liu S.; Yu J.; Wu B. Differential toxicity of arsenic on renal oxidative damage and urinary metabolic profiles in normal and diabetic mice. Environ. Sci. Pollut. Res. Int. 2017, 24, 17485–17492. 10.1007/s11356-017-9391-9. [DOI] [PubMed] [Google Scholar]
- Sun B.; Wang X.; Cao R.; Zhang Q.; Liu Q.; Xu M.; Zhang M.; Du X.; Dong F.; Yan X. NMR-based metabonomics study on the effect of Gancao in the attenuation of toxicity in rats induced by Fuzi. J. Ethnopharmacol. 2016, 193, 617–626. 10.1016/j.jep.2016.10.042. [DOI] [PubMed] [Google Scholar]
- Liu X.; Linbao Z.; Liping Y.; Junbao Y.; Jianmin Z.; Lianzhen L.; Qing W.; Fei L.; Chenghua L.; Dongyan L. Differential toxicological effects induced by mercury in gills from three pedigrees of Manila clam Ruditapes philippinarum by NMR-based metabolomics. Ecotoxicology 2011, 20, 177–186. 10.1007/s10646-010-0569-x. [DOI] [PubMed] [Google Scholar]
- Shi X.; Xiaoli W.; Imhoi K.; Schmidt R. H.; Xinmin Y.; Seong Ho K.; Andrew V.; Mcclain C. J.; Arteel G. E.; Xiang Z. Metabolomic analysis of the effects of chronic arsenic exposure in a mouse model of diet-induced Fatty liver disease. J. Proteome Res. 2014, 13, 547–554. 10.1021/pr400719u. [DOI] [PMC free article] [PubMed] [Google Scholar]
- Dong G.; Wang J.; Guo P.; Wei D.; Yang M.; Kong L. Toxicity assessment of Arisaematis Rhizoma in rats by a 1H NMR-based metabolomics approach. Mol. BioSyst. 2015, 11, 407–417. 10.1039/c4mb00583j. [DOI] [PubMed] [Google Scholar]
- Khoo L. W.; Kow S. F. A.; Maulidiani M.; Ming T. L.; Tan C. P.; Shaari K.; Tham C. L.; Abas F. Plasma and urine metabolite profiling reveals the protective effect of Clinacanthus nutans in an ovalbumin-induced anaphylaxis model: 1 H-NMR metabolomics approach. J. Pharm. Biomed. Anal. 2018, 158, 438–450. 10.1016/j.jpba.2018.06.038. [DOI] [PubMed] [Google Scholar]
- Yun X.; Dong S.; Hu Q.; Dai Y.; Xia Y. 1 H NMR-based metabolomics approach to investigate the urine samples of collagen-induced arthritis rats and the intervention of tetrandrine. J. Pharm. Biomed. Anal. 2018, 154, 302–311. 10.1016/j.jpba.2018.03.026. [DOI] [PubMed] [Google Scholar]
- Liu Y.; Huang R.; Liu L.; Peng J.; Xiao B.; Yang J.; Miao Z.; Huang H. Metabonomics study of urine from Sprague–Dawley rats exposed to Huang-yao-zi using H NMR spectroscopy. J. Pharm. Biomed. Anal. 2010, 52, 136–141. 10.1016/j.jpba.2009.12.026. [DOI] [PubMed] [Google Scholar]
- Kalantari S.; Nafar M.; Samavat S.; Parvin M.; Nobakht M.GH B. F.; Barzi F. (1) H NMR-based metabolomics exploring urinary biomarkers correlated with proteinuria in focal segmental glomerulosclerosis: a pilot study. Magn. Reson. Chem. 2016, 54, 821–826. 10.1002/mrc.4460. [DOI] [PubMed] [Google Scholar]
- Santiago G. T.; Contreras J. I. S.; Camargo M. E. M.; Vallejo L. G. Z. NMR-based metabonomic approach reveals changes in the urinary and fecal metabolome caused by resveratrol. J. Pharm. Biomed. Anal. 2019, 162, 234–241. 10.1016/j.jpba.2018.09.025. [DOI] [PubMed] [Google Scholar]
- Wang C.; Rennan F.; Yuanyuan L.; Yunbo Z.; Zhen K.; Wei Z.; Dian-Jun S. The metabolomic profiling of serum in rats exposed to arsenic using UPLC/Q-TOF MS. Toxicol. Lett. 2014, 229, 474–481. 10.1016/j.toxlet.2014.06.001. [DOI] [PubMed] [Google Scholar]
- Ruan L.-Y.; Fan J.-T.; Hong W.; Zhao H.; Li M.-H.; Jiang L.; Fu Y.-H.; Xing Y.-X.; Chen C.; Wang J.-S. Isoniazid-induced hepatotoxicity and neurotoxicity in rats investigated by 1H NMR based metabolomics approach. Toxicol. Lett. 2018, 295, 256–269. 10.1016/j.toxlet.2018.05.032. [DOI] [PubMed] [Google Scholar]
- Liu Y.; Chen T.; Li M.-H.; Xu H.-D.; Jia A.-Q.; Zhang J.-F.; Wang J.-S. 1H NMR based metabolomics approach to study the toxic effects of dichlorvos on goldfish (Carassius auratus). Chemosphere 2015, 138, 537–545. 10.1016/j.chemosphere.2015.07.030. [DOI] [PubMed] [Google Scholar]
- Xu H.-D.; Wang J.-S.; Li M.-H.; Liu Y.; Chen T.; Jia A.-Q. 1H NMR based metabolomics approach to study the toxic effects of herbicide butachlor on goldfish (Carassius auratus). Aquat. Toxicol. 2015, 159, 69–80. 10.1016/j.aquatox.2014.11.020. [DOI] [PubMed] [Google Scholar]
Associated Data
This section collects any data citations, data availability statements, or supplementary materials included in this article.


