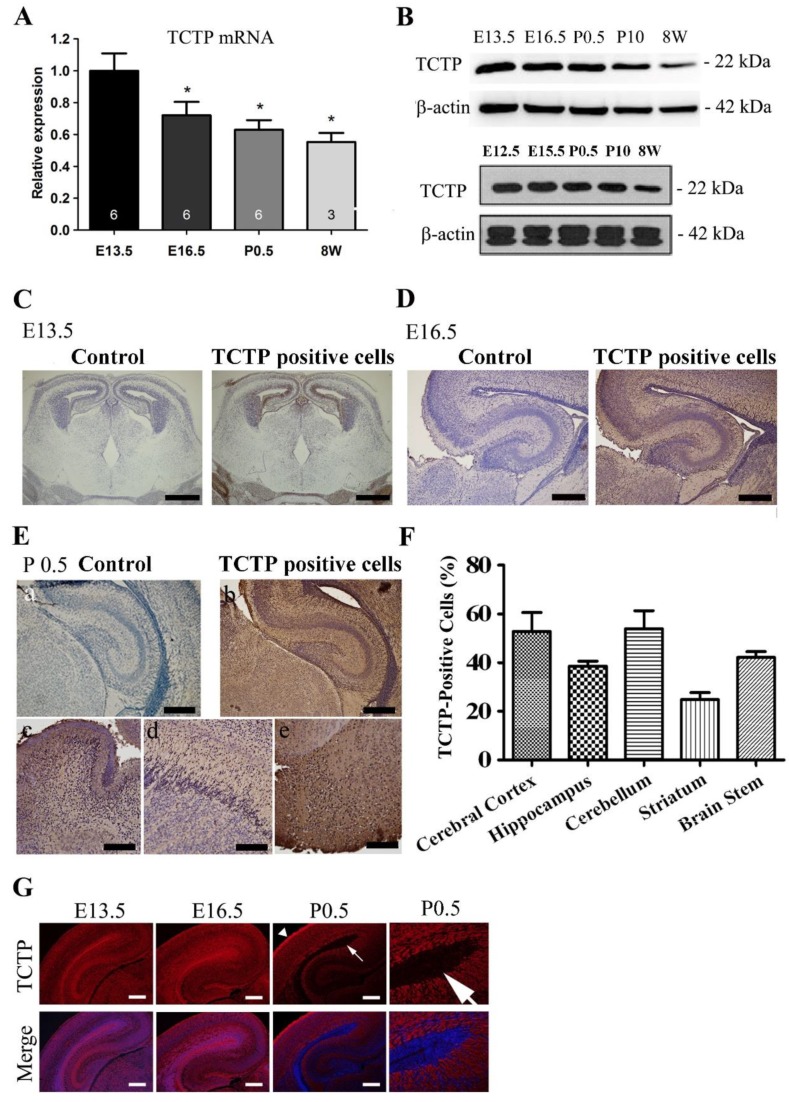
Figure 1.
Expression pattern of translationally controlled tumor-associated protein (TCTP) from the embryonic to adult stage in the brain. (A) Relative TCTP mRNA expression at different stages in the whole brain from wild-type mice was estimated by qRT-PCR (data presented as mean ± SEM, * p < 0.05 compared with embryonic day 13.5 (E13.5), one-way ANOVA, n = 3–6 per group). (B) TCTP protein in the whole brain from control mice (TCTPflox/flox) at E12.5, 13.5, E15.5, 16.5, and postnatal day 0.5, 10, and 56 was estimated by Western blotting. (C–E) TCTP protein expression pattern in whole-brain sagittal sections from wild-type mice at E13.5 and coronal sections at E16.5 and P0.5, including the (a) cerebral cortex, (b) hippocampus, (c) cerebellum, (d) striatum, and (e) brain stem, detected by immunohistochemistry with DAB staining (brown stain indicates TCTP-positive cells) (n = 3 for each time point). (F) Summarized quantification of TCTP protein expression in (E). (G) Representative TCTP (red) and 4’,6-diamidino-2-phenylindole (DAPI)/TCTP double immunofluorescence staining of brain sections from C57BL/6 mice at E13.5, E16.5, and P0.5; n = 3. The arrow indicates the ventricular zone area; the arrowhead indicates the cortical layer. Scale bars: C, 600 μm; D, 200 μm; E: a, c, d, e, 100 μm, b, 200 μm; G, 200 μm.

