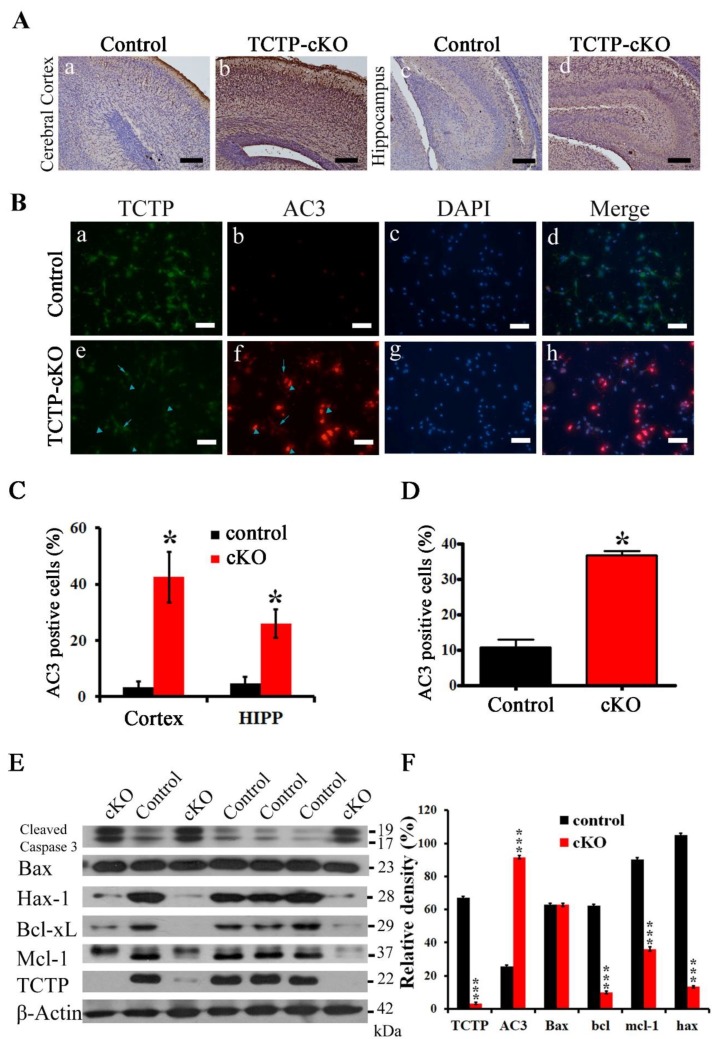
Figure 8.
Caspase cleavage apoptosis was detected by immunohistochemistry, immunofluorescence, and Western blot. Apoptotic and antiapoptotic related protein levels were detected by Western blot. (A) Cerebral cortex and hippocampus of control and TCTP-cKO mice were stained for active caspase-3 (AC3) by immunohistochemistry at P0.5. (B) Double immunofluorescence staining for TCTP (green) and AC3 (red) of primary neuronal cell from control and TCTP-cKO mice at E16.5. The arrow indicates TCTP-positive cells, and the arrowhead indicates TCTP-negative cells. (C) Bar graph summarizing the quantification of active caspase-3 staining in (A). (D) Bar graph summarizing the quantification of active caspase-3 staining in (B). (Data presented as mean ± SEM, * p ≤ 0.05, Student’s t test, n = 3 per group). (E) Protein levels of cleaved caspase-3, bax, hax-1, bcl-xl, mcl-1, and TCTP in control and TCTP-cKO mice were measured by Western blotting at P0.5. (F) Bar graph summarizing quantification of Western blot in (E). Relative density is presented as the ratio of band intensity of target protein to the internal control, β-actin. (Data presented as mean ± SEM, *** p < 0.001, Student’s t test, n = 3 per group). Scale bars: A, 100 μm; B, 40 μm.

