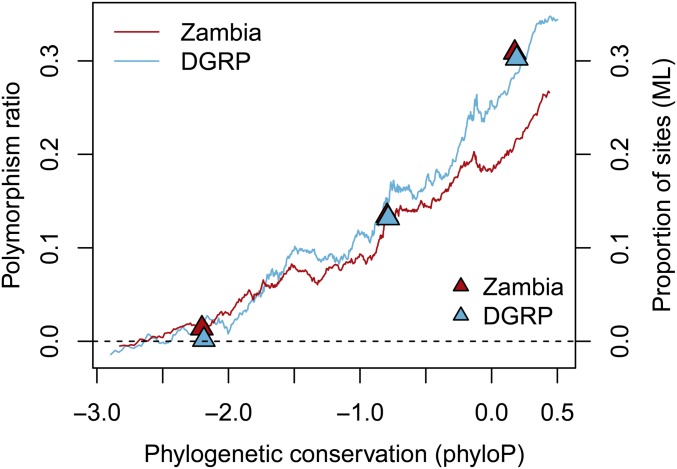
Figure 2.
Phylogenetic conservation correlates with selection estimates. Correlation between the phyloP conservation score across a Drosophila phylogeny, and the proportion of sites under selection, as estimated by the polymorphism ratio (lines) and the maximum-likelihood (ML) method (triangles). Dark red: Zambia, light blue: DGRP. The polymorphism ratio was estimated in sliding windows of 100K SNPs. The ML estimates were made for three groups: the lowest quartile, the middle two quartiles, and the highest quartile of phyloP scores. ML estimates are plotted against the median phyloP score for each group.

