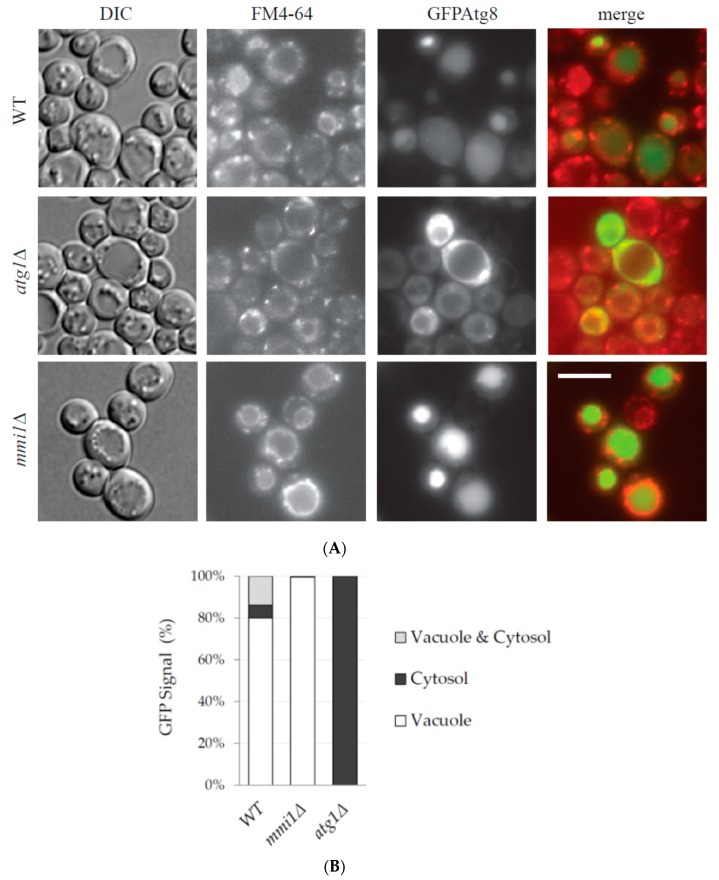
Figure 3.
Fluorescence microscopy detection of a higher GFP-Atg8 processing in mmi1∆ cells upon rapamycin treatment. (A) The same samples of WT, atg1∆, and mmi1∆ cells treated with rapamycin for 24 h and analyzed by Western blot in Figure 2B were examined under fluorescence microscope. Vacuoles were labelled by the red fluorescence probe FM4-64 (1 µg/mL, 1h) and GFP signal was taken under the same exposure time in all tested strains. DIC, differential interference contrast. Scale bar, 5 µm. (B) Quantification of the GFP-Atg8 cellular distribution 24 h after rapamycin addition in WT, mmi1∆, and atg1∆ strains. Results are means from two independent experiments and each bar represents 250 cells.

