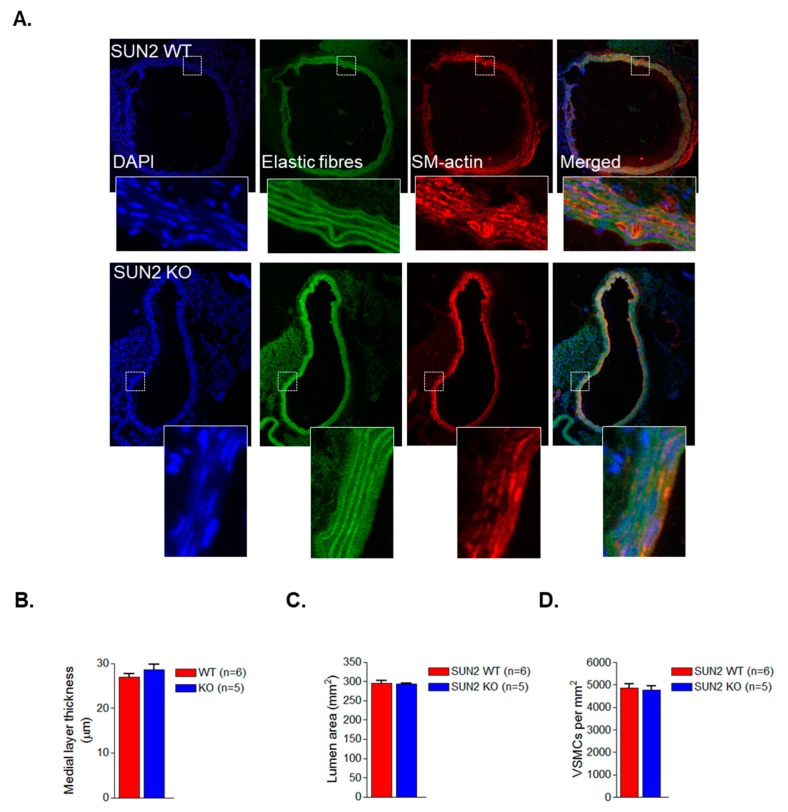
Figure 4.
SUN2 KO aortae display normal VSMC organisation. (A) Representative IHC images of WT and SUN2 KO aortae stained with DAPI (blue), smooth muscle (sm)-actin (red), and the elastic fibre auto-fluorescence (green). Graphs show (B) medial layer thickness, (C) lumen area, and (D) VSMC number in WT and SUN2 KO aortae.

