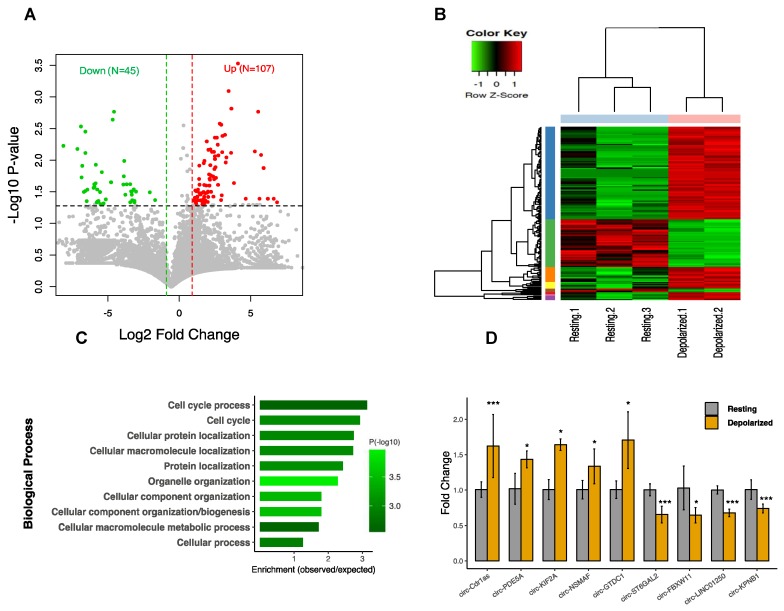
Figure 2.
Differential expression of circRNAs in neuronal depolarization. (A) Volcano plot constructed using fold change values and p-values to compare the circRNA expression changes between depolarized and resting cells. Red dots represent significantly upregulated circRNAs, and green dots represent downregulated circRNAs, with the vertical lines corresponding to two-fold change and the horizontal line representing a p-value < 0.05 cut off. (B) Hierarchical clustering analysis of circRNA expression between depolarized and resting cells. Depolarized group contains two and resting group contains three samples. Expression values are represented in different colors where red shows upregulation and green shows downregulation. (C) Functional enrichment analysis of the differentially expressed (DE) circRNAs host genes. The top 10 significantly enriched biological process terms by gene ontology (GO) analysis. (D) Validation of circRNA differential expression for nine circRNAs using q-PCR. Data are shown as mean ± SEM. Reactions were performed in triplicate for each biological treatment group, and circRNAs expression was normalized using GAPDH as control. Statistical significance was assessed by Student’s t-test (one-tailed). *p < 0.05; *** p < 0.001.

