Figure 5.
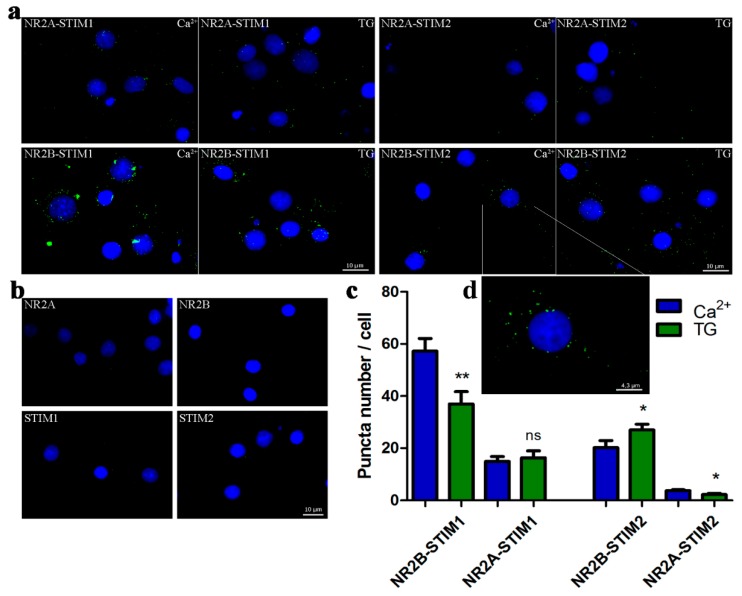
The interaction between endogenous STIM1/STIM2 and NR2A/NR2B occurs in situ. (a) Proximity ligation assay between STIM1 and NR2B, STIM1 and NR2A, STIM2 and NR2B, and STIM2 and NR2A before and after store depletion by TG/EGTA observed by fluorescent microscopy. Neurons were also counter-stained with the nuclear marker Hoechst dye (blue). The PLA signal, recognized as a fluorescent green dot, shows the close proximity of STIM and NR2 antigens. (b) No signals were observed when one of the primary antibodies was omitted (either anti-NR2A or NR2B or STIM1 or STIM2) that demonstrates the specificity of the detection assay and used antibodies. Scale bar, 10 µm for each panel. (c) Quantification of the complexes detected by PLA. Bars represent averages from 15–30 (n) images taken in three independent experiments, corresponding to 42–64 cells ± SEM. The quantification of PLA signals was performed using ImageJ software to analyse neurons. * p < 0.05; ** p < 0.01; ns, not significant compared with the control (Mann–Whitney U test). (d) The picture shows the higher magnification of one neuron from (a) to better visualize the PLA signals and their localization in the cell.

