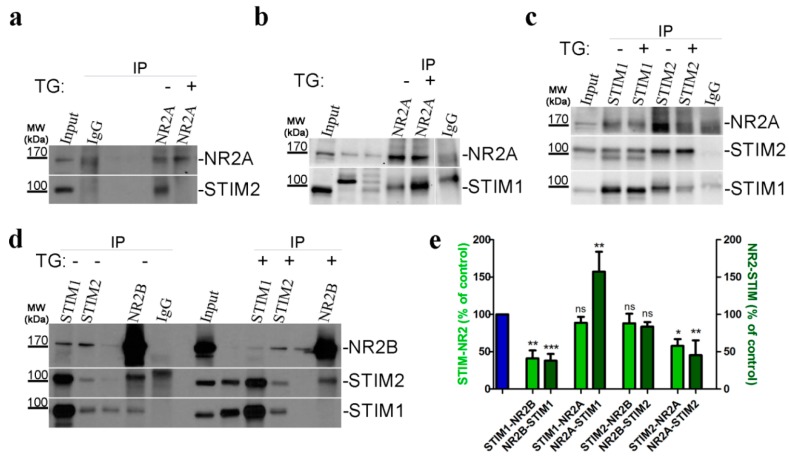
Figure 7.
Endogenous STIMs co-immunoprecipitate with NMDAR2. (a–d) Representative WBs from Co-IP experiments investigating the interaction between endogenous STIM1, STIM2 and NR2A, NR2B subunits, demonstrating a change in the interaction upon SOCE activation by TG (TG; +) compared with control neurons treated with 2 mM Ca2+ (TG; −). Neuronal lysates (Input) and eluted fractions (immunoprecipitates; IP) were separated on 10% sodium dodecyl sulfate gels, analyzed by WB and stained with the corresponding antibody anti-STIM1, STIM2, NR2A, and NR2B (as indicated on the right) as described in “Methods and Materials” section. Anti-IgG antibody was used as a negative control. WB analysis of 40 µg of cell lysate inputs is shown. Molecular weights of the markers run on the same gel are indicated on the left (in kDa). (b,d) Unlabeled bands are irrelevant to this experiment. Unspecific IgG band is visible. (c) The middle panel shows the WB stained with STIM2 protein after stripping the membrane blotted with anti-STIM1 antibody, indicated with double bands here. (e) Pooled data shows a significant change in interaction between STIM proteins and NMDAR subunits after TG treatment. Histogram represents the quantification of STIM-NR (light-green columns) or NR-STIM (dark-green columns) association in neurons incubated in TG compared to neurons incubated in 2 mM Ca2+ (blue column). Bands of co-immunoprecipitates were analyzed densitometrically and normalized to the level of the loading control (i.e., bands obtained after WB with the antibody used for immunoprecipitation). The results are expressed as a percentage of control (i.e., protein association in 2 mM Ca2+). Bar graphs are mean ± SEM of at least three independent experiments. * p < 0.05; ** p < 0.01; *** p < 0.001 significantly different compared with control; ns, not significant compared with the control (Mann–Whitney U test).

