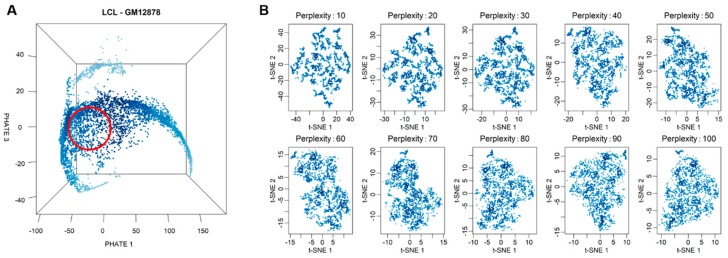
Figure 1.
Selection of a highly homogenous cell population for variability analysis. (A) Three-dimensional PHATE embedding plot for G1-phase cells of GM12878. Each point represents a single cell in the three-dimensional space. The red circle indicates the approximate positions of 1000 selected cells. (B) Embedding plots generated for the 1000 selected cells with a t-SNE algorithm with a series of perplexity values.

