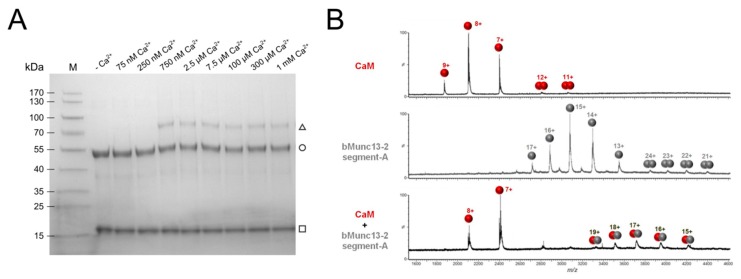
Figure 2.
Ca2+-dependent complex formation between CaM and bMunc13-2 segment-A. (A) Gradient (4-20%) SDS-PAGE gel illustrating cross-linking of the CaM/segment-A complex at various Ca2+ concentrations (adjusted by an EGTA buffer system). Covalent fixation of the complex was achieved by cross-linking of photo-Met residues incorporated in CaM. Proteins are visualized by Coomassie staining. (M) Prestained Protein Ladder, (□) CaM, (○) segment-A and (∆) CaM/segment-A complex. (B) Native MS mass spectra of CaM alone (upper panel), segment-A alone (middle panel) and a segment-A/CaM complex (lower panel). Proteins (10 µM) were applied in 300 mM ammonium acetate (pH 7) and measurements were performed on a high-mass Q-TOF mass spectrometer. MS data were acquired using a capillary voltage of 1.38 kV, a cone voltage of 180 V, and a collision energy of 60 V. Measurements were performed at residual Ca2+ concentration known to be around 5 µM [55].

