

Abstract

Thymidylate kinases are essential enzymes with roles in DNA synthesis and repair and have been the target of drug development for antimalarials, antifungals, HIV treatment, and cancer therapeutics. Human thymidylate kinase (hTMPK) conversion of the anti-HIV prodrug 3′-azido-3′-deoxythymidine (AZT or zidovudine) monophosphate to diphosphate is the rate-limiting step in the activation of AZT. A point mutant (F105Y) has been previously reported with significantly increased activity for the monophosphate form of the drug [3′-azidothymidine-5′-monophosphate (AZTMP)]. Using solution nuclear magnetic resonance (NMR) techniques, we show that while the wild-type (WT) and F105Y hTMPK adopt the same structure in solution, significant changes in dynamics may explain their different activities toward TMP and AZTMP. 13C spin-relaxation measurements show that there is little change in dynamics on the ps to ns time scale. In contrast, methyl 1H relaxation dispersion shows that AZTMP alters adenosine nucleotide handling in the WT protein but not in the mutant. Additionally, the F105Y mutant has reduced conformational flexibility, leading to an increase in affinity for the product ADP and a slower rate of phosphorylation of TMP. The dynamics at the catalytic center for F105Y bound to AZTMP are tuned to the same frequency as WT bound to TMP, which may explain the mutant’s catalytic efficiency toward the prodrug.
Introduction
Thymidylate kinases (TMPKs, EC 2.7.4.9) catalyze the simple, yet essential phosphorylation of TMP to form TDP using Mg2+ and ATP.1 While other deoxyribonucleotides can be produced from their counterpart ribonucleotides by ribonucleotide reductase, thymidine deoxyribonucleotides are formed exclusively by serial phosphorylation of TMP from one of two starting points: phosphorylation of thymidine by thymidine kinase using the salvage pathway or conversion of dUMP to TMP by thymidylate synthase in the de novo pathway.1,2 TMPK sits at the intersection of these two pathways, serving as the only means of TDP production and thus regulates the pool of available TTP for use in DNA synthesis and repair.3−5 Human and viral TMPKs are required for the activation of a number of antiviral drugs.6
All reported TMPKs are homodimers with an overall molecular weight of approximately 50 kDa and are composed of four functionally important regions: the ATP α- and β-phosphate binding loop (P-loop), the adenosine ring binding loop (A-loop), a domain that forms a lid over the active site (LID), and a nucleotide monophosphate (NMP) binding site (Figure 1).7−14 The P-loop (residues 13–20, human numbering), A-loop (residues 179–184), and LID (residues 134–153) are all involved in binding and orientation of the bound ATP. Type I TMPKs, which are typically found in eukaryotes, contain two important Arg residues (45, 97) that interact with the phosphate groups on the substrates. Type II TMPKs, which are typically found in prokaryotes, possess both of these Arg residues, as well as an additional Arg in the LID.7
Figure 1.

Important structural features of hTMPK. Locations of the P-loop (cyan), A-loop (yellow), and LID (red) are indicated on one monomer. These elements move concomitantly toward α7 of the NMP-binding site (labeled) during the catalytic cycle. ADP and TMP shown in yellow, rendered as sticks (PDB 1e2d).
Most nucleoside monophosphate kinases are assumed to work by a mechanism that is similar to the extensively characterized monomeric AMP kinase (AMPK), though they lack some of the same structural features. AMPK have a variable length loop (ATPlid) that closes over the bound ATP in the near-transition state complex formed with Ap5A. The binding site for the AMP substrate (AMPbd) also becomes more compact in this complex.15 The transition of the ATPlid occurs by unfolding of the ATPlid, followed by refolding in the Ap5A complex.16
Unlike AMPKs, TMPKs contain a much shorter, unstructured LID region that is similar to that of uridylate kinase, and they do not appear to undergo as extensive conformational changes associated with binding of ATP and the nucleoside monophosphate. Crystallographic structures of the type I human thymidylate kinase (hTMPK) taken along the reaction coordinate suggest movement of the P-loop, A-loop, and LID from the so-called “P-loop open” or “P-loop partially-closed” conformation (obtained with an ATP analogue and TMP) to the active “P-loop closed” conformation (obtained with a transition state analogue Ap5dT) is required for catalysis.9 Significant structural changes during the catalytic cycle include a 2 Å shift of the mainchain atoms of the P-loop toward the bound TMP and the side chain of Asp15, which swings toward the 3′OH of the bound TMP from an initial distance of 6.8 Å (3′OH to Oδ1) in the TMP ADP complex to 3.7 Å in the Ap5dT complex. These changes are driven by hydrogen bonds between Asp15 on the P-loop and the side chains of Gln157 on α7 and Arg97 in the nucleoside monophosphate binding site. These interactions are important for catalytic proficiency because mutation of Asp15 to Ala, Asn, or Glu results in an inactive enzyme.9,17 The shorter LID sequence in eukaryotic type I TMPKs does not contain the arginine that directly interacts with the phosphates of ATP as found in type II TMPKs.8,18 This suggests that the coordinated motions of the P-loop, A-loop, and LID that are unique to type I TMPKs compensate for the reduction in size and lack of a phosphate interacting partner in the shortened LID.
There is considerable interest in the structure and dynamics of hTMPK from a therapeutic perspective. hTMPK has shown promise as a potential anticancer target as its inhibition in LKB1-mutant lung cancer cells is lethal.19 Combined inhibition of hTMPK and treatment with doxorubicin impairs DNA repair and reduced tumor cell growth both in vitro and in vivo.20,21 In addition to its potential role in cancer treatment, hTMPK catalyzes the rate-limiting step for the activation of antiretroviral thymidine analogue prodrug 3′-azido-3′-deoxythymidine (AZT or zidovudine). The 70-fold slower conversion of 3′-azidothymidine-5′-monophosphate (AZTMP) by the human enzyme results in a buildup of the toxic monophosphate form of AZT (see Table 1).22−25
Table 1. Kinetic Parameters for WT and F105Y hTMPK with TMP and AZTMP31.
| protein–ligand | kCAT (s–1) | Km (μM) |
|---|---|---|
| WT–TMP | 0.73 | 6.3 |
| WT–AZTMP | 0.012 | 12 |
| F105Y–TMP | 0.17 | 4.2 |
| F105Y–AZTMP | 0.25 | 3.8 |
X-ray-derived structures of the wild-type (WT) enzyme in complex with ADP and TMP or AZTMP show very few differences. Differences between the TMP and AZTMP complexes are seen for the catalytically important partially closed state that occurs when TMP and AppNHp are bound in the active site. In the case of TMP, the P-loop is drawn closer to the NMP-binding site because of the formation of a hydrogen bond between Asp15HN and Gln157Oε1. This hydrogen bond does not occur in the WT complex with AZTMP and AppNHp.9,26 Thus, the low activity toward AZTMP has been attributed to the presence of the bulky azido group that blocks the approach of the P-loop to TMP during catalysis. This hypothesis was supported by structures of hTMPK in the complex with a bisubstrate inhibitor, where the distance between the Asp15Cγ and C3′ on Ap5dT is 4.2 Å, while this distance is 6.7 Å in the Ap5AZT complex. Structures of hTMPK with various TMP-analogue prodrugs have shown that the presence of a hydrogen bond donor at the 3′ position of TMP also helps to stabilize the closed conformation.27
The TMPK from yeast (Saccharomyces cerevisiae, ScTMPK), a type I TMPK, also shows low activity toward AZTMP, with a kCAT of 0.175 s–,1 which is 200-fold lower than the activity toward dTMP (35 s–1).8 In contrast to type I TMPKs, the type II TMPK from Escherichia coli shows a kCAT of 6 s–1 toward AZTMP, which is only 40% lower than the kCAT toward dTMP (15 s–1).28 The crystal structure of the E. coli enzyme in the presence of AZTMP indicates that the type II TMPK can accommodate the 3′ azido group without significant distortion of the active site29 because of an alternate interaction with the bound TMP that involves Glu12 on the P-loop instead of Asp15. The enhanced activity of the E. coli enzyme toward AZTMP led Brundiers et al. to develop a number of yeast-E. coli chimeric TMPKs that showed enhanced activity toward AZTMP.17 Changes that enhanced the activity of the yeast enzyme were also applied to the human enzyme, resulting in a similar increase in activity toward AZTMP. To further increase the activity of the chimeric hTMPK enzymes, Brundiers also altered residue 105 in hTMPK from Phe to Tyr, based on the fact that a Tyr is found at this position in the yeast enzyme and most other TMPKs. Remarkably, they discovered that the Phe105Tyr mutation alone conferred a 20-fold increase in activity toward AZTMP, while only reducing activity toward the natural substrate (TMP) 4-fold (see Table 1).17 The preferential activity of F105Y toward AZTMP has been exploited as a suicide enzyme for gene therapy cancer treatments.30
X-ray crystallography studies have provided considerable detail regarding potential conformational changes during catalysis as well as information on the interaction of both the WT enzyme and the F105Y mutant with AZTMP. Crystallographic structures of F105Y hTMPK in complex with either TMP or AZTMP have shown that the mutation shifts the P-loop to a position that is similar to that found in the complex between Ap5dT and the WT enzyme. This shift is due, in part, to a new hydrogen bond between Tyr105OH and Asp15HN in the P-loop. It is inferred from these structures that the additional hydrogen bond between Tyr105OH and Asp15HN compensates for the steric clash of the sidechain of Asp15 and 3′N3 of AZTMP, and it has been suggested that this shift in the P-loop is the structural basis for the higher activity toward AZTMP.26 However, the approach of the sidechain of Asp15 to the TMP 3′OH would still be blocked by the azido group when AZTMP is used as the substrate. Unfortunately, the structure of the F105Y protein complexed with either AZTMP and AppNHp, or Ap5AZT, has not been reported; thus, it is not possible to determine what potential changes might occur in the structure as the AZTMP ATP complex approaches the transition state. Consequently, it is still not clear why the F105Y mutant is so proficient at phosphorylating AZTMP. Clearly, the dynamics of these important loops play a critical role in transitioning to the catalytically active “P-loop closed” state.
Here, we employ spin-relaxation and methyl relaxation dispersion (RD) experiments to better understand the dynamical implications of the 3′-azido group of AZTMP and putative stabilizing effects of the F105Y mutant over multiple time scales. Similar RD studies on AMPK confirmed previous biochemical work32−35 and showed that the rate limiting step (product release) was due to opening of the lid.32 Remarkably, the catalytic rate of AMPK can be tuned by mutations33,36 or solvent conditions33 that affected loop dynamics.
We show that AZTMP affects ADP binding in the WT enzyme, leading to destabilization of the closed conformation for the LID and the P-loop. In addition, we show that the μs to ms dynamics near critical active site residues are highly perturbed in WT hTMPK when bound to AZTMP, while in the F105Y mutant–AZTMP complex, this region is stabilized and has similar properties as the WT–TMP complex, explaining the ability of F105Y hTMPK to effectively phosphorylate AZTMP by the appropriate tuning of the protein dynamics.
Results
WT and F105Y hTMPK Have the Same Average Solution Structure
The 1H–13C HMQC spectra of WT and F105Y hTMPK bound to either TMP and ADP (Figure 2) or AZTMP and ADP (Figure S4) show few chemical shift perturbations (CSPs), as anticipated from the similarities in the crystal structures of the four complexes. Although Val14 in the P-loop adopts different positions in the crystal structures, it has the same shift in all complexes, suggesting the same average solution structure. Leu57δ1/δ2, Leu161δ1, and Leu167δ1 show the largest but still modest, CSPs. These residues are proximal to the NMP-binding site and likely reflect local minor structural changes required to accommodate the Phe → Tyr mutation (Figure 2, inset). Moreover, 1H–13C HMQC spectra of WT and F105Y hTMPK bound to the bisubstrate inhibitor Ap5dT are essentially identical to their TMP ADP counterparts (Figure S4). The largest CSP between the Ap5dT complex and the TMP or AZTMP complexes is seen for I184δ1 (0.05 ppm 1H). The lack of significant CSPs in the spectra of the different protein–ligand combinations suggests they all adopt the same average structure in solution.
Figure 2.

Overlay of WT and F105Y hTMPK bound to TMP and ADP 1H–13C HMQC spectra. WT (black) and F105Y (red) spectra have few CSPs (cyan arrows). The inset shows the location of residues with large (red spheres) and small CSPs (pink spheres) in the structure. Largest CSP was associated with L161R (1H CSP = 0.035 ppm and 13C CSP = 0.08 ppm). Stereochemistry indicated by R and S; R indicates γ1 (Val) or δ1 (Leu), and S indicates γ2 (Val) or δ2 (Leu).
These spectra clearly indicate that there are changes in the dynamics of the enzyme because of replacement of Phe105 with Tyr. Notably, Figure 2 shows that Ile49δ1 is exchange broadened in WT spectra but appears in F105Y spectra. This is quite remarkable because Ile49 is located at the interface between the two subunits and is 16 Å removed from the site of the mutation, suggesting that stabilization of the protein by the F105Y mutation alters the intersubunit dynamics. Similar effects are seen with the bisubstrate inhibitor Ap5dT, where the resonances from Ile49 and Ile184 are broader in the WT spectrum (Figure S4). The chemical shift of Ile184 is altered by 0.05 ppm in the Ap5dT spectra, suggesting that the position of the adenine ring in the TMP ADP complex is slightly different than in the Ap5dT complex; equivalent shifts would be predicted from the crystallographic structures.
F105Y hTMPK Has Altered ADP Binding Affinity and Kinetics
To ensure that the WT and F105Y complexes were saturated with ADP for the Carr–Purcell–Meiboom–Gill (CPMG) measurements, we directly measured the binding constants for ADP in the presence of either TMP or AZTMP. This was achieved by two-dimensional lineshape fitting of resonance lines with CSPs from a series of 1H–13C HMQC spectra with increasing concentrations of ADP titrated into WT or F105Y hTMPK bound to either TMP or AZTMP (Table 2). The KD is not dependent on the identity of the ligand in the NMP site; however, F105Y hTMPK has a 2.5-fold higher affinity for ADP than WT. Interestingly, the koff is ligand dependent for both proteins, with AZTMP showing a 2-fold faster off-rate with the WT protein and a 15-fold reduced off-rate in the case of F105Y–AZTMP. The faster off-rate of AZTMP from the WT enzyme may reflect the unfavorable interaction between the 3′-azido group and Asp15 on the P-loop.26 The off-rate of AZTMP from F105Y is similar to the catalytic rate (0.25 s–1, Table 1), suggesting that product release may be rate-limiting.
Table 2. ADP Binding Constants Determined by Fitting to Two-Dimensional Lineshapes.
| protein–ligand | KD (μM) | koff (s–1) |
|---|---|---|
| WT–TMP | 15 ± 2.1 | 12 ± 0.7 |
| WT–AZTMP | 15 ± 1.3 | 24 ± 0.8 |
| F105Y–TMP | 4.2 ± 1.3 | 2.7 ± 0.8 |
| F105Y–AZTMP | 4.4 ± 1.7 | 0.20 ± 0.9 |
Ile184 Is a Sensitive Probe of ADP Saturation and Dynamics
Ile184δ1 undergoes a dramatic 1H CSP of 0.72 ppm upon addition of ADP to hTMPK bound to either TMP or AZTMP (see Figure 3A). This can be attributed to the ring current shift experienced by Ile184,38 which is in close proximity to the aromatic adenine ring of ADP (Figure 3B). RD measurements for WT hTMPK with bound AZTMP at two concentrations of ADP illustrate the high sensitivity of RD to identify sparsely populated states. Because of the large Δω between the ADP-bound and ADP-free states, Rex (=papbΔω2/kex) shows a marked increase as the population of the free state, pb, increases at the lower ADP concentration. The two Ile184δ1 dispersion curves (Figure 3C) for ADP concentrations of 2 and 8 mM result in fitted exchange parameters describing two different processes (Table 3).
Figure 3.

Ile184δ1 is sensitive to adenosine nucleotide saturation. (A) Overlay of spectra of WT hTMPK bound to TMP (black) and TMP and ADP (red) results in a 1H CSP of 0.72 ppm. (B) Interaction of Ile184 with the adenine ring of ADP causes a ring current shift. (C) Dispersion curves (850 MHz) for WT hTMPK bound to TMP (red curves) or AZTMP (blue curves) at two different concentrations of ADP (2 mM lighter; 8 mM darker). R20 is subtracted from the data, normalizing the curve to 0 to facilitate comparisons.
Table 3. Effect of ADP Concentration on Exchange Parameters for WT Ile184δ1.
| protein–ligand | kex (s–1) | pa (%) | Δω (ppm) | φex (rad2·s–2) | R20 (s–1) | χ2N |
|---|---|---|---|---|---|---|
| WT–TMP–2 mM ADP | 4000 ± 440 | 18,000 ± 6100 | 12 ± 0.39 | 2.9 | ||
| WT–TMP–8 mM ADP | 1300 ± 240 | 2400 ± 560 | 13 ± 0.12 | 2.2 | ||
| WT–AZTMP–2 mM ADPa | 2200 ± 360 | 98.6 ± 0.08 | 0.620 ± 0.014 | 14.7 ± 1.5 | 4.2 | |
| WT–AZTMP–8 mM ADP | 3800 ± 100 | 56,000 ± 2000 | 13 ± 0.13 | 6.9 |
Fit to the full model, eq S2. Fitted parameters for F105Y are omitted here because there is essentially no exchange in either the TMP or AZTMP complex, regardless of the concentration of ADP. This is due to the smaller KD for the binding of ADP to the F105Y protein, leading to full saturation.
Because Ile184δ1 is in slow exchange in the WT–AZTMP 2 mM ADP complex, its dispersion curve could be reliably fit to separate pa and Δω, allowing for a comparison to the observed CSP for ADP binding and the binding parameters obtained from the ADP titration. The fitted Ile184δ1 Δω of 0.62 ± 0.02 ppm with 2 mM ADP bound (Table 3) is consistent with the observed CSP of 0.72 ppm, while the Δω of 0.35 ± 0.05 ppm with 8 mM ADP when fit to the full model (not shown) is not consistent. Likewise, the pa of 98.6 ± 0.08% for the WT–AZTMP 2 mM ADP complex is in close agreement with the theoretical fractional saturation of 98.8% (see Supporting Information). Additionally, pa and kex allow for an estimate of 17 ± 4.0 μM for KD and 31 ± 5.1 s–1 for koff (see Supporting Information), which are consistent with the KD of 15 ± 1 μM and koff of 24 ± 0.8 s–1, respectively, that were obtained directly from the ADP titration experiment.
AZTMP and the F105Y Mutant Alter the Dynamics of the ATP-Binding Site
We were able to probe dynamics at the adenine ring with Ile184 and dynamics near the phosphate groups of ADP with Val14, Leu137, and Leu161. In order to capture relevant motions contributing to ligand-induced conformational change of the P-loop, LID, and A-loop on the μs to ms timescale, it is critical to ensure that contributions to Rex from ligand exchange with the free pool is effectively zero. For the following, we limit our discussion to complexes with 8 mM ADP to ensure saturating conditions of ADP and dispersion measurements, which report on internal dynamics of the protein and not simply ADP exchange.
RD of Ile184 shows that the adenine ring is effectively static on the μs to ms timescale in the F105Y complex with either TMP or AZTMP bound. At an ADP concentration of 2 mM (not shown) or 8 mM (Figure 4A), both F105Y–TMP and F105Y–AZTMP showed a Rex ≈ 0 and could not be reliably fit to an exchange model, suggesting that there is no exchange process for Ile184δ1 in F105Y. In contrast, both WT complexes undergo a fast exchange process, even when saturated with ADP. This process is approximately 3-fold faster in WT–AZTMP with a 20-fold increase in φex (Table 3), indicating significant motion of the adenine ring in the WT–AZTMP complex. This change is likely due to changes in both pb and Δω to account for the large increase in φex.
Figure 4.
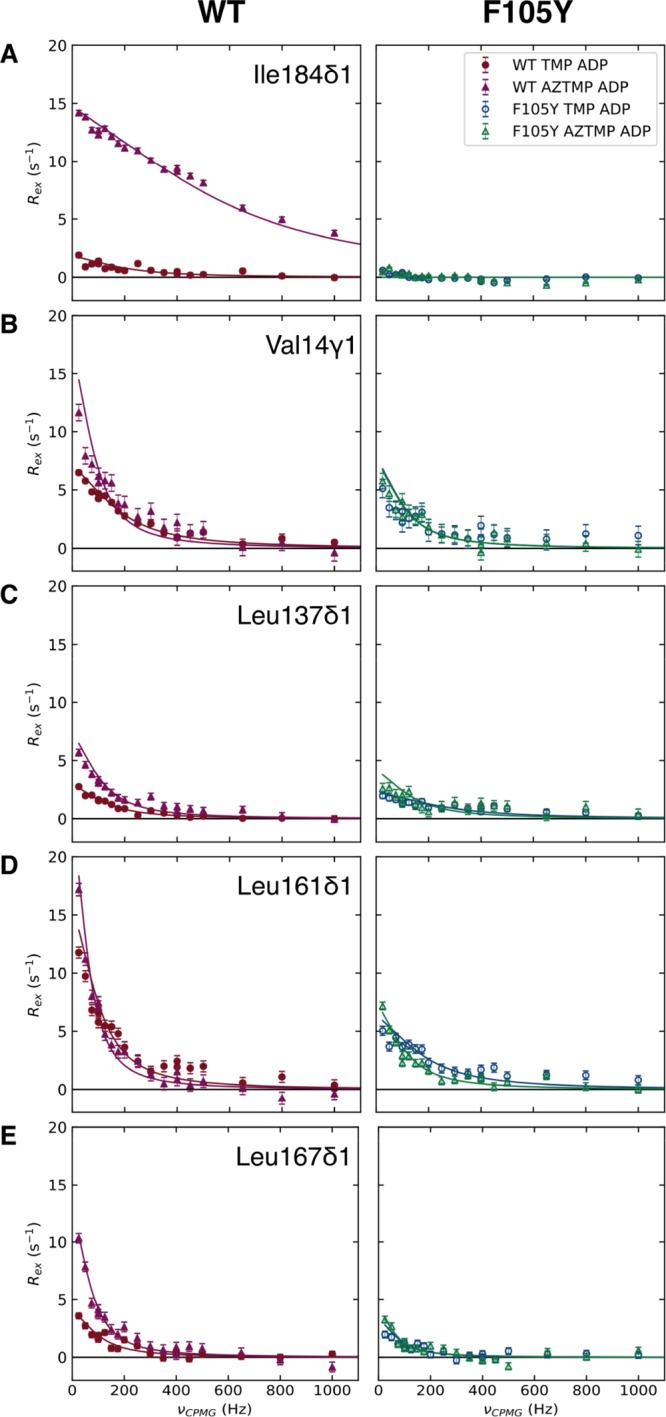
850 MHz dispersion curves for residues near the ATP-binding site. (Left) WT complexes with TMP ADP (circles) and AZTMP ADP (triangles). (Right) F105Y complexes with TMP ADP (open circles) and AZTMP ADP (open triangles). Rows A−E correspond to Ile184δ1, Val14γ1, leu137δ1, Leu161δ1, and Leu167δ1, respectively. Solid lines represent a best fit to the fast exchange model (eq 1) for all residues except F105Y Ile184δ1 which were fit to a “no exchange” model, i.e., a straight line at R20. R2 is subtracted from the data, normalizing the curve to 0 to facilitate comparisons. WT-AZTMP ADP shows increases to Rex across all of these residues, but F105Y-AZTMP does not.
Val14, Leu137, and Leu161 are in close contact in the closed form of the enzyme, bringing together the P-loop, LID, and α7 in the NMP binding site. These three methyl groups serve as ideal probes to monitor changes to these regions involved in the shift from the “P-loop open” to the active “P-loop closed” conformations. The dispersion curves show (i) WT–AZTMP has increased Rex compared to WT–TMP, (ii) F105Y–AZTMP has a slightly reduced Rex, and (iii) F105Y–TMP has a similar or lower Rex than F105Y–AZTMP. The fitted parameters, summarized in Table 4 (upper section), show a general trend in that the exchange rates for WT–TMP and WT–AZTMP are equivalent or higher than F105Y, and φex is larger for the WT protein.
Table 4. Exchange Parameters for Val14γ1, Leu137δ1, Leu161δ, Leu167δ1, Val10γ2, and Val95γ2a.
| WT-TMP |
WT-AZTMP |
F105Y-TMP |
F105Y-AZTMP |
|||||
|---|---|---|---|---|---|---|---|---|
| kex (s–1) | φex (rad2·s–2) | kex (s–1) | φex (rad2·s–2) | kex (s–1) | φex (rad2·s–2) | kex (s–1) | φex (rad2·s–2) | |
| Val14γ1 | 1200 ± 56 | 8600 ± 340 | 590 ± 110 | 10,000 ± 710 | 730 ± 72 | 5700 ± 360 | 740 ± 58 | 5600 ± 280 |
| Leu137δ1 | 880 ± 48 | 2600 ± 70 | 730 ± 150 | 5500 ± 620 | 1700 ± 270 | 4000 ± 640 | 910 ± 140 | 3900 ± 440 |
| Leu161δ1 | 700 ± 33 | 11,000 ± 340 | 430 ± 54 | 10,000 ± 310 | 1200 ± 120 | 7900 ± 570 | 730 ± 110 | 5600 ± 610 |
| Leu167δ1 | 690 ± 92 | 2900 ± 220 | 500 ± 34 | 6500 ± 190 | 540 ± 130 | 1800 ± 250 | 460 ± 52 | 2000 ± 300 |
| Val10γ2 | 590 ± 38 | 16,000 ± 350 | 1200 ± 72 | 17,000 ± 820 | 500 ± 38 | 11,000 ± 440 | 590 ± 57 | 13,000 ± 470 |
| Val95γ2 | 500 ± 29 | 11,000 ± 340 | 780 ± 64 | 9100 ± 540 | 430 ± 49 | 9000 ± 410 | 610 ± 59 | 10,000 ± 480 |
Fitted values for Ro and the reduced χ2 for each of these methyl groups can be found in Supporting Information Tables S1–S3 for Val10, Val14, and Val95, and Tables S4–S6 for Leu137, Leu161, and Leu167.
The dynamics of the P-loop, as reported by Val14γ1, are related to the catalytic efficiency of each complex. The kex in the WT–TMP–ADP complex is largest with the F105Y complexes being almost halved (Figure 4B). Notably, both F105Y complexes were fit to nearly the same exchange rate. The least efficient complex, WT–AZTMP, shows a lower exchange rate and a higher value of φex, suggesting a higher occupancy of an unproductive state. The φex values for WT–TMP and WT–AZTMP are approximately double of those seen for the F105Y, indicating that the F105Y mutation likely reduces the population of the minor state (Table 4).
Dynamics of the LID region is probed by Leu137, which is contained in the α6. The 2-fold increase in φex for Leu137δ1 in the WT–AZTMP complex versus the WT–TMP complex suggest some destabilization of the LID in WT–AZTMP (Table 4, upper section). Also, the kex for F105Y–TMP is notably higher than the other complexes pointing toward a more rapid interconversion between the major and minor conformers. The exchange rate of F105Y–AZTMP is similar to that of WT–TMP.
The dynamics of the helix that follows the disordered portion of the LID (α7), as reported by Leu161δ1, show a similar trend as Leu137δ1, in that, the exchange rate of the F105Y–TMP complex is higher than the other three complexes (Table 4, upper section). The reduced kex for WT–AZTMP may reflect the unfavorable transition to the closed conformation. Also, the φex is distinct between the mutant and WT protein with a slight increase for the F105Y–TMP complex.
Leu167δ1, positioned at the C-terminal end of α7, is fit to a similar kex for all four complexes. WT–AZTMP has a 2-fold increase in φex compared to WT–TMP. The φex for both F105Y–TMP and F105Y–AZTMP is more similar to WT–TMP, meaning this dynamical perturbation is unique to WT–AZTMP (Table 4, middle).
WT–AZTMP has Altered Dynamics Near the Catalytic Center
Exchange properties for Val10γ2 and Val95γ2 reveal another region of the protein affected by the ligand bound in the NMP site and the F105Y mutation, the interior β-sheet. Val10 and Val95 are situated on adjacent β-strands (β1 and β3, respectively) at the interface between the P-loop and the catalytically important DRX motif (Figure 5E).9,14 In contrast to the residues near the ATP-binding site, this pair shows a reduced Rex for WT–AZTMP, increased Rex for WT–TMP, and an intermediate Rex for both F105Y complexes (Figure 5A). The WT–TMP, F105Y–TMP, and F105Y–AZTMP complexes all show essentially the same kex of ∼550 s–1 for both residues. In contrast, the WT–AZTMP complex has an increased kex for both residues.
Figure 5.

Active site dynamics of WT hTMPK are perturbed by AZTMP. Panels (A–D) show 850 MHz dispersion curves for WT complexes with TMP ADP (circles) and AZTMP ADP (triangles) (panels A,C). F105Y complexes with TMP ADP (circles) and AZTMP ADP (triangles) (panels B,D). Data from Val10γ2 is given in panels (A,B) and data from Val95γ2 is given in panels (C,D). R20 is subtracted from the data, normalizing the curve to 0 to facilitate comparisons. F105Y–AZTMP and WT–TMP curves and parameters the most similar, possibly explaining why both have higher catalytic rates. Panel (E) shows that Val10γ2 and Val95γ2 are directly beneath the catalytically important DRY (teal sticks) motif.
Interestingly, for Val95γ2, WT–TMP and F105Y–AZTMP have nearly identical exchange parameters, while for both WT–AZTMP and F105Y–TMP, the substrates with reduced catalytic rate, show larger and smaller values for kex, respectively (Table 4, lower section). The exchange rates for Val10γ2 have a similar trend to Val95γ2 (Table 4, lower section).
Ap5dT Bound to WT hTMPK Shows a Dynamic Intermediate
Crystallographic structures have shown that the bisubstrate inhibitor Ap5dT induces the fully closed conformation in WT hTMPK.9 Our RD experiments show that WT hTMPK shows enhanced exchange in the presence of Ap5dT for residues in the LID region (Leu137δ1), A-loop (Ile184δ1), and the NMP-binding site (Leu161δ1, Leu167δ1) (see Figure S6), suggesting intrinsic motions in these regions may be important for formation of the transition state. The increase in exchange for these residues is attenuated in the F105Y–Ap5dT complex (Figure S6). A comparison of the exchange for WT–Ap5dT and F105Y–Ap5dT (Figure 6) shows that in all cases, the exchange for F105Y is reduced compared to the WT complex, and the differences between the two proteins is largest for residues in the P-loop (Val14), LID (Leu137), A-loop (Ile184), and the NMP-binding site (Leu161 and Leu167). For most residues, with the exception of Leu161, the kex was similar in both proteins and the WT–Ap5dT complex showed higher values of φex (Table S7).
Figure 6.

Ap5dT increases dynamics of WT enzyme for residues near the ATP-binding site. Dispersion curves acquired at 850 MHz are shown for the WT complexes with Ap5dT (brown squares) and the F105Y complex with Ap5dT (yellow open squares) for Val10γ2 (panel A), Val14γ1 (panel B), Val95γ2 (panel C), Leu137δ1 (panel D), Leu161δ1 (panel E), Leu167δ1 (panel F), and Ile184δ1 (panel G). R20 is subtracted from the data, normalizing the curve to 0 to facilitate comparisons. Note: the maximum of the y-axis is 50 s–1 for Ile184. Solid lines represent a best fit to the fast exchange model (eq 1) for all residues. A reduced population of the minor state in the F105Y complex reduces the Rex. Dynamical differences in the approach of F105Y hTMPK into the transition state may contribute to enzyme’s reduced activity with TMP.
WT and F105Y hTMPK Have Similar ps to ns Dynamics
The ps to ns dynamics of WT and F105Y hTMPK bound to ADP and either TMP or AZTMP were measured using 13C R1 and R1ρ relaxation experiments. The S2 values obtained from analysis of the R1 and R2 rates are largely similar for each of the four complexes (Figures 7 and S7). The nature of the bound ligand, TMP or AZTMP, does not affect the order parameters (Figure S7). This was expected as the R20 values fit from the RD experiments do not differ greatly between the four complexes (Tables S1–S6). The color mapping shown in Figure 7 illustrates the general summary that residues in the β-sheet below the active site are relatively rigid as is the P-loop near the terminal phosphate on ADP. The helix that is amino-terminal to the LID is mobile on the ps to ns time scale (S2 = 0.23 for Leu137). Unfortunately, there are no Ile, Leu, and Val (ILV) residues on the unstructured portion of the LID, preventing characterization of its motion.
Figure 7.

F105Y induced changes to ps to ns dynamics at the dimer interface. Panel (A) shows mapping of S2 order parameters onto the X-ray structure using a blue-to-red color map. Blue represents high order parameters, and red presents low order parameters. Val80γ2 (labeled, rendered in sticks and highlighted) shows an increased S2 for the F105Y mutant. Panel (B) shows a correlation plot of order parameters for WT and F105Y bound to AZTMP, and ADP shows significant differences in S2 for only Val80γ2.
Although the order parameters are similar between WT and F105Y, Val80γ2 has a higher S2 of 0.76 ± 0.01 in the F105Y–AZTMP complex as compared to 0.70 ± 0.03 in the WT–AZTMP complex (Figure 7). The enhanced ordering of Val80 is also seen in the TMP complex (see S8, panel C). This residue is at the dimer interface, and its restricted dynamics in the F105Y enzyme parallels our observations from Ile49, which also becomes less dynamic in the F105Y enzyme (see Figure 1). Changes in the dynamics of the protein due to replacement of Phe105 with Tyr are propagated to the dimer interface.
Discussion
Among TMPKs, hTMPK is a particularly slow enzyme with turnover rates nearly an order of magnitude below other eukaryotic counterparts,13 and it shows even poorer activity against AZTMP. The low activity toward AZTMP may be due to the presence of a Phe at position 105 because many microbial TMPKs that are adept at AZTMP phosphorylation have a tyrosine at position 105 (human numbering), which presumably performs the same function as stabilizing P-loop closure in F105Y hTMPK. However, the existence of a Tyr residue at position 105 does not automatically result in high activity toward AZTMP. While most TMPKs have a Tyr at this position, the ratio of kCATAZTMP/kCAT is quite variable among different TMPKs. For example, the TMPKs from E. coli and Yersinia pestis both containing a Tyr residue at 108 (E. coli numbering), show 71% sequence identity, yet show a ratio of kCATAZTMP/kCAT of 0.16 versus 0.01, respectively.39 Consequently, the ability of the single change of F105Y to greatly enhance the activity of hTMPK toward AZTMP appears to be unique and not solely due to the additional OH group that is added when Phe105 is altered to Tyr.
Dynamical Not Structural Perturbations Explain Differences in AZTMP Phosphorylation
ScTMPK which has been cocrystallized with TMP alone shows the highly conserved Asp15 on the P-loop contacts Arg97 and the 3′OH of TMP, forming the so-called “P-loop closed” conformation and suggesting that even in the absence of ATP, the enzyme exchanges between the open and closed states. Cocrystallization of the yeast enzyme with Ap5dT induces shifts similar to those seen in hTMPK bound to Ap5dT with movements in the A-loop and ordering of the LID, which is disordered in the TMP-bound structure. Thus, the biasing toward P-loop closure by F105Y hTMPK may be an artifact observable only at cryogenic temperatures in the crystalline lattice. Indeed, our higher temperature nuclear magnetic resonance (NMR) spectra contain few CSPs in the P-loop, A-loop, and LID, suggesting no difference in the average solution structure. Similarly, the dynamics of these complexes show no major differences on the ps to ns time scale, suggesting slower processes such as larger domain motions may be responsible for catalytic differences.
Differences on the μs to ms time scale due to transition between the open and closed conformation were revealed by methyl RD experiments as dynamical perturbations to the residues on the P-loop (Val14), LID (Leu137), and α7 near the active site (Leu161). Our overall framework for analysis is that the excited state is the closed form of the enzyme. In the case of the WT enzyme complexed with AZTMP, the dynamic properties of this structure is not conducive to phosphate transfer, while in the case of the F105Y enzyme, the dynamics are tuned in such a way that the enzyme can facilitate phosphate transfer in a similar fashion to the tuning of AMPK activity by changes in the dynamics of structural elements in that protein.33,36
The dynamics of Val14γ1 partially explains previous crystallographic and kinetic data. Because the φex values are similar for both WT–TMP and WT–AZTMP (8600 vs 10,000), it is reasonable to assume the same motion is captured in both complexes. The exchange rate is halved for WT–AZTMP, dropping from 1200 to 590 s–1, indicating that AZTMP blocks the approach of the P-loop toward the NMP-site, the “P-loop closed” excited state. Both F105Y–TMP and F105Y–AZTMP have nearly identical exchange rates of 730 and 740 s–1, both of which are faster than WT–AZTMP. This is taken to show that the F105Y mutation allows the enzyme to access a closed form regardless of the substrate in the NMP site. The modest decrease in φex and kex in the F105Y complexes reflects the reduced population and exchange to the closed state, which may explain the overall reduced activity of the mutant.
Leu137δ1 and Leu161δ1 report on helical movements near the active site and show distinct dynamics, which are both ligand and protein dependent. We suggest that these residues, situated at the interface of the ATP- and NMP-binding sites, are sensitive to P-loop closure. The exchange rate for WT–AZTMP is reduced relative to WT–TMP, while the rate for F105Y–TMP is somewhat faster. Interestingly, the exchange rates for WT–TMP and F105Y–AZTMP are similar, suggesting a requirement for a particular frequency for efficient catalysis.
The exchange parameters for Val95γ2, a residue adjacent to the critical DRX motif (residues 96–98), are also indicative of dynamical perturbations related to the catalytic rate. The WT–AZTMP complex has a 1.5-fold increased kex value for both Val10γ2 and Val95γ2, while the more catalytically competent complexes have kex more similar to WT–TMP, including Ap5dT, which should closely approximate the transition state.9,40 We take this to suggest that AZTMP has a deleterious effect on the dynamics of Arg97 in the DRX motif, possibly by preventing the 2.1 Å swing of Asp15 into the NMP-binding site. The increased exchange rates may represent Arg97 moving unproductively in the WT–AZTMP complex, while in the other complexes, it is partially held in place by the availability of surrounding interacting partners. The F105Y complexes appear to be more rigid in the ATP-binding site, allowing Asp15 to interact with Arg97, stabilizing the active site by assuming the excited closed state.
The appearance of Ile49δ1 in the Ap5dT 1H–13C HMQC spectra may report on the dynamics of the NMP-site in the catalytically productive state. Ile49 resides at the dimer interface proximal to Arg45, which interacts with the α-phosphate of the TMP, possibly reporting on intersubunit communication between the adjacent NMP-sites or an active conformation for Arg45 (Figure 8). Likewise, appearance of this resonance in the spectra of F105Y may indicate the stabilization of this same state. It has been shown using a chemical biology approach that the rotation of the α-phosphate away from Arg97 and toward Arg45 is required for efficient catalysis of ribose-modified TMP nucleotides.27 The effect of the transition state complex Ap5dT on the dynamics of the WT enzyme shows increased exchange for Leu137δ1 and Leu161δ1 when compared to the TMP complex (Figure S6). In contrast, these two residues show similar exchange rates for the F105Y mutant, suggesting that the stabilizing effect of Tyr105 extends to Ile49 via Arg45.
Figure 8.

Reduction in exchange of Ile49 in F105Y is due to the stabilization of Arg45 in the closed complex. Guanidino group of Arg45 interacts with the α-phosphate of dTMP and Glu149 in the LID. This interaction also stabilizes Leu 137δ1 (not shown) and Leu161δ.
If P-loop closure alone was the rate-limiting step in catalysis, then we would expect an increase in kex for Val14γ1 in F105Y–AZTMP versus WT–AZTMP that is consistent with the 20-fold difference in their catalytic rates. However, a mere 1.5-fold increase is observed. This and other more widespread dynamical perturbations suggest a more nuanced mechanism. This leads us to suggest a tuning model for efficient phosphorylation of AZTMP by F105Y hTMPK. AZTMP is destabilizing to the active site of the enzyme, where the F105Y mutation is overly stabilizing, leading to a decrease in the catalytic rate with TMP. Both of these effects combined counterbalance the instability caused by AZTMP with conformational exchange occurring on approximately the same timescale in F105Y–AZTMP as WT–TMP.
Not all regions of the protein have their dynamics affected by the mutation or different sets of ligands. Leu167δ1 is located at the base of α6, and its exchange rates are similar for all four complexes, suggesting it is monitoring a motion that is unrelated to the catalytic cycle. A number of residues do not seem to show conformational exchange in any of the four (WT or F105Y with TMP or AZTMP) complexes discussed here. These residues are mostly located in the hydrophobic core, distal from the active site (Figure S5). Interestingly, Val94γ2, which resides on the opposite side of the β-sheet from Val95γ2, does not show exchange despite being so close in sequence. This suggests that dynamical perturbations are local to the ligand binding and catalytic domains and reinforces the fact that the average solution structures of the complexes studied here are the same.
AZTMP Affects Adenosine Nucleotide Handling in WT hTMPK
Because of the large ring current effect, Ile184δ1 serves as a powerful probe of ADP saturation and adenosine ring dynamics. The presence of a fast exchange process under saturating conditions of ADP suggests that the adenine ring is mobile within the WT enzyme. The WT–AZTMP complex has a 3-fold increase in kex and a 20-fold increase in φex, suggesting the adenine ring is quite mobile compared to the WT–TMP complex. In addition to Ile184, the adenine ring is held in place by a cation−π interaction with Arg143 in the LID on the C-terminal end of α6, which contains Leu137 (see Figure 9). This leucine shows an increased φex in WT–AZTMP, consistent with a dynamical perturbation in this region that may be mediated by Arg143. It is clear from both the RD parameters and 2-fold increase in koff for ADP with AZTMP bound, that ADP handling is different in the WT–AZTMP complex than in the TMP complex. This may involve a disruption in communication between these regions that is mediated by the guanidinium group of Arg143, which interacts with the adenine ring and 2 hydrogen bonds to the backbone carbonyls of Arg16 (P-loop) and Ala180 (A-loop) (Figure 9). Likewise, perturbations to P-loop dynamics may propagate to the LID through the sidechain of Arg16. It is important to note that these differences could be observed even without the presence of a γ-phosphate, as it seems this was required in the crystallographic data.
Figure 9.

Dynamic events in the Adenosine-binding site are propagated to nearby residues by the Arg143 guanidino–adenine interactions.
Catalytic Rate of F105Y hTMPK Is Reduced Because of Altered ADP Binding and Transition State Dynamics
While the F105Y mutant is supposedly predisposed to enter the catalytically active “P-loop closed” state, it does have a four-fold reduced catalytic rate for TMP phosphorylation. The ADP titration suggests that F105Y hTMPK has increased affinity for ADP, and Ile184δ1 shows no exchange for both 2 and 8 mM samples of either F105Y complex. Human TMPK has been shown to follow a random bi–bi mechanism suggesting that the order of product release is random; however, a recent random accelerated molecular dynamics study of WT hTMPK suggests that TDP release pathways are largely biased toward the residues immediately following α6 in the LID whether or not ADP had already dissociated.41 This suggests slower ADP release may be responsible for some loss in activity of the F105Y enzyme. This region is stabilized in the F105Y complexes, as reported on by Leu137δ1.
A second mechanism for loss of activity is indicated by the exchange parameters for the F105Y Ap5dT complex, which show a reduced population of the minor state across the residues in the ATP-binding site (Val14, Leu137, Leu161, and Ile184) as compared to WT. Because Ap5dT induces the closed form of the enzyme, we assign the excited state to a previously uncharacterized catalytically required intermediate. Because the F105Y mutation reduces conformational motion in the ATP-binding site, it is less favorable to encounter this intermediate, resulting in a reduced catalytic rate. The combined effects of slow product release and a less populated active state may explain the loss in activity for F105Y hTMPK.
Conclusions
Despite minor structural differences between WT hTMPK bound to either TMP or AZTMP and ADP from crystallography and 2D NMR spectra, it is clear that these complexes show significant differences in dynamics on the μs to ms time scale. CPMG-RD techniques reveal that AZTMP induces widespread dynamical perturbations to the P-loop, LID, and at the catalytically important DRX motif. These perturbations likely stem from, but are not limited to, the steric clash between the 3′-azido group of AZTMP and Asp15, preventing its formation of hydrogen bonds with Arg97 of the DRX motif and also with Gln157 on α7. The F105Y mutation is able to overcome this steric clash by effectively pinning the P-loop to the NMP-binding site. This reduces conformational dynamics in the ATP-binding site, resulting in increased affinity for the product ADP. The high activity of F105Y hTMPK toward AZTMP stems from proper tuning of the dynamics of the active site in the AZTMP complex, which mimics the WT–TMP complex and predisposes Arg45 and Arg97 into the catalytically active positions. However, in the F105Y Ap5dT complex, a global reduction in the excited state may explain the reduced activity for TMP.
Our results with hTMPK illustrate that the importance of intrinsic motions of the enzyme to the catalytic mechanism of nucleotide kinases is not restricted to AMPK. As with AMPK,16,33,36 we have shown that the dynamic properties of the enzyme can be altered by a mutation, F105Y. We also have shown that catalysis can also be tuned by changes in the substrate, that is, AZTMP versus TMP. These insights into the intricate internal motions which dictate substrate specificity may serve as a guide for the future design of allosteric activators of hTMPK that would enhance metabolic AZT phosphorylation to increase the efficacy of AZT to act as an inhibitor of DNA polymerases. In addition, changes in dynamics may be important to consider in the design of inhibitors that would be useful in cancer chemotherapy. A better understanding of the human enzyme will also assist in the development of agents which are specific for antimalarial42 and antifungal43 thymidylate kinases.
Materials and Methods
Protein Expression, Purification, and Characterization
The synthetic gene codon-optimized for expression of the N-terminally (His)6 tagged protein in E. coli was obtained from ATUM and cloned into the pET22b(+) vector using the NdeI and XhoI sites. The protein was expressed in C3013 T7 Express lysY/lacIq E. coli cells (New England Biolabs).
The cells were grown in Luria-Bertani medium containing 100 mg/L ampicillin at 30 °C to an A600 of 0.8 and induced with 1 mM isopropyl β-d-thiogalactoside (IPTG) for 4 h. For specifically ILV-labeled proteins, cells were grown in Studier’s PG medium44 with 1,2,3,4,5,6,6-d7d-glucose and ammonium-15N2 sulfate in 100% D2O. ILV precursors, 13CH3 or 13CHD2 α-ketoisovalerate (100 mg/L), and α-ketobutyrate (50 mg/L) were added 1 h prior to induction at an A600 of 1.6 with IPTG for 20 h.45 After harvesting, the cells were stored at −80 °C. The cell pellets were resuspended in lysis buffer (50 mM sodium phosphate, 300 mM sodium chloride, 10 mM imidazole, 20 mM MgCl2, 10% (w/v) glycerol, and 50 μM TMP, pH 7.4) and lysed by sonication. The lysate was centrifuged at 20,000g for 30 min at 4 °C. HisPur Cobalt Resin (Thermo Scientific) was added to the supernatant and mixed on an end-over-end rotator for 1 h. This supernatant/resin mix was poured into a gravity chromatography column to separate the resin from the flow-through. The resin was washed with three column volumes of wash buffer (50 mM sodium phosphate, 300 mM sodium chloride, and 10 mM imidazole, pH 7.4). The protein was then eluted with the elution buffer (50 mM sodium phosphate, 300 mM sodium chloride, and 500 mM imidazole, pH 7.4). The eluted protein was dialyzed against the cation exchange buffer (50 mM sodium phosphate, 50 mM sodium chloride, and 10 mM ethylenediaminetetraacetic acid, pH 7.0) and loaded on a SP Sephadex C-50 (Sigma) column equilibrated with the same buffer. The protein was eluted with a salt gradient (0.05–1.5 M NaCl) and concentrated. Average yields of 100 mg/L of culture were achieved.
Protein purity was assessed using sodium dodecyl sulfate-polyacrylamide gel electrophoresis or 2D-NMR spectroscopy, and samples were >95% pure. Activity toward dTMP and AZTMP was measured using a standard NADH coupled assay,46 and protein concentration was determined from A280 using an extinction coefficient of 26,470 M–1 cm–1, which was calculated from the sequence using the ProtParam utility on the ExPASy server.47 Measured values of kCAT for both the WT and F105Y enzymes were within 10% of values reported in the literature.
NMR Spectroscopy
1H–13C HMQC spectra were acquired on a 600 MHz Bruker AMX spectrometer equipped with a room temperature probe, 4D methyl HMQC-NOE-HMQC spectra were acquired on a 700 MHz Bruker-BioSpin Avance spectrometer equipped with a cryo-probe, and CHD2 methyl 1H CPMG experiments48 and CHD2 methyl 13C R1 and R1ρ(49) experiments were acquired on a 600 MHz Bruker AVIII spectrometer both equipped with a cryo-probe. All samples were prepared as 0.4–0.8 mM solutions of protein in the NMR buffer (20 mM MES, 150 mM NaCl, 10 mM MgCl2, 1 mM dithiothreitol, and 0.02% (w/v) NaN3, pH 6.9) dissolved in 100% D2O. TMP, AZTMP, and ADP at a concentration of 2 mM were added for HMQC, NOE, and R1 and R1ρ experiments. For the CPMG experiments, the concentration of ADP was raised to 8 mM to fully saturate the enzyme. A concentration of 0.84 mM Ap5dT was used for CPMG experiments. Spectra were taken at 34 °C. CHD2 methyl 1H CPMG was acquired with a Trelax (total time of the CPMG pulse train) of 40 ms and taken for ncyc (number of CPMG elements) of 1, 2, 3, 4, 4, 5, 6, 7, 8, 10, 12, 14, 16, 16, 18, 20, 26, 32, 40, and 78. CPMG data for TMP and AZTMP samples were acquired at 600 and 850 MHz. CPMG data for Ap5dT was acquired at 850 MHz. Several ncyc values were sampled twice to obtain an estimate of the experimental noise. All spectra were processed with NMRPipe and visualized with nmrDraw.50
Resonance Assignments
Ile (δ1), stereospecific Leu (δ1 and δ2), and Val (γ1 and γ2) assignments of the WT–TMP/ADP/Mg2+ complex were obtained by a combination of site-directed mutagenesis, pro-S labeling of LV methyl groups, and three (3D) and four-dimensional (4D) methyl–methyl NOE that resulted in self-consistent assignments. The assignment of Ile and Val methyl resonances greatly increased the information on dynamics because huTMPK only has 6 Ile residues.
Single-site (Ile → Val) mutations were generated in the WT protein for all Ile residues except Ile49. DNA primers for mutagenesis were obtained from IDT DNA, and mutations were generated using the QuickChange Kit (Agilent). The assignment of Ile49 in the F105Y spectra was confirmed by an Ile49 to Val mutation, which removed the peak from Ile49 from the F105Y spectrum. The ILV NMR spectra of these mutants were essentially the same as the parent protein (see Figure S1, panel K), with the exception of the loss of an Ile peak and the gain of two new Val peaks, indicating that the overall fold of the mutant protein was identical to the parent and therefore provided reliable information for Ile assignments. The assignment of Ile184 was also supported by its large chemical shift change because of the binding of ADP.
A number of Leu and Val residues (Val → Ala and Leu → Val) were also selected for mutagenesis to provide additional starting points for assignment using NOEs. The 1H–13C HMQC spectra of these mutant proteins showed a pair of missing resonances (Val) or the shift of two resonances from the Leu region to the Val region of the spectrum. NMR spectra of all of the mutants were essentially identical to the WT spectrum, with the exception of a missing peak corresponding to the altered residue (see Figure S1, panels (A–J)). The high similarity between the mutant and the WT spectra indicates that the mutation did not affect the overall structure of the protein such that the mutation provided reliable information for assignments.
The X-ray structures of the hTMPK in the complex with TMP and ADP (PDB 1E2G) permitted the use of NOE experiments to assign most of the ILV methyl peaks and confirm the peaks already assigned by mutagenesis. The 4D methyl HMQC-NOE-HMQC pulse program was obtained from Clore (http://spin.niddk.nih.gov/clore/Software/software.html).51 Two differently labeled ILV [13C]methyl-labeled samples were produced for the 4D NOE experiments. The first NOE sample was produced using 4-[13C]-α-ketobutyric acid (2-KB) and dimethyl[13C2]-α-ketoisovaleric acid as the precursors for ILV labeling.52 The precursor dimethyl[13C2]-α-ketoisovaleric acid introduces 13C into all LV methyl groups and gives a strong intraresidue NOE peak in the 4D NOE spectrum. This allowed identification of the methyl pairs for LV residues. The second sample was produced from precursors 2-KB and 3-methyl[13C]-3,4,4,4-[2H4]-α-ketoisovaleric acid. This resulted in LV side chains with 13CH3 and 12CD3 methyl groups. The NOE spectrum of this sample lacked the strong intraresidue peak and permitted detection of NOEs over longer distances because of the absence of transfer to the other methyl on the same residue. 4D NOE data at one mixing time along with the mutagenesis and specific labeling experiments were not enough to confidently assign some of the residues. In such cases, we relied on the dependence of NOE intensities on mixing time. A series of 3D methyl NOE experiments were acquired with different NOE mixing times (100–900 ms), and the experimental data were compared to the simulated data. This approach helped in resolving inconclusive assignments and reaffirmed previous assignments (see Figure S2).
Specific labeling of the pro-S methyl groups of Leu (δ2-CH3) and Val (γ2-CH3) was achieved by expressing the protein in the presence of 2-[13CH3]methyl-4-[2H3]acetolactate (NMR-Bio).53 The resulting methyl spectra consist of only the pro-S methyl peaks. Peaks that were not labeled using this protocol were identified as pro-R peaks (see Figure S3).
Measuring ADP Binding Affinity
A series of 1H–13C HMQC spectra were acquired for concentrations of ADP ranging from 0 to 2.4 ligand-to-protein ratio for WT or F105Y bound to either TMP or AZTMP. The concentration of the protein for the WT and F105Y samples were 0.8 and 0.4 mM, respectively. The concentration of TMP and AZTMP was 2 mM, giving greater than 98% saturation. It was not possible to measure the ADP binding in the absence of TMP or AZTMP because of protein instability.
Spectra were processed as above, except exponential line broadening was used instead of sine-bell apodization. The observed dissociation constant (KD) and off-rate (koff) for ADP with either TMP or AZTMP were determined using two-dimensional line fitting using the TITAN37 program, utilizing five resonance lines that moved upon addition of ADP (Leu161δ1, Ile184δ1, Ile191δ1, Ile199δ1, and Val193δ1) for each of the four samples. The simple 2-state binding model [P] + [L] ⇌ [PL] was chosen, and errors were estimated using the built-in bootstrap procedure in TITAN.
13C Relaxation Data Analysis
The 13C R1 and R1ρ relaxation rates were used to extract S2 order parameters for each of the ILV methyl groups using the method of Tugarinov and Kay.49 The anisotropic rotational diffusion tensor used in the calculations was obtained using HYDRONMR54 and the X-ray structure of hTMPK (PDB: 1e2d). The local proton concentration was calculated using an in-house R script. S2 order parameters were calculated using the 13C relaxation measurements, diffusion tensor, and proton concentration, using MATLAB scripts provided by Tugarinov.
RD Data Analysis
NMR spectra were processed without
linear prediction, and peak intensities were extracted using nmrPipe
and nmrDraw.50 Dispersion curves were produced
by calculating  and plotting against the rate
of refocusing
pulses, νCPMG = ncyc/Trelax, where R2,eff is the effective transverse relaxation rate, ncyc is the number of CPMG elements, Trelax is the total time of the relaxation delay, and I(0) and I(νCPMG) are
the intensities at a refocusing pulse rate of 0 and νCPMG, respectively. The rate of interconversion between states (kex), relative populations in each state (pa, pb), and the
difference in chemical shift between the two states (Δω)
were extracted from global fits of the data to either a model suitable
for spins in fast exchange55
and plotting against the rate
of refocusing
pulses, νCPMG = ncyc/Trelax, where R2,eff is the effective transverse relaxation rate, ncyc is the number of CPMG elements, Trelax is the total time of the relaxation delay, and I(0) and I(νCPMG) are
the intensities at a refocusing pulse rate of 0 and νCPMG, respectively. The rate of interconversion between states (kex), relative populations in each state (pa, pb), and the
difference in chemical shift between the two states (Δω)
were extracted from global fits of the data to either a model suitable
for spins in fast exchange55
| 1 |
or the equation that applies to all exchange rates56 (see Supporting Information), using an in-house Python program. Note, ΔR20 = R2A – R2B0 was assumed to be 0. In the case of fast exchange, a single parameter, φex was substituted for papbΔω2 in eq 1 because the relatively small difference in the magnetic field strengths does not permit a robust deconvolution of Δω from papb. The parameters kex, R2, and φex,(or pa and Δω in favorable cases) were determined using grid search with a grid size of 10 × 10 × 10 for fast exchange and 10 × 10 × 10 × 10 for the full model (eq S2). A single Δω was fit to curves from all fields and scaled by the ratio of the static fields. Goodness of fit was determined using the reduced χ2 statistic. Errors for the TMP and AZTMP datasets were estimated using a bootstrap method, where the dispersion curves were resampled with replacement to generate 100 artificial datasets and fit using the same grid search method as the real data. The errors for the Ap5dT data were estimated using a Monte Carlo method because data was acquired at one field (850 MHz). Artificial data sets were generated by adding normally distributed noise with a standard deviation equal to the propagated measurement error and residual from the fit to each of the data points. In both cases, 100 artificial data sets were fit using the same grid search method as the real data. Errors are presented as ±2 standard error from the mean.
Acknowledgments
NMR instrumentation at Carnegie Mellon University was partially supported by the NSF (CHE-0130903, CHE-1039870 and CHE-1726525). We would like to thank Virgil Simplaceanu, Mike Delk, and Tapas Mal for assistance with NMR.
Glossary
Abbreviations
- 2-KB
4-[13C]-α-ketobutyric acid
- AZT
3′-azido-3′-deoxythymidine
- AMPK
AMP kinase
- Ap5T
P1-(adenosine 5′)-P5-(thymidine-5′)-pentaphosphate
- AZTMP
AZT 5′ monophosphate
- CPMG
Carr–Purcell–Meiboom–Gill
- HMQC
heteronuclear multiple-quantum coherence
- IPTG
isopropyl β-d-thiogalactoside
- NMP
nucleotide monophosphate
- RD
relaxation dispersion
- TMPK
thymidylate kinase
- TMP
thymidine monophosphate
- TDP
thymidine diphosphate
Supporting Information Available
The Supporting Information is available free of charge at https://pubs.acs.org/doi/10.1021/acsomega.9b03766.
Complete equation for two-site chemical exchange, 13C–1H two-dimensional NMR spectra of mutant proteins for assignment, NOE spectra illustrating assignment approach with simulated NOEs, stereospecific assignments of proR and proS groups for Val and Leu residues, 13C–1H two-dimensional NMR spectra of Ap5dT complexes, RD plots for residues that do not show chemical exchange, RD plots comparing TMP versus Ap5dT complexes, correlated order parameter plots, fitted exchange parameters, and order parameters for assigned methyl groups (PDF)
Accession Codes
UniProt: P23919.
Funded by the Mellon College of Science.
The authors declare no competing financial interest.
Supplementary Material
References
- Reichard P. Interactions Between Deoxyribonucleotide and DNA Synthesis. Annu. Rev. Biochem. 1988, 57, 349–374. 10.1146/annurev.bi.57.070188.002025. [DOI] [PubMed] [Google Scholar]
- Jordan A.; Reichard P. Ribonucleotide Reductases. Annu. Rev. Biochem. 1998, 67, 71–98. 10.1146/annurev.biochem.67.1.71. [DOI] [PubMed] [Google Scholar]
- Huang S.-H.; Tang A.; Drisco B.; Zhang S.-Q.; Seeger R.; Li C.; Jong A. Human DTMP Kinase: Gene Expression and Enzymatic Activity Coinciding with Cell Cycle Progression and Cell Growth. DNA Cell Biol. 1994, 13, 461–471. 10.1089/dna.1994.13.461. [DOI] [PubMed] [Google Scholar]
- Ke P.-Y. Control of DTTP Pool Size by Anaphase Promoting Complex/Cyclosome Is Essential for the Maintenance of Genetic Stability. Genes Dev. 2005, 19, 1920–1933. 10.1101/gad.1322905. [DOI] [PMC free article] [PubMed] [Google Scholar]
- Hu C.-M.; Tsao N.; Wang Y.-T.; Chen Y.-J.; Chang Z.-F. Thymidylate Kinase Is Critical for DNA Repair via ATM-Dependent Tip60 Complex Formation. FASEB J. 2019, 33, 2017–2025. 10.1096/fj.201800856R. [DOI] [PubMed] [Google Scholar]
- Deville-Bonne D.; El Amri C.; Meyer P.; Chen Y.; Agrofoglio L. A.; Janin J. Human and Viral Nucleoside/Nucleotide Kinases Involved in Antiviral Drug Activation: Structural and Catalytic Properties. Antiviral Res. 2010, 86, 101–120. 10.1016/j.antiviral.2010.02.001. [DOI] [PubMed] [Google Scholar]
- Cui Q.; Shin W. S.; Luo Y.; Tian J.; Cui H.; Yin D. Thymidylate Kinase: An Old Topic Brings New Perspectives. Curr. Med. Chem. 2013, 20, 1286–1305. 10.2174/0929867311320100006. [DOI] [PubMed] [Google Scholar]
- Lavie A.; Konrad M.; Brundiers R.; Goody R. S.; Schlichting I.; Reinstein J. Crystal Structure of Yeast Thymidylate Kinase Complexed with the Bisubstrate Inhibitor P 1-(5′-Adenosyl) P5-(5′-Thymidyl) Pentaphosphate (TP5A) at 2.0 Å Resolution: Implications for Catalysis and AZT Activation. Biochemistry 1998, 37, 3677–3686. 10.1021/bi9720787. [DOI] [PubMed] [Google Scholar]
- Ostermann N.; Schlichting I.; Brundiers R.; Konrad M.; Reinstein J.; Veit T.; Goody R. S.; Lavie A. Insights into the Phosphoryltransfer Mechanism of Human Thymidylate Kinase Gained from Crystal Structures of Enzyme Complexes along the Reaction Coordinate. Structure 2000, 8, 629–642. 10.1016/s0969-2126(00)00149-0. [DOI] [PubMed] [Google Scholar]
- Li de la Sierra I.; Munier-Lehmann H.; Gilles A. M.; Bârzu O.; Delarue M. X-ray structure of TMP kinase from Mycobacterium tuberculosis complexed with TMP at 1.95 Å resolution. J. Mol. Biol. 2001, 311, 87–100. 10.1006/jmbi.2001.4843. [DOI] [PubMed] [Google Scholar]
- Caillat C.; Topalis D.; Agrofoglio L. A.; Pochet S.; Balzarini J.; Deville-Bonne D.; Meyer P. Crystal Structure of Poxvirus Thymidylate Kinase: An Unexpected Dimerization Has Implications for Antiviral Therapy. Proc. Natl. Acad. Sci. 2008, 105, 16900–16905. 10.1073/pnas.0804525105. [DOI] [PMC free article] [PubMed] [Google Scholar]
- Whittingham J. L.; Carrero-Lerida J.; Brannigan J. A.; Ruiz-Perez L. M.; Silva A. P. G.; Fogg M. J.; Wilkinson A. J.; Gilbert I. H.; Wilson K. S.; González-Pacanowska D. Structural basis for the efficient phosphorylation of AZT-MP (3′-azido-3′-deoxythymidine monophosphate) and dGMP by Plasmodium falciparum type I thymidylate kinase. Biochem. J. 2010, 428, 499–509. 10.1042/BJ20091880. [DOI] [PubMed] [Google Scholar]
- Sinha K.; Rule G. S. The Structure of Thymidylate Kinase from Candida Albicans Reveals a Unique Structural Element. Biochemistry 2017, 56, 4360–4370. 10.1021/acs.biochem.7b00498. [DOI] [PubMed] [Google Scholar]
- Biswas A.; Shukla A.; Vijayan R. S. K.; Jeyakanthan J.; Sekar K. Crystal Structures of an Archaeal Thymidylate Kinase from Sulfolobus Tokodaii Provide Insights into the Role of a Conserved Active Site Arginine Residue. J. Struct. Biol. 2017, 197, 236–249. 10.1016/j.jsb.2016.12.001. [DOI] [PubMed] [Google Scholar]
- Schulz G. E.; Müller C. W.; Diederichs K. Induced-Fit Movements in Adenylate Kinases. J. Mol. Biol. 1990, 213, 627–630. 10.1016/S0022-2836(05)80250-5. [DOI] [PubMed] [Google Scholar]
- Schrank T. P.; Wrabl J. O.; Hilser V. J. Conformational Heterogeneity within the LID Domain Mediates Substrate Binding to Escherichia Coli Adenylate Kinase: Function Follows Fluctuations. Top. Curr. Chem. 2013, 337, 95–121. 10.1007/128_2012_410. [DOI] [PMC free article] [PubMed] [Google Scholar]
- Brundiers R.; Lavie A.; Veit T.; Reinstein J.; Schlichting I.; Ostermann N.; Goody R. S.; Konrad M. Modifying Human Thymidylate Kinase to Potentiate Azidothymidine Activation. J. Biol. Chem. 1999, 274, 35289–35292. 10.1074/jbc.274.50.35289. [DOI] [PubMed] [Google Scholar]
- Scheffzek K.; Kliche W.; Wiesmüller L.; Reinstein J. Crystal Structure of the Complex of UMP/CMP Kinase from Dictyostelium Discoideum and the Bisubstrate Inhibitor P1-(5′-Adenosyl) P5-(5′-Uridyl) Pentaphosphate (UP5A) and Mg2+ at 2.2 Å: Implications for Water-Mediated Specificity. Biochemistry 1996, 35, 9716–9727. 10.1021/bi960642s. [DOI] [PubMed] [Google Scholar]
- Liu Y.; Marks K.; Cowley G. S.; Carretero J.; Liu Q.; Nieland T. J. F.; Xu C.; Cohoon T. J.; Gao P.; Zhang Y.; et al. Metabolic and Functional Genomic Studies Identify Deoxythymidylate Kinase as a Target in LKB1-Mutant Lung Cancer. Cancer Discov 2013, 3, 870–879. 10.1158/2159-8290.CD-13-0015. [DOI] [PMC free article] [PubMed] [Google Scholar]
- Hu C.-M.; Yeh M.-T.; Tsao N.; Chen C.-W.; Gao Q.-Z.; Chang C.-Y.; Lee M.-H.; Fang J.-M.; Sheu S.-Y.; Lin C.-J.; et al. Tumor Cells Require Thymidylate Kinase to Prevent DUTP Incorporation during DNA Repair. Cancer Cell 2012, 22, 36–50. 10.1016/j.ccr.2012.04.038. [DOI] [PubMed] [Google Scholar]
- Chen Y.-H.; Hsu H.-Y.; Yeh M.-T.; Chen C.-C.; Huang C.-Y.; Chung Y.-H.; Chang Z.-F.; Kuo W.-C.; Chan N.-L.; Weng J.-H.; et al. Chemical Inhibition of Human Thymidylate Kinase and Structural Insights into the Phosphate Binding Loop and Ligand-Induced Degradation. J. Med. Chem. 2016, 59, 9906–9918. 10.1021/acs.jmedchem.6b01280. [DOI] [PubMed] [Google Scholar]
- Furman P. A.; Fyfe J. A.; St Clair M. H.; Weinhold K.; Rideout J. L.; Freeman G. A.; Lehrman S. N.; Bolognesi D. P.; Broder S.; Mitsuya H. Phosphorylation of 3’-azido-3’-deoxythymidine and selective interaction of the 5’-triphosphate with human immunodeficiency virus reverse transcriptase. Proc. Natl. Acad. Sci. U.S.A. 1986, 83, 8333–8337. 10.1073/pnas.83.21.8333. [DOI] [PMC free article] [PubMed] [Google Scholar]
- Yan J.-P.; Ilsley D. D.; Frohlick C.; Steet R.; Hall E. T.; Kuchta R. D.; Melaņon P. 3′-Azidothymidine (Zidovudine) Inhibits Glycosylation and Dramatically Alters Glycosphingolipid Synthesis in Whole Cells at Clinically Relevant Concentrations. J. Biol. Chem. 1995, 270, 22836–22841. 10.1074/jbc.270.39.22836. [DOI] [PubMed] [Google Scholar]
- Lavie A.; Schlichting I.; Vetter I. R.; Konrads M.; Reinstein J.; Goody R. S. The Bottleneck in AZT Activation. Nat. Med. 1997, 3, 922–924. 10.1038/nm0897-922. [DOI] [PubMed] [Google Scholar]
- Kline E. R.; Bassit L.; Hernandez-Santiago B. I.; Detorio M. A.; Liang B.; Kleinhenz D. J.; Walp E. R.; Dikalov S.; Jones D. P.; Schinazi R. F.; et al. Long-Term Exposure to AZT, but Not D4T, Increases Endothelial Cell Oxidative Stress and Mitochondrial Dysfunction. Cardiovasc. Toxicol. 2009, 9, 1–12. 10.1007/s12012-008-9029-8. [DOI] [PMC free article] [PubMed] [Google Scholar]
- Ostermann N.; Lavie A.; Padiyar S.; Brundiers R.; Veit T.; Reinstein J.; Goody R. S.; Konrad M.; Schlichting I. Potentiating AZT activation: structures of wild-type and mutant human thymidylate kinase suggest reasons for the mutants’ improved kinetics with the HIV prodrug metabolite AZTMP. J. Mol. Biol. 2000, 304, 43–53. 10.1006/jmbi.2000.4175. [DOI] [PubMed] [Google Scholar]
- Ostermann N.; Segura-Peña D.; Meier C.; Veit T.; Monnerjahn C.; Konrad M.; Lavie A. Structures of Human Thymidylate Kinase in Complex with Prodrugs: Implications for the Structure-Based Design of Novel Compounds†. Biochemistry 2003, 42, 2568–2577. 10.1021/bi027302t. [DOI] [PubMed] [Google Scholar]
- Lavie A.; Konrad M.; Brundiers R.; Goody R. S.; Schlichting I.; Reinstein J. Crystal Structure of Yeast Thymidylate Kinase Complexed with the Bisubstrate Inhibitor P 1 -(5‘-Adenosyl) P 5 -(5‘-Thymidyl) Pentaphosphate (TP 5 A) at 2.0 Å Resolution: Implications for Catalysis and AZT Activation. Biochemistry 1998, 37, 3677–3686. 10.1021/bi9720787. [DOI] [PubMed] [Google Scholar]
- Lavie A.; Ostermann N.; Brundiers R.; Goody R. S.; Reinstein J.; Konrad M.; Schlichting I. Structural basis for efficient phosphorylation of 3’-azidothymidine monophosphate by Escherichia coli thymidylate kinase. Proc. Natl. Acad. Sci. U.S.A. 1998, 95, 14045–14050. 10.1073/pnas.95.24.14045. [DOI] [PMC free article] [PubMed] [Google Scholar]
- Sato T.; Neschadim A.; Lavie A.; Yanagisawa T.; Medin J. A. The Engineered Thymidylate Kinase (TMPK)/AZT Enzyme-Prodrug Axis Offers Efficient Bystander Cell Killing for Suicide Gene Therapy of Cancer. PLoS ONE 2013, 8, e78711 10.1371/journal.pone.0078711. [DOI] [PMC free article] [PubMed] [Google Scholar]
- Wohrl B. M.; Loubière L.; Brundiers R.; Goody R. S.; Klatzmann D.; Konrad M. Expressing Engineered Thymidylate Kinase Variants in Human Cells to Improve AZT Phosphorylation and Human Immunodeficiency Virus Inhibition. J. Gen. Virol. 2005, 86, 757–764. 10.1099/vir.0.80529-0. [DOI] [PubMed] [Google Scholar]
- Wolf-Watz M.; Thai V.; Henzler-Wildman K.; Hadjipavlou G.; Eisenmesser E. Z.; Kern D. Linkage between Dynamics and Catalysis in a Thermophilic-Mesophilic Enzyme Pair. Nat. Struct. Mol. Biol. 2004, 11, 945–949. 10.1038/nsmb821. [DOI] [PubMed] [Google Scholar]
- Ådén J.; Verma A.; Schug A.; Wolf-Watz M. Modulation of a Pre-Existing Conformational Equilibrium Tunes Adenylate Kinase Activity. J. Am. Chem. Soc. 2012, 134, 16562–16570. 10.1021/ja3032482. [DOI] [PubMed] [Google Scholar]
- Ådén J.; Weise C. F.; Brännström K.; Olofsson A.; Wolf-Watz M. Structural Topology and Activation of an Initial Adenylate Kinase-Substrate Complex. Biochemistry 2013, 52, 1055–1061. 10.1021/bi301460k. [DOI] [PubMed] [Google Scholar]
- Kerns S. J.; Agafonov R. V.; Cho Y.-J.; Pontiggia F.; Otten R.; Pachov D. V.; Kutter S.; Phung L. A.; Murphy P. N.; Thai V.; et al. The Energy Landscape of Adenylate Kinase during Catalysis. Nat. Struct. Mol. Biol. 2015, 22, 124–131. 10.1038/nsmb.2941. [DOI] [PMC free article] [PubMed] [Google Scholar]
- Kovermann M.; Ådén J.; Grundström C.; Elisabeth Sauer-Eriksson A.; Sauer U. H.; Wolf-Watz M. Structural Basis for Catalytically Restrictive Dynamics of a High-Energy Enzyme State. Nat. Commun. 2015, 6, 7644. 10.1038/ncomms8644. [DOI] [PMC free article] [PubMed] [Google Scholar]
- Waudby C. A.; Ramos A.; Cabrita L. D.; Christodoulou J. Two-Dimensional NMR Lineshape Analysis. Sci. Rep. 2016, 6, 24826. 10.1038/srep24826. [DOI] [PMC free article] [PubMed] [Google Scholar]
- Perkins S. J.; Wüthrich K. Ring Current Effects in the Conformation Dependent NMR Chemical Shifts of Aliphatic Protons in the Basic Pancreatic Trypsin Inhibitor. Biochim. Biophys. Acta BBA—Protein Struct. 1979, 576, 409–423. 10.1016/0005-2795(79)90416-1. [DOI] [PubMed] [Google Scholar]
- Chenal-Francisque V.; Tourneux L.; Carniel E.; Christova P.; Sierra I. L. de la; Bârzu O.; Gilles A.-M. The Highly Similar TMP Kinases of Yersinia Pestis and Escherichia Coli Differ Markedly in Their AZTMP Phosphorylating Activity. Eur. J. Biochem. 1999, 265, 112–119. 10.1046/j.1432-1327.1999.00691.x. [DOI] [PubMed] [Google Scholar]
- Feldhaus P.; Frohlich T.; Goody R. S.; Isakov M.; Schirmer R. H. Synthetic Inhibitors of Adenylate Kinases in the Assays for ATPases and Phosphokinases. Eur. J. Biochem. 1975, 57, 197–204. 10.1111/j.1432-1033.1975.tb02291.x. [DOI] [PubMed] [Google Scholar]
- Chaudhary S. K.; Iyyappan Y.; Elayappan M.; Jeyakanthan J.; Sekar K. Insights into Product Release Dynamics through Structural Analyses of Thymidylate Kinase. Int. J. Biol. Macromol. 2019, 123, 637–647. 10.1016/j.ijbiomac.2018.11.025. [DOI] [PubMed] [Google Scholar]
- Chen M. D.; Sinha K.; Rule G. S.; Ly D. H. Interaction of α-Thymidine Inhibitors with Thymidylate Kinase from Plasmodium falciparum. Biochemistry 2018, 57, 2868–2875. 10.1021/acs.biochem.8b00162. [DOI] [PubMed] [Google Scholar]
- Huang C.-Y.; Chen Y.-C.; Wu-Hsieh B. A.; Fang J.-M.; Chang Z.-F. The Ca-Loop in Thymidylate Kinase Is Critical for Growth and Contributes to Pyrimidine Drug Sensitivity of Candida Albicans. J. Biol. Chem. 2019, 294, 10686–10697. 10.1074/jbc.RA118.006798. [DOI] [PMC free article] [PubMed] [Google Scholar]
- Studier F. W. Protein production by auto-induction in high-density shaking cultures. Protein Expr. Purif. 2005, 41, 207–234. 10.1016/j.pep.2005.01.016. [DOI] [PubMed] [Google Scholar]
- Goto N. K.; Gardner K. H.; Mueller G. A.; Willis R. C.; Kay L. E. A Robust and Cost-Effective Method for the Production of Val, Leu, Ile (δ1) Methyl-Protonated 15N-, 13C-, 2H-Labeled Proteins. J. Biomol. NMR 1999, 13, 369–374. 10.1023/A:1008393201236. [DOI] [PubMed] [Google Scholar]
- Blondin C.; Serina L.; Wiesmuller L.; Gilles A. M.; Barzu O. Improved Spectrophotometric Assay of Nucleoside Monophosphate Kinase Activity Using the Pyruvate Kinase/Lactate Dehydrogenase Coupling System. Anal. Biochem. 1994, 220, 219–221. 10.1006/abio.1994.1326. [DOI] [PubMed] [Google Scholar]
- Gasteiger E.; Hoogland C.; Gattiker A.; Duvaud S.; Wilkins M. R.; Appel R. D.; Bairoch A.. Protein Identification and Analysis Tools on the ExPASy Server. In The Proteomics Protocols Handbook; Walker J. M., Ed.; Humana Press, 2005; pp 571–607. [Google Scholar]
- Baldwin A. J.; Religa T. L.; Hansen D. F.; Bouvignies G.; Kay L. E. 13 CHD 2 Methyl Group Probes of Millisecond Time Scale Exchange in Proteins by 1 H Relaxation Dispersion: An Application to Proteasome Gating Residue Dynamics. J. Am. Chem. Soc. 2010, 132, 10992–10995. 10.1021/ja104578n. [DOI] [PubMed] [Google Scholar]
- Tugarinov V.; Kay L. E. Quantitative 13 C and 2 H NMR Relaxation Studies of the 723-Residue Enzyme Malate Synthase G Reveal a Dynamic Binding Interface. Biochemistry 2005, 44, 15970–15977. 10.1021/bi0519809. [DOI] [PubMed] [Google Scholar]
- Delaglio F.; Grzesiek S.; Vuister G. W.; Zhu G.; Pfeifer J.; Bax A. A Multidimensional Spectral Processing System Based on Pipes. J. Biomol. NMR 1995, 6, 277–293. 10.1007/bf00197809. [DOI] [PubMed] [Google Scholar]
- Vuister G. W.; Clore G. M.; Gronenborn A. M.; Powers R.; Garrett D. S.; Tschudin R.; Bax A. Increased Resolution and Improved Spectral Quality in Four-Dimensional 13C/13C-Separated HMQC-NOESY-HMQC Spectra Using Pulsed Field Gradients. J. Magn. Reson. B 1993, 101, 210–213. 10.1006/jmrb.1993.1035. [DOI] [Google Scholar]
- Tugarinov V.; Kay L. E. Ile, Leu, and Val Methyl Assignments of the 723-Residue Malate Synthase G Using a New Labeling Strategy and Novel NMR Methods. J. Am. Chem. Soc. 2003, 125, 13868–13878. 10.1021/ja030345s. [DOI] [PubMed] [Google Scholar]
- Gans P.; Hamelin O.; Sounier R.; Ayala I.; Durá M. A.; Amero C. D.; Noirclerc-Savoye M.; Franzetti B.; Plevin M. J.; Boisbouvier J. Stereospecific Isotopic Labeling of Methyl Groups for NMR Spectroscopic Studies of High-Molecular-Weight Proteins. Angew. Chem., Int. Ed. 2010, 49, 1958–1962. 10.1002/anie.200905660. [DOI] [PubMed] [Google Scholar]
- García de la Torre J.; Huertas M. L.; Carrasco B. HYDRONMR: Prediction of NMR Relaxation of Globular Proteins from Atomic-Level Structures and Hydrodynamic Calculations. J. Magn. Reson. 2000, 147, 138–146. 10.1006/jmre.2000.2170. [DOI] [PubMed] [Google Scholar]
- Luz Z.; Meiboom S. Nuclear Magnetic Resonance Study of the Protolysis of Trimethylammonium Ion in Aqueous Solution-Order of the Reaction with Respect to Solvent. J. Chem. Phys. 1963, 39, 366–370. 10.1063/1.1734254. [DOI] [Google Scholar]
- Carver J. P.; Richards R. E. A General Two-Site Solution for the Chemical Exchange Produced Dependence of T2 upon the Carr-Purcell Pulse Separation. J. Magn. Reson. 1972, 6, 89–105. 10.1016/0022-2364(72)90090-X. [DOI] [Google Scholar]
Associated Data
This section collects any data citations, data availability statements, or supplementary materials included in this article.