

Abstract

Herein, we reported a chemiluminescent biosensor based on the covalent immobilization of the horseradish peroxidase (HRP) enzyme on a polydimethylsiloxane (PDMS) support to quantify in situ hydrogen peroxide (H2O2). The chemiluminescent reaction based on the use of luminol as an oxidizable substrate, with HRP as the catalyst, has been used in order to quantify H2O2 as the oxidizing agent. The performance of the proposed biosensor has been demonstrated to determine H2O2 liberated by cells in a culture medium and for evaluating the delivery of H2O2 from denture cleaner tablets, as examples of application. For both analyses, the results indicated that the biosensor is cost-effective, sensitive, and selective with a detection limit of 0.02 μM and good linearity over the range 0.06–10 μM. Precision was also satisfactory (relative standard deviation, % RSD < 6). The strength of this biosensing system is the simplicity, portability, and reusability of the devices; it can be applied up to 60 times with 90% of its activity maintained.
1. Introduction
In situ monitoring technologies appeared as an advance for complementing the classical methods in the laboratory. Traditional chemistry analysis sometimes means that a process takes so long that it impedes a quick actuation in the case of not expected outcomes.1
In this context, biosensors appear as a reliable alternative which can be applied to numerous analytical processes in several fields such as healthcare and food and drink industry including environmental and security monitoring.2−4 The ideal sensor has to be selective, sensitive, cheap, portable, and reusable. Enzymatic biosensors are thoroughly used in analytical determinations because of their high selectivity and sensitivity.5 Most of the sensors are for just one use because of the limitation of the reagents employed or their format. The reusability of the sensor depends on the immobilization procedure. Covalent immobilization can be an optimal alternative to keep the enzyme attached on the surface and avoid its desorption with the use of the biosensor. Enzyme binding can be carried out from the activation of the support surface using multifunctional reagents.6−9 This approach can be combined with the use of portable instruments for both transduction and in situ analysis, and these instruments are smaller and cheaper than laboratory analytical instruments and easy to handle by nonqualified personnel. Moreover, the possibility of miniaturization makes the analysis more cost-effective because of the reduction of analysis time and needed reagents.
Hydrogen peroxide (H2O2) is present in a large variety of products and it has a great importance in pharmaceutical, clinical, chemical, industrial, and environmental analyses.10−14 H2O2 is considered one of the reactive oxygen species, and it can be found in human fluids. Although it is poorly reactive, it is able to form other highly reactive intermediates such as hydroxyl radical (OH•). On the other hand, H2O2 is known to be an inter- and intracellular signaling molecule which regulates cellular processes. Thus, the H2O2 concentration in biofluids can be altered in many disease conditions including cancer, diabetes mellitus, Alzheimer, atherosclerosis, and Parkinson’s disease among others, considering that it is a biomarker of oxidative stress.15−18 Furthermore, H2O2 is widely used in industry because of its oxidizing power. It is antibacterial, antifungal, antimold, and antiviral.19
Until now, several sensors have been reported for determining H2O2 in different matrices through enzymatic reactions, using peroxidase reactions such as horseradish peroxidase (HRP). The assayed enzyme catalyzed the oxidation of a wide variety of organic compounds such as 3-ethylbenzothiazoline-6-sulfonic acid (ABTS), N,N-diethyl-p-phenylenediamine (DPD), o-phenylenediamine (OPD), 3,3′-diaminobenzidine (DAB), 3,3′,5,5′-tetramethyl-benzidine (TMB), or luminol.20−22 These methods include both electrochemical12,23−28 and optical techniques.20,29−34 Amplex Red derivatives, instead of luminol and colorimetric substrates, are also applied to quantify hydrogen peroxide in the presence of HRP with fluorescence and 1,1′-oxalyldiimidazole chemiluminescence (CL) detection.35 In addition, hydrogen peroxide in a sample can be quantified with fluorescent and luminescent probes without HRP.35−37 However, as far as we know, there are no publications in the literature where a portable and reusable HRP sensor is developed. Optical techniques appear as an alternative, specifically in terms of luminescence, by virtue of their high sensitivity and selectivity, especially by using bioluminescence/CL, to the electrochemical methods, which can present sometimes a lack of robustness.38
CL does not need an excitation source, often it is performed in dynamic conditions such as flow injection analysis.39−41 It should be marked that the luminescence signal can be measured with portable instruments. Thus, it is a challenge to develop in situ CL procedures by using robust devices. In this context, we propose an in situ, reusable, stable device for H2O2 determination by using a portable luminometer as a transductor. The reaction is based on the luminol oxidation reaction carried out by H2O2 and catalyzed by HRP, which is covalently immobilized on a PDMS surface placed in a polystyrene tube. The results revealed that the developed method displays good selectivity and sensitivity toward H2O2 with a low limit of detection (LOD). Also, it demonstrates its successfully applicability to detect H2O2 in a culture medium, which was in contact with cells, and to measure the H2O2 release by denture cleaner tablets. In addition, it is shown that the developed sensor provided security, rapidity, and cost-effectiveness in reference to other methods.
2. Results and Discussion
2.1. Optimization of the Biosensor
The support matrix has to provide a biocompatible and inert environment and it should not interfere with the native structure of the protein; polydimethylsiloxane (PDMS) is a good choice because it offers an appropriate way to fix biomolecules because of its porosity, optical transparent matrix, low temperature curing, and inherent versatility.20 The enzyme covalent binding onto the activated PDMS surface is a critical factor to develop the biosensor. In order to perform it, a combination of different procedures described in the literature was used.6,7,9Figure 1 illustrates the procedures for the biofunctionalization of the PDMS to obtain the biosensor. PDMS solidified at the bottom of the polystyrene tube, and then the surface was activated with hydroxyl groups (1), followed by the amino-functionalization of the activated PDMS (2) and addition of glutaraldehyde (3), and finally the HRP was covalently immobilized on the polymer (4) (see Section 4.3 for more experimental details). Figure 2 shows the obtained attenuated total reflectance–Fourier transform infrared (ATR–FTIR) spectra, which are in accordance with the several steps for obtaining the biofunctionalized sensor. PDMS has several characteristic infrared bands; at 2962 cm–1 (C–H stretching in CH3), 1259 cm–1 (CH3 symmetric bending in Si–CH3), 1076 and 1018 cm–1 (Si–O–Si), and 798 cm–1 (CH3 rocking in Si–CH3), whereas activated PDMS also showed a band centered at around 3350 cm–1 which was assigned to the O–H stretch of surface silanol groups.42 After PDMS surface modification with 3-aminopropyl trimethoxylane (APTMS), the absorption at 3350 cm–1 decreases and a band at 1680 cm–1 appeared after APTMS and glutaraldehyde reaction, indicating the C=N vibration. Finally, after HRP immobilized on PDMS, the HRP functional groups emerged at around 3315 cm–1 because of the association of the N–H stretching and at 1510 and 1620 cm–1 related to the stretching band of −CONH– (amide I) and (amide II) vibrations in HRP. These results demonstrated that the HRP was successfully immobilized on PDMS. The morphology has been characterized by electronic microscopy. The PDMS composite surface is homogeneous in accordance with a nonporous material (see Figure 2).
Figure 1.
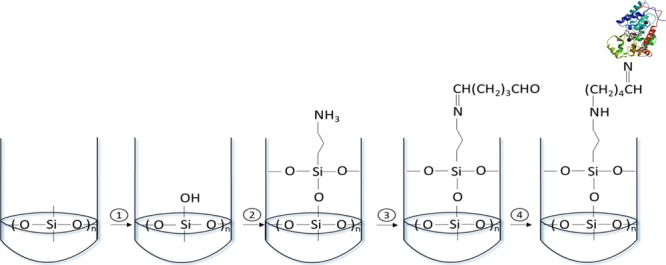
Schematic description of biofunctionalization of PDMS. Activation of the PDMS surface with hydroxyl groups (1), aminofunctionalization by using APTMS (2), addition of the cross-linker GTA (3), and covalent bonding of HRP (4).
Figure 2.

ATR–FTIR spectra of pure PDMS and HPR and hybrid PDMS films. Scanning electron microscopy image of the sensor (for more explanations, see the text and Figure 1).
Here, we avoided the use of cyanoborohydride described in the literature7 because it is a toxic reagent and its addition did not favor the immobilization process. On the other hand, two different options of performing the linking between the glutaraldehyde (GTA) and HRP were tested in order to study the influence of this step in the immobilization process. The first one consisted of linking the GTA to APTMS after HRP and the second one was to obtain the cross-linked enzyme aggregates with GTA and HRP, and the aggregates were linked to APTMS. Although the reagents are placed in a different order, no differences were obtained between the results obtained. In both cases, the response was similar, and thus, we concluded that the order did not affect the amount of enzyme immobilized on the PDMS. According to the results, the first option was selected for further experiments as it was the simplest process.
Different concentrations of the enzyme (between 0.005 and 5 mg·mL–1) were used to functionalize the PDMS for selecting the most efficient HRP concentration for preparing the biosensor. The response of these prepared biosensors were tested by employing H2O2 (50 μM) in the presence of luminol (17.5 mM) measured after 10 s with a portable luminometer (Figure S1 in the Supporting Information, SI). The obtained results indicated that the concentration of the enzyme should be higher than 0.1 mg·mL–1 for achieving the maximum response. Solutions used for HRP immobilization were not discarded, and they were used for other purposes because the remaining enzyme was still active.
Under the chosen conditions, the results indicated (see Figure S2 in the Supporting Information and Section 4.4) that the theoretical concentration of active HRP immobilized to the PDMS surface was 0.0156 mg·mL–1 (0.023 U). Similar results (0.02 U) were obtained by employing 2.5 μM H2O2 for the biosensors prepared by incubating them with 0.1 and 1 mg·mL–1 concentrations of HRP enzyme solution. Moreover, the precision of sensor fabrication was suitable for obtaining 4.2% intraday (n = 6) and 5.9% interday (n = 3) as relative standard deviations (% RSD).
2.2. Optimization of the Reaction Conditions
To study the kinetics of the reaction and optimize the concentration of the reagents required, first, it was carried out in solution using a conventional spectrofluorimeter (Figure 3A,B) in order to detect the transient signal. Different concentrations of luminol in a range of 0.017 and 17 mM were assayed for a constant concentration of HRP and H2O2 at 1.22 mg L–1 and 0.478 mM, respectively (Figure 3A). From 1.7 mM of luminol, the luminescence signal was less dependent on the luminol concentration, as can be seen in Figure 3A. The reaction was also studied by varying HRP concentrations between 0.36 and 12.2 mg L–1 and maintaining luminol and H2O2 concentrations constant at 17 and 0.478 mM, respectively (Figure 3B); almost a saturated signal at an HRP concentration of 12.2 mg L–1 was obtained. The linear range for HRP was found from 0.5 to 10 mg L–1.
Figure 3.

Optimization of the reaction conditions: (A) luminol concentration (0.017, 0.17, 1.7, and 17 mM) and (B) HRP concentration [0.36 (a), 0.6 (b), 1.22 (c), and 12.2 mg L–1 (d)] in solution by using a conventional spectrofluorometer. (C) Luminol concentration (2.5–25 mM at 10 s) and (D) time for different H2O2 standard concentrations of 0.1, 0.5, 1, 2, and 10 μM and (D) by using the biosensor and a portable luminometer. (E) Reusability of the biosensor expressed as relative activity (%).
Different concentrations of luminol were tested employing the biosensor and the portable luminometer, in the presence of H2O2 (50 μM) and measuring at 10 s. It can be observed in Figure 3C that the luminescence intensities increase with the luminol concentrations until 17.5 mM and after the signal is stabilized. The selected luminol concentration was 17.5 mM.
Additionally, the response of the developed sensor to H2O2 concentration (0.1–10 μM) was studied in a portable luminometer by recording the luminescence signal during 40 s (Figure 3D). As it can be seen, the transient signal was also observed and the results showed that in every studied concentration at 10 s, the light intensity decreased slowly over time until 40 s. The selected time was 10 s achieving a good sensitivity and precision.
2.3. Enzyme Activity Measurements
The kinetic parameters were evaluated recording the luminescence signal at 0 and 40 s. The initial rate was calculated by the difference between these two signals. The kinetic behavior of HRP was studied in solution (with hydrogen peroxide and sodium percarbonate) and in the developed sensor which contained HRP covalently bound to the PDMS support. Each experiment was repeated 3 times.
The Km and Vmax parameters were estimated through the Lineweaver–Burk linearization where the inverse of the velocity was plotted against the inverse of the substrate concentration (Figure S3). The Vmax was estimated from the Y-intercept and the Km was estimated from the X-intercept (see Section 4.5).
The “apparent” Km obtained in solution and with the biosensor for the H2O2 and the sodium percarbonate which liberates H2O2 was similar. The Vmax value was higher in solution than by using the sensor including both reagents, and this could be because the Vmax value depends on the catalytic capacity of HRP and it could be something less in the sensor because of the immobilization process.
2.4. Analytical Parameters, Stability, and Reusability
The system HRP luminol-H2O2 has been used in many CL assays.43 Peroxidases are usually preferred because luminol can be oxidized in mild conditions and hydrogen peroxide is the most significant oxidizing agent, which increases the luminescent intensity of luminol. Interference may be due to an alteration in the catalytic activity, redox properties, or chemical reactivity with the luminol mixture. A critical discussion about this topic can be found in ref (43).
As shown in Table 1, a linear behavior was observed between the analytical signals and the standards of H2O2 at a range of concentrations, 0.06–10 μM. The LOD of the developed biosensor was estimated as 0.02 μM, and it was calculated as 3 Sblank/b, where b is the slope of the linear calibration curve and Sblank is the standard deviation of the several measurements of blank solutions. For the developed biosensor, the precision was evaluated by obtaining the intra- and interday relative standard deviations (% RSDs) under optimized experimental conditions (200 μL of 10 μM H2O2 and 200 μL of 35 mM luminol). The proposed procedure provided satisfactory % RSD values being lower than 10% in all instances. According to these results, the precision of the method was suitable and no differences were observed between devices.
Table 1. Comparison of Merits Obtained with the Developed Biosensor Testing Different Substrates for the H2O2 Determination.
| calibration graph equations y = a + bx |
precision, % RSD (n = 3)b |
|||||
|---|---|---|---|---|---|---|
| substrate | linear range (μM) | sensibility | R2 | intraday | interday | LOD (μM) |
| H2O2 | 0.06–10 | 1200 ± 9 | 0.999 | 5.3 | 5.9 | 0.02 |
| H2O2a | 0.08–10 | 158 ± 3 | 0.999 | 1.7 | 2.9 | 0.03 |
| Na2CO3·2H2O2 | 0.06–10 | 1186 ± 19 | 0.999 | 2.1 | 3.1 | 0.02 |
Culture medium.
Precision 10 μM H2O2.
The stability of the biosensor over time was examined by comparing the response of three sensors used on the same day they were prepared with the responses of three sensors used after several months of storage at −20 °C. The biosensor retained its activity unchanged for at least 3 months (see Figure 3E).
The biosensor reusability was also studied by using a freshly prepared solution of H2O2 with fixed concentration (50 μM). To check this property, the sensor was used and water-cleaned before reusing again. The HRP activity remains unchanged after 30 uses (with 99.5% of activity compared with the first use), and after 60 uses, the activity was 92%. The activity of the biosensor decreased gradually after the 60 uses, obtaining 47% of activity in 75 uses. In the same session (n = 15), the RSD % of the signals was <10% (Figure 3E). The results indicated that this biosensor maintained its properties, which are stable over time (at least 3 months stored in the freezer) and a reusability of at least 60 times.
We compared the reusability of the PDMS biosensor with that achieved by HRP immobilization in polystyrene. From fabrication perspective, namely, easy of prototyping and low cost, PDMS is superior to polystyrene.44 The immobilization of HRP on the polystyrene tube by ultrasonication45 and by using 3-aminopropyltriethoxysilane (3-APTES) as a linker46 was tested. However, after 5 uses, the HRP activity was reduced to 81% with the first method and 20% with the second method. We also tested the same procedure to anchor the enzyme on the PDMS for polystyrene, and the remaining activity after 5 uses was 56%. Therefore, the PDMS matrix was more efficient because it allows reuse of the tube up to 60 times.
2.5. Determination of Hydrogen Peroxide in Real Samples
Showing the applicability of the biosensor, the released H2O2 in relevant different matrices has been detected: culture medium DMEM-F12 in contact with cells and a commercial product (Corega Oxígeno Bio-Activo tablets) for cleaning the denture.
2.5.1. Culture Medium of Cells
The H2O2 produced by neuroblast cells in culture medium DMEM-F12 was determined. Previously, the influence of the culture medium in the determination was evaluated. The matrix effect was observed in the presence of the medium, and the H2O2 concentration had to be calculated by interpolation in the respective calibration curve obtained for standards containing the culture medium instead of water. The results are summarized in Table 2. In order to study the accuracy of the method, the culture medium incubated with cells was fortified with 2 μM H2O2. Data of recovery were between 93 and 109%, and thus, these results confirm that this biosensor is appropriated for the extracellular hydrogen peroxide determination. The RSD obtained was 7.7%. In three of the seven samples assayed, the cells liberated H2O2 (see Table 2).
Table 2. Analysis of Culture Medium DMEM-F12 Incubated with Neuroblast Cellsa.
| sample | added (μM) | found (μM) | recovery (%) |
|---|---|---|---|
| 1 | 0 | 0.42 | |
| 2 | 2.63 | 109.3 ± 1.6 | |
| 2 | 0 | 0.42 | |
| 2 | 2.63 | 109.1 ± 1.4 | |
| 3 | 0 | ND | |
| 2 | 1.96 | 95.1 ± 0.4 | |
| 4 | 0 | 0.24 | |
| 2 | 2.39 | 106.21 ± 1.04 | |
| 5 | 0 | ND | |
| 2 | 1.86 | 97.2 ± 0.2 | |
| 6 | 0 | ND | |
| 2 | 1.94 | 109.6 ± 1.4 | |
| 7 | 0 | ND | |
| 2 | 1.89 | 99 ± 2 |
H2O2 concentration found.
2.5.2. Corega Oxígeno Bio-Activo Tablets
The main cleaning agent in Corega Oxígeno Bio-Activo tablets is sodium percarbonate (Na2CO3·2H2O2) which carries out the process by the liberation of hydrogen peroxide. The aim of this study was to follow the H2O2 released from the tablets by using the biosensor proposed. H2O2 concentration was determined in the solution containing one tablet during 3 min, which is the time indicated by the manufacturer to perform the cleaning process. The matrix effect was observed, and it was corrected by the standard addition method at every time. The concentrations found at different measuring times are shown in Figure S4 (see the Supporting Information) for releasing in the presence or absence of the denture. H2O2 is released over time until achieving a state stationary at 180 s in both the mentioned cases. At this time, it is supposed that the H2O2 is completely released. The H2O2 concentration found at 180 s expressed as Na2CO3·2H2O2 was 5.3%, calculated in water. The results are according to those indicated by the manufacturer (<10% Na2CO3·2H2O2).
The proposed biosensor allows the direct determination of H2O2 in a variety of different samples. Moreover, the sensor is able to determine H2O2 from indirect reaction which generates H2O2 too.
2.6. Comparison with Other Methods for Peroxide Determination through Biosensors
In Table 3, a variety of optical and electrochemical methods used for determination of hydrogen peroxide including supported HRP as the enzyme have been compared. Analytical parameters such as the analytical signal, detection limit, and linear range have been summarized. Others important characteristics such as portability, reusability, and stability have been included. The terminology portability has been considered when the measuring instrument can easily be moved to the sampling place with the operator (weight < 2 kg) and it does not require to be connected to the supply; therefore, it has a reliable battery system.
Table 3. Comparison of HRP Immobilization Methods on Solid Supports for H2O2 Sensing.
| support of HRP | technique/reagent | LODs (nM), linear range (μM) | portable | reusable (uses) | stability (months) | sample | refs |
|---|---|---|---|---|---|---|---|
| PDMS-TEOS-SiO2-TMB | spectroscopy/TMB | 400, 1.2–72 | yes | no | 3 | cosmetics | (20) |
| Cu3(PO4)2-3H2O | spectroscopy/TMB | 200, 0–50 | no | no | urine | (34) | |
| PEG | fluorescence/HP green | 9100, 30–300 | no | yes | 1 | cell nutrition medium | (29) |
| UVNPs@PSIOAm | luminescence | 64, 0.1–5 | no | no | serum | (31) | |
| sol–gel | luminescence | -, 100–3000 | no | yes (5) | 2 | contact lenses solutions | (33) |
| PDMS | luminescence | 20, 0.06–10 | yes | yes (60) | 3 | cell culture medium cleaning denture tablet | this work |
| AgNPs/NDs/GCE | amperometry | 10, 0.1–34 | no | no | 1 | commercial eye drops | (12) |
| PGN/GCE-2 | amperometrya | 0.0267, 0.00008–0.664 | no | yes (50) | living cells | (24) | |
| MIL-100(Cr)-B | amperometry | 100, 0.5–3000 | no | yes (100) | 1 | living cells | (26) |
| nafion-nile blue | amperometry | 280, 0.5–1.5 | no | no | no | (27) |
Logarithmic calibration.
Although luminescence methods present lower LODs30−33 than spectrophotometric methods,20,24 only one reported article allows the reutilization of the sensor by 7 times; in addition, it is not a portable sensor and it is not tested in real samples.32 The fluorescence method was not very successful because of the higher LOD of the sensor; however, it is reusable, but it has not been reported many times.29 Electrochemical methods are not usually tested in real samples; therefore, difficulties from the sample analysis are not described.25,27,28 As we know, there is only one article which provides a lower linear range than the proposed biosensor; however it does not allow in situ monitoring because it is not portable and it needs a power supply.24 Although Dai et al. proposed a reusable amperometric sensor, the LOD achieved was higher than that achieved by the proposed biosensor, and in addition, the stability is not reported.26
Amplex Red has widely been described for quantifying H2O2 at very low levels. Qian et al. developed a ratiometric sensor using a combination of Amplex Red and fluorescent scopoletin capable of detecting H2O2 concentrations at 150 nM (higher than that provided by the proposed biosensor). However, the ratiometric sensor requires incubation at 25 °C for 5 h.36 Similar commercial assays using Amplex Red, in the best cases, require incubation at room temperature for at least 20–30 min.
The biosensor proposed here shows great results by comparing the abovementioned parameters with those given in Table 3 for other methods. The developed biosensor allows the determination of H2O2 with a good LOD and linear range and to determine it in situ using a portable luminometer as the transductor. Moreover, the covalent binding of the HRP permits the reusability of the sensor, and in this case, the biosensor can be used more than 60 times. Concerning the stability, the biosensor can be used after a long time (more than 3 months) of its fabrication by storing it in a freezer.
It should be marked that the developed biosensor allows reducing costs in reagents because of its small size; in addition, it provides reduced toxicity compared with other methods and simplifies the analysis. Moreover, a nonqualified operator could carry out the assay. On the other hand, chemiluminescent probes demonstrated to be very sensitive to H2O2 and allow very fast detection (in few seconds). This characteristic is very suitable in order to carry out studies about the H2O2 liberation. Our strategy to improve the cost efficiency of the assay has been to study the immobilization of the enzymatic catalyst (HRP) onto a solid PDMS-based support in order to obtain a reusable biosensor, in addition to propose a portable assay for in situ H2O2 determination.
3. Conclusions
In the present study, a novel H2O2 biosensor based on an enzymatic reaction has been developed. The sensor has been fabricated using a simple immobilization methodology of the HRP enzyme on an activate PDMS surface. The chemiluminescent signal with respect to the H2O2 concentration was measured by using a portable luminometer for transduction. Optimization of the enzyme immobilization was carried out in order to get a maximum signal and better accuracy results. This method has appropriate figures of merit, such as high sensitivity, and provides in situ measurements with high accuracy. Moreover, the measurements can be obtained in a very short time (just 10 s).
The biosensor satisfies the standards in terms of precision, robustness, and stability; moreover, it should be noticed that the device is reusable, allowing its use more than sixty times. The results revealed that the biosensor is a simple and reliable device for the quantitative determination of hydrogen peroxide by achieving a wide linear range, low detection limit, and fast response time. The biosensor has long-term applications because of the hydrogen peroxide implicated in a wide variety of reactions. In this case, hydrogen peroxide determination was carried out in extracellular fluid and Corega Oxígeno Bio-Activo tablets without any sample preparation.
4. Materials and Methods
4.1. Reagents and Standard Solutions
Nanopure water obtained using the Nanopure II system (Barnstead, USA) was used for preparation and dilution of all solutions. The SYLGARD 184 silicon elastomer base and SYLGARD 184 silicon elastomer curing agent were provided from Dow Corning (Michigan, US). Luminol, HRP (147 U·mg–1), chlorhydric acid, APTMS, isopropanol, sodium percarbonate (Na2CO3·2H2O2), and GTA were obtained from Sigma-Aldrich (Saint Louis, USA). Hydrogen peroxide 30% (v/v), sodium phosphate monobasic (NaH2PO4), potassium phosphate dibasic (K2HPO4), sodium hydrogencarbonate (NaHCO3), and sodium carbonate (Na2CO3) were purchased from Merck (Darmstadt, Germany). Acetic acid was acquired from Scharlau (Barcelona, Spain). Polystyrene tubes were obtained from Labbox (Barcelona, Spain).
Solution A: 1 mL APTMS, 5 mL of 0.1 M acetic acid, and 5 mL of isopropanol were mixed in a plastic container. The mixture was stirred for 2 h at room temperature, and then, 89 mL of residual isopropanol was added into it.
Stock solution of 5% glutaraldehyde was made in 0.1 M sodium phosphate buffer solution (pH = 7.0).
Stock solution of 35 mM luminol solution was prepared by dissolving an appropriate amount of luminol in buffer 0.3 M HCO3–/CO32– pH = 10.8. The mixture was stirred for 15 min in Vortex. The solution was prepared fresh daily.
Enzyme stock solution was prepared in nanopure water, and the working solutions were prepared by gradually diluting stock solution (0.005, 0.01, 0.05, 0.1, 0.5, 1, 1.5, and 5 mg·mL–1). The HRP stock solution was stored in the freezer until required.
Working solutions of H2O2 were prepared fresh daily by dilution of 30% (v/v) H2O2.
4.2. Instrumentation
Morphology was studied with a Hitachi S-4800 scanning electron microscope at an accelerating voltage of 20 keV over metalized samples with a mixture of gold and palladium during 30 s.
ATR–FTIR spectra were recorded using a Cary 630 FTIR spectrometer equipped with a diamond ATR sampling accessory from Agilent Technologies (Böblingen, Germany). Spectra were recorded at a resolution of 4 cm–1. For data collection, MicroLab FTIR software from Agilent Technologies was used; for data processing, Resolutions Pro software (Agilent Technologies) was used.
Luminescence measurements were recorded by using a portable tube luminometer from Berthold Technologies (Bad Wildbad, Germany) and a Jasco FP 750 spectrofluorometer (Tokyo, Japan). The emission was measured inside the transparent polystyrene tubes which contained the developed biosensor. For preparing the solutions, a Vortex mixer from Labnet International (New Jersey, USA) was used.
4.3. Preparation of the Biosensor
The preparation of the biosensor was carried out by covalent immobilization of HRP on functionalized PDMS deposited into a polystyrene tube. The PDMS polymer was formed on the bottom of the tube by depositing a mixture of 200 μL of the PDMS elastomer base and the curing reagent in a 10:1 (v/v) proportion and curing the mixture at 30 °C for 24 h. The PDMS surface was activated by adding an acidic solution containing H2O, 37% HCl, and 30% H2O2 in a 5:1:1 (v/v/v) ratio. After 2 h, the tube was washed with distilled water. The amino-silanization process was carried out by incubating the modified PDMS surface with the solution A, which contained APTMS and drying the tube at 70 °C for 2 h. The resulting modified PDMS surface was treated with a 5% w/w GTA solution in order to form a Schiff base. Then, the tubes were washed two times with phosphate buffer solution pH = 7 and two times with distilled water. Finally, the functionalized PDMS surface was incubated with a HRP enzyme solution (between 0.005 and 5 mg·mL–1) for 1 h. Thereafter, the tube was washed three times with phosphate buffer solution pH = 7.
4.4. Measuring the Activity of the Immobilized HRP
A calibration curve in solution was carried out for determining the activity of the immobilized HRP. Two calibration curves were obtained by keeping H2O2 and luminol concentration constant (50 or 2.5 μM and 17.5 mM, respectively) and varying the HRP concentration between 0.004 and 0.022 mg mL–1. Therefore, the luminescence signal obtained with the biosensor by adding 50 μM (incubated with HRP enzyme solution between 0.005 and 5 mg·mL–1) or 2.5 μM of H2O2 (incubated with HRP enzyme solutions of 0.1 and 1 mg·mL–1) and 17.5 mM of luminol was interpolated in the calibration curve. The measurements were carried out after 10 s of the H2O2 addition with a portable luminometer for transduction.
4.5. Kinetic Analysis
A kinetic study has been carried out in solution by adding 10 μL of 0.01 mg·mL–1 of HRP to the tube containing 200 μL of 35 mM luminol (buffer 0.3 M HCO3–/CO3–2 pH = 10.8) and a variable concentration of H2O2 (0.5–20 μM). Moreover, the same procedure was carried out with the biosensor in the tube, which contained the immobilized HRP. The luminescent signal was captured at 0 and 40 s in both cases. Time 0 was established as the first measurement after the addition of the H2O2 standard. The reaction rate was calculated by the difference between both signals.
Vmax and Km parameters were estimated through the Lineweaver–Burk linearization (eq 1), where 1/v was plotted against 1/|S|. Vmax is the velocity that would be reached when all the enzyme active sites are saturated with the substrate, and Km is defined as the substrate concentration at which a half of the active sites are filled; these parameters characterize the affinity of the enzyme to the substrate.
| 1 |
4.6. Analytical Parameters
The linear range was defined by plotting the luminescence signal at 10 s versus H2O2 concentration, and the correlation coefficient had to be better than 0.99. The assays were carried out with the tube, which contained the HRP immobilized. Two hundred microliters of 35 mM luminol was added, followed by 200 μL of H2O2 standard solution between 0.05 and 200 μM. The detection limit (LOD) was calculated as 3 Sblank/b, where b is the slope of the linear calibration curve and Sblank is the standard deviation of blank solutions (n = 10). Precision was evaluated (n = 3) and expressed as intra- and interday relative standard deviations (RSDs) under experimental conditions (200 μL of 10 μM H2O2 and 200 μL of 35 mM luminol) for standards in the linear interval. Stability was estimated by comparing the response of three sensors over several months after their storage at −20 °C. The biosensor reusability was studied using freshly prepared solution of H2O2 with fixed concentration (50 μM); the biosensor was used up to 150 times.
4.7. Analysis of Culture Medium Containing Cells
Samples of culture medium DMEM-F12 GlutaMAX Supplement incubated with neuroblast cells have been analyzed. The medium also contains 10% fetal bovine serum, l-glutamine, and penicillin–streptomycin. The samples were stored at −70 °C in the freezer. After melting the samples, they were diluted 10 times with water. To carry out the analysis, 200 μL of 35 mM luminol was placed in the tube containing the biosensor with the enzyme bounded; then, 200 μL of the diluted samples were added in order to start the reaction. The CL signal was captured at 10 s.
4.8. Analysis of Corega Oxigen Bio-Active
One tablet of Corega Oxígeno Bio-Activo was dissolved in 100 mL of water with or without a denture. The H2O2 released from tablets was measured for up to 3 min (time recommended to clean the denture by Corega). At different times, 200 μL of the sample was taken and diluted in 10 mL of water. To carry out the analysis, 200 μL of luminol 35 mM was placed on the biosensor, and then, 200 μL of the diluted samples was added in order to start the reaction. The CL signal was registered at 10 s. The manufacturer indicates that the Na2CO3·2H2O2 concentration is <10%.
Acknowledgments
The authors would like to thank the Cellular and Organic Physiopathology of Oxidative stress and rare diseases (COPOS) research group for supplying the cell culture medium samples. The authors also thank the EU-FEDER and MCIU-AEI (Project CTQ-2017-90082-P) and to the Generalitat Valenciana (PROMETEO Program 2016/109) for financial support. SB expresses her gratitude to the PROMETEO program for her predoctoral grant.
Supporting Information Available
The Supporting Information is available free of charge at https://pubs.acs.org/doi/10.1021/acsomega.9b03958.
Concentration of enzyme dissolution used to immobilize it in the activated PDMS surface; calibration graph used for estimating the active amount of HRP in the biosensor; and kinetic assays and analysis of Corega Oxígeno Bio-Activo tablets (PDF)
The authors declare no competing financial interest.
Supplementary Material
References
- Addepalli S.; Roy R.; Axinte D.; Mehnen J. In-situ inspection technologies: Trends in degradation assessment and associated technologies. Procedia CIRP 2017, 59, 35–40. 10.1016/j.procir.2016.10.003. [DOI] [Google Scholar]
- Bocanegra-Rodríguez S.; Jornet-Martínez N.; Molins-Legua C.; Campíns-Falcó P. Delivering Inorganic and Organic Reagents and Enzymes from Zein and Developing Optical Sensors. Anal. Chem. 2018, 90, 8501–8508. 10.1021/acs.analchem.8b01338. [DOI] [PubMed] [Google Scholar]
- Jornet-Martínez N.; Moliner-Martínez Y.; Molins-Legua C.; Campíns-Falcó P.. Trends for the Development of In Situ Analysis Devices. Encyclopedia of Analytical Chemistry; John Wiley & Sons, 2017. [Google Scholar]
- Jornet-Martínez N.; Bocanegra-Rodríguez S.; González-Fuenzalida R. A.; Molins-Legua C.; Campíns-Falcó P.. In Situ Analysis Devices for Estimating the Environmental Footprint in Beverages Industry. Processing and Sustainability of Beverages; Elsevier Inc., 2019. [Google Scholar]
- Newman J. D.; Setford S. J. Enzymatic Biosensors. Mol. Biotechnol. 2006, 32, 249–268. 10.1385/mb:32:3:249. [DOI] [PubMed] [Google Scholar]
- Ibarlucea B.; Fernández-Sánchez C.; Demming S.; Büttgenbach S.; Llobera A. Selective functionalisation of PDMS-based photonic lab on a chip for biosensing. Analyst 2011, 136, 3496–3502. 10.1039/c0an00941e. [DOI] [PubMed] [Google Scholar]
- Kreider A.; Richter K.; Sell S.; Fenske M.; Tornow C.; Stenzel V.; Grunwald I. Functionalization of PDMS modified and plasma activated two-component polyurethane coatings by surface attachment of enzymes. Appl. Surf. Sci. 2013, 273, 562–569. 10.1016/j.apsusc.2013.02.080. [DOI] [Google Scholar]
- Sassolas A.; Blum L. J.; Leca-Bouvier B. D. Immobilization strategies to develop enzymatic biosensors. Biotechnol. Adv. 2012, 30, 489–511. 10.1016/j.biotechadv.2011.09.003. [DOI] [PubMed] [Google Scholar]
- Sui G.; Wang J.; Lee C.-C.; Lu W.; Lee S. P.; Leyton J. V.; Wu A. M.; Tseng H.-R. Solution-Phase Surface Modification in Intact Poly (dimethylsiloxane) Microfluidic Channels. Anal. Chem. 2006, 78, 5543–5551. 10.1021/ac060605z. [DOI] [PubMed] [Google Scholar]
- Ensafi A. A.; Abarghoui M. M.; Rezaei B. Electrochemical determination of hydrogen peroxide using copper / porous silicon based non-enzymatic sensor. Sens. Actuators, B 2014, 196, 398–405. 10.1016/j.snb.2014.02.028. [DOI] [Google Scholar]
- Ensafi A. A.; Rezaloo F.; Rezaei B. Electrochemical sensor based on porous silicon / silver nanocomposite for the determination of hydrogen peroxide. Sens. Actuators, B 2016, 231, 239–244. 10.1016/j.snb.2016.03.018. [DOI] [Google Scholar]
- Habibi B.; Jahanbakhshi M. Sensitive determination of hydrogen peroxide based on a novel nonenzymatic electrochemical sensor: silver nanoparticles decorated on nanodiamonds. J. Iran. Chem. Soc. 2015, 12, 1431–1438. 10.1007/s13738-015-0611-2. [DOI] [Google Scholar]
- Nasirizadeh N.; Shekari Z.; Nazari A.; Tabatabaee M. Fabrication of a novel electrochemical sensor for determination of hydrogen peroxide in different fruit juice samples. J. Food Drug Anal. 2016, 24, 72–82. 10.1016/j.jfda.2015.06.006. [DOI] [PMC free article] [PubMed] [Google Scholar]
- Zhai X.; Li Y.; Li J.; Yue C.; Lei X. Electrochemical sensor for detection of hydrogen peroxide modified with prussian blue electrodeposition on nitrogen, phosphorus and sulfur co-doped porous carbons-chitosan. Mater. Sci. Eng. C 2017, 77, 1242–1246. 10.1016/j.msec.2016.11.106. [DOI] [PubMed] [Google Scholar]
- Bai J.; Jiang X. A Facile One-Pot Synthesis of Copper Sul fi de-Decorated Reduced Graphene Oxide Composites for Enhanced Detecting of H2O2 in Biological Environments. Anal. Chem. 2013, 85, 8095–8101. 10.1021/ac400659u. [DOI] [PubMed] [Google Scholar]
- González-sánchez M. I.; González-macia L.; Pérez-prior M. T.; Valero E.; Hancock J.; Killard A. J. Electrochemical detection of extracellular hydrogen peroxide in Arabidopsis thaliana: a real-time marker of oxidative stress. Plant, Cell Environ. 2013, 36, 869–878. 10.1111/pce.12023. [DOI] [PubMed] [Google Scholar]
- Wagner B. A.; Witmer J. R.; van’t Erve T. J.; Buettner G. R. An assay for the rate of removal of extracellular hydrogen peroxide by cells. Redox Biol. 2013, 1, 210–217. 10.1016/j.redox.2013.01.011. [DOI] [PMC free article] [PubMed] [Google Scholar]
- Zong C.; Wang M.; Li B.; Liu X.; Zhao W.; Zhang Q.; Liang A.; Yu Y. Sensing of hydrogen peroxide and glucose in human serum via quenching fluorescence of biomolecule-stabilized Au nanoclusters assisted by the Fenton reaction. RSC Adv. 2017, 7, 26559–26565. 10.1039/c7ra01498h. [DOI] [Google Scholar]
- McDonnell G.; Russell A. D. Antiseptics and Desinfectants: Activity, Action , and Resistance. Clin. Microbiol. Rev. 1999, 12, 147–179. 10.1128/cmr.12.1.147. [DOI] [PMC free article] [PubMed] [Google Scholar]
- Pla-Tolós J.; Moliner-Martinez Y.; Molins-Legua C.; Campins-Falcó P. Colorimetic biosensing dispositive based on reagentless hybrid biocomposite : Application to hydrogen peroxide determination. Sens. Actuators, B 2016, 231, 837–846. 10.1016/j.snb.2016.03.094. [DOI] [Google Scholar]
- Meng Y.; High K.; Antonello J.; Washabaugh M. W.; Zhao Q. Enhanced sensitivity and precision in an enzyme-linked immunosorbent assay with fluorogenic substrates compared with commonly used chromogenic substrates. Anal. Biochem. 2005, 345, 227–236. 10.1016/j.ab.2005.07.026. [DOI] [PubMed] [Google Scholar]
- Wang G.-L.; Hu X.-L.; Wu X.-M.; Li Z.-J. Quantum dots-based glucose sensing through fluorescence quenching by bienzyme-catalyzed chromogenic substrate oxidation. Sens. Actuators, B 2014, 205, 61–66. 10.1016/j.snb.2014.08.053. [DOI] [Google Scholar]
- Feyzizarnagh H.; Park B.-W.; Sharma L.; Patania M. M.; Yoon D. Y.; Kim D.-S. Amperometric mediatorless hydrogen peroxide sensor with horseradish peroxidase encapsulated in peptide nanotubes. Sens. Bio-Sensing Res. 2016, 7, 38–41. 10.1016/j.sbsr.2015.12.003. [DOI] [Google Scholar]
- Liu Y.; Liu X.; Guo Z.; Hu Z.; Xue Z.; Lu X. Horseradish peroxidase supported on porous graphene as a novel sensing platform for detection of hydrogen peroxide in living cells sensitively. Biosens. Bioelectron. 2017, 87, 101–107. 10.1016/j.bios.2016.08.015. [DOI] [PubMed] [Google Scholar]
- Silwana B.; Van Der Horst C.; Iwuoha E.; Somerset V. Evaluation of a reduced graphene oxide antimony nanocomposite horseradish peroxidase biosensor matrix for hydrogen peroxide. Procedia Technol 2017, 27, 172–176. 10.1016/j.protcy.2017.04.075. [DOI] [Google Scholar]
- Dai H.; Lü W.; Zuo X.; Zhu Q.; Pan C.; Niu X.; Liu J.; Chen H.; Chen X. A novel biosensor based on boronic acid functionalized metal-organic frameworks for the determination of hydrogen peroxide released from living cells, Biosens. Bioelectron 2017, 95, 131–137. 10.1016/j.bios.2017.04.021. [DOI] [PubMed] [Google Scholar]
- Kalantar-Dehnavi A.; Rezaei-Zarchi S.; Mazaheri Gh.; Negahdary M.; Malekzadeh R.; Mazdapour M. Designing a H2O2 biosensor by using of modified graphite electrode with nano-composite of nafion-nile blue.peroxidase enzyme. Eur. J. Exp. Biol. 2012, 2, 672e82. [Google Scholar]
- Vianello F.; Zennaro L.; Rigo A. A coulometric biosensor to determine hydrogen peroxide using a monomolecular layer of horseradish peroxidase immobilized on a glass surface. Biosens. Bioelectron. 2007, 22, 2694–2699. 10.1016/j.bios.2006.11.007. [DOI] [PubMed] [Google Scholar]
- Burmistrova N. A.; Meier R. J.; Schreml S.; Duerkop A. Reusable optical sensing microplate for hydrogen peroxide using a fluorescent photoinduced electron transfer probe (HP Green ). Sens. Actuators, B 2014, 193, 799–805. 10.1016/j.snb.2013.12.025. [DOI] [Google Scholar]
- Li F.; Ma W.; Liu J.; Wu X.; Wang Y.; He J. Luminol, horseradish peroxidase , and glucose oxidase ternary functionalized graphene oxide for ultrasensitive glucose sensing. Anal. Bioanal. Chem. 2018, 410, 543–552. 10.1007/s00216-017-0752-5. [DOI] [PubMed] [Google Scholar]
- Liu J.; Lu L.; Li A.; Tang J.; Wang S.; Xu S.; Wang L. Simultaneous detection of hydrogen peroxide and glucose in human serum with upconversion luminescence. J. Biosens. Bioelectron. 2015, 68, 204–209. 10.1016/j.bios.2014.12.053. [DOI] [PubMed] [Google Scholar]
- Luo M.; Wang W.; Zhao Q.; Li M.; Chen Y.; Lu Z.; Liu K.; Wang D. Chemiluminescence biosensor for hydrogen peroxide determination by immobilizing horseradish peroxidase onto PVA- co -PE nano fiber membrane. Eur. Polym. J. 2017, 91, 307–314. 10.1016/j.eurpolymj.2017.04.018. [DOI] [Google Scholar]
- Díaz A. N.; Peinado M. C. R.; Minguez M. C. T. Sol-gel horseradish peroxidase biosensor for hydrogen peroxide detection by chemiluminescence. Anal. Chim. Acta 1998, 363, 221–227. 10.1016/s0003-2670(98)00080-4. [DOI] [Google Scholar]
- Sun J.; Ge J.; Liu W.; Lan M.; Zhang H.; Wang P.; Wang Y.; Niu Z. Multi-enzyme co-embedded organic–inorganic hybrid nanoflowers: synthesis and application as a colorimetric sensor. Nanoscale 2014, 6, 255–262. 10.1039/c3nr04425d. [DOI] [PubMed] [Google Scholar]
- Meier J.; M Hofferber E.; A Stapleton J.; M Iverson N. Hydrogen Peroxide Sensors for Biomedical Applications. Chemosensors 2019, 7, 64. 10.3390/chemosensors7040064. [DOI] [Google Scholar]
- Qian P.; Qin Y.; Lyu Y.; Li Y.; Wang L.; Wang S.; Liu Y. A hierarchical cobalt/carbon nanotube hybrid nanocomplex-based ratiometric fluorescent nanosensor for ultrasensitive detection of hydrogen peroxide and glucose in human serum. Anal. Bioanal. Chem. 2019, 411, 1517–1524. 10.1007/s00216-019-01573-z. [DOI] [PubMed] [Google Scholar]
- Żamojć K.; Zdrowowicz M.; Jacewicz D.; Wyrzykowski D.; Chmurzynski L. Fluorescent Probes Used for Detection of Hydrogen Peroxide under Biological Conditions. Crit. Rev. Anal. Chem. 2016, 46, 171–200. 10.1080/10408347.2015.1014085. [DOI] [PubMed] [Google Scholar]
- Li H.; Liu C.; Wang D.; Zhang C. Chemiluminescence cloth-based glucose test sensors (CCGTSs): A new class of chemiluminescence glucose sensors. Biosens. Bioelectron. 2017, 91, 268–275. 10.1016/j.bios.2016.12.004. [DOI] [PubMed] [Google Scholar]
- Guo J.-Z.; Cui H.; Zhou W.; Wang W. Ag nanoparticle-catalyzed chemiluminescent reaction between luminol and hydrogen peroxide. J. Photochem. Photobiol., A 2008, 193, 89–96. 10.1016/j.jphotochem.2007.04.034. [DOI] [Google Scholar]
- Mahbub P.; Zakaria P.; Guijt R.; Macka M.; Dicinoski G.; Breadmore M.; Nesterenko P. N. Flow injection analysis of organic peroxide explosives using acid degradation and chemiluminescent detection of released hydrogen peroxide. Talanta 2015, 143, 191–197. 10.1016/j.talanta.2015.05.052. [DOI] [PubMed] [Google Scholar]
- Morales T. V.; Esponda S. M.; Juan J.; Rodríguez S. Luminescence methods for study and determination of pollutants in the environment. Maced. J. Chem. Chem. Eng. 2010, 29, 1–42. [Google Scholar]
- Jornet-Martínez N.; Moliner-Martínez Y.; Herráez-Hernández R.; Molins-Legua C.; Verdú-Andrés J.; Campíns-Falcó P. Designing solid optical sensors for in situ passive discrimination of volatile amines based on a new one-step hydrophilic PDMS preparation. Sens. Actuators, B 2016, 223, 333–342. 10.1016/j.snb.2015.09.097. [DOI] [Google Scholar]
- Khan P.; Idrees D.; Moxley M. A.; Corbett J. A.; Ahmad F.; von Figura G.; Sly W. S.; Waheed A.; Hassan M. I. Luminol-Based Chemiluminescent Signals: Clinical and Non-clinical Application and Future Uses. Appl. Biochem. Biotechnol. 2014, 173, 333–355. 10.1007/s12010-014-0850-1. [DOI] [PMC free article] [PubMed] [Google Scholar]
- Halldorsson S.; Lucumi E.; Gómez-Sjöberg R.; Fleming R. M. T. Advantages and challenges of microfluidic cell culture in polydimethylsiloxane devices. Biosens. Bioelectron. 2015, 63, 218–231. 10.1016/j.bios.2014.07.029. [DOI] [PubMed] [Google Scholar]
- Sharma P.; Kannoujia D. K.; Basir S. F.; Nahar P. Rapid Immobilization of Enzymes onto Solid Supports by Ultrasound Waves. Artificial Cells, Blood Substitutes, and Biotechnology 2011, 39, 289–292. 10.3109/10731199.2011.563361. [DOI] [PubMed] [Google Scholar]
- Kaur J.; Singh K. V.; Raje M.; Varshney G. C.; Suri C. R. Strategies for direct attachment of hapten to a polystyrene support for applications in enzyme-linked immunosorbent assay (ELISA). Anal. Chim. Acta 2004, 506, 133–135. 10.1016/j.aca.2003.11.009. [DOI] [Google Scholar]
Associated Data
This section collects any data citations, data availability statements, or supplementary materials included in this article.