Abstract
Epithelial ovarian cancer (EOC) is the most common cause of gynecological cancer death. Recent studies have reported that iron overload could accelerate cancer progression. TFRC is an important participant in intracellular iron transport, and we noticed that it was abnormally overexpressed in EOC; however, its specific role in EOC remained unclear. Therefore, our study aimed to reveal the clinical significance and biological function of TFRC in human EOC. First, we detected dramatically increased TFRC expression in EOC tissues, which was associated with a worse prognosis for patients. Subsequently, we verified that TFRC knockdown significantly inhibited the proliferation and metastasis of EOC cells (SKOV3 and A2780) in vitro and in vivo. More significantly, we demonstrated that TFRC-mediated proliferation and metastasis of EOC cells resulted from its positive regulation of AXIN2 expression. In conclusion, our findings suggest that TFRC accelerates the progression of EOC by promoting cancer cell proliferation and metastasis via upregulation of AXIN2 expression, which highlights its potential as a novel therapeutic target for human EOC.
Keywords: TFRC, AXIN2, ovarian cancer, proliferation, metastasis
Introduction
Ovarian cancer is currently the leading cause of gynecological malignancy-related deaths due to its propensity to recur and metastasize [1-3]. Epithelial carcinomas account for 90% of all ovarian cancer cases [1]. Despite advances in treatment, the 5-year survival rate of epithelial ovarian cancer (EOC) remains at 46% [4]. Accordingly, further elucidation of the molecular mechanism of EOC progression will contribute to the exploration of novel effective therapeutic strategies.
Recently, some research has indicated that iron levels in ovarian cancer patients are abnormally upregulated, and relevant clinical studies have reported that continuous iron stimulation is a notable risk factor for ovarian cancer and that a low-iron diet could effectively inhibit tumor growth [5-7]. More importantly, further evidence has demonstrated that iron overload can induce tumorigenesis and accelerate cancer progression [8-11].
The transferrin receptor (TFRC), also known as CD71, is an essential membrane protein regulating intracellular iron transport [12,13]. Although several reports have documented abnormal TFRC overexpression in some human tumors, such as anaplastic thyroid carcinoma and astrocytic brain tumor [14,15], the expression pattern and the molecular mechanism of TFRC in EOC has not yet been definitely elucidated.
In this study, we first found that TFRC expression was significantly increased in human EOC tissues, especially in metastases, and this overexpression of TFRC was directly associated with poor prognosis. Then, we established stable TFRC-knockdown EOC cell lines (SKOV3 and A2780) for both in vitro and in vivo experiments. Our results demonstrate that TFRC knockdown suppressed EOC cell proliferation, migration and invasion in vitro and inhibited tumor growth and metastasis in vivo. Moreover, our research further indicated that TFRC promoted EOC cell proliferation and migration by positively regulating AXIN2, a molecule that has been reported to play a crucial role in cell proliferation and metastasis [16-18]. In summary, our findings suggest that TFRC promotes EOC cell proliferation and metastasis via upregulation of AXIN2 expression, which accelerates the progression of EOC, highlighting that TFRC may be a novel therapeutic target for human OEC treatment.
Materials and methods
Clinical specimen collection
Fresh surgical specimens were collected from EOC patients during surgery at Xinqiao Hospital (Chongqing, China). We defined the epithelial ovarian carcinoma as the tumor tissue and the adjacent non-tumor part of the ovary from the same patient as the normal tissue. Hematoxylin and eosin (H&E) staining of these tissues was verified by two separate pathologists. The tissues were divided into three parts: one was used for the flow cytometry assay, one was preserved in 4% paraformaldehyde (Beyotime Biotechnology), and the rest was frozen in liquid nitrogen. This study was approved by the Institutional Review Board of Xinqiao Hospital, and informed consent was obtained from all individuals.
Cell culture and transfection
The human EOC cell lines (SKOV3 and A2780) were obtained from the American Type Culture Collection (ATCC, Manassas, VA, USA) and were recently authenticated. The cell lines were cultured in RPMI 1640 (Thermo Fisher Scientific) supplemented with 10% FBS (Beyotime Biotechnology, C0252), 100 IU/mL penicillin and 100 mg/mL streptomycin (Thermo Fisher Scientific). All cells were incubated in a humidified atmosphere containing 5% CO2 at 37°C.
TFRC-specific and negative control (NC) short hairpin RNAs (shRNAs) were packaged into the lentivirus by OBiO Technology Corp., Ltd. (Shanghai, China). The AXIN2-specific small interfering RNAs (siRNAs), NC siRNA, AXIN2 overexpression plasmid and control plasmid were chemically synthesized by GenePharma (Shanghai, China). The sequences are listed in Table 1. Cells were seeded into 6-well plates and transfected following the manufacturer’s protocols. After 48 h, the cells were harvested for subsequent experiments. The efficiencies were evaluated by qRT-PCR, Western blot and flow cytometry analyses.
Table 1.
Primer, shRNA and siRNA sequences and their targets
| Target | Sequence | |
|---|---|---|
| β-actin | Forward | 5’-CCTGGCACCCAGCACAAT-3’ |
| Reverse | 5’-GGGCCGGACTCGTCATAC-3’ | |
| TFRC | Forward | 5’-GGCTACTTGGGCTATTGTAAAGG-3’ |
| Reverse | 5’-CAGTTTCTCCGACAACTTTCTCT-3’ | |
| AXIN2 | Forward | 5’-AGCCAAAGCGATCTACAAAAGG-3’ |
| Reverse | 5’-AAGTCAAAAACATCTGGTAGGCA-3’ | |
| sh1-TFRC | Forward | 5’-GCCCAGAUGUUCUCAGAUATT-3’ |
| Reverse | 5’-UAUCUGAGAACAUCUGGGCTT-3’ | |
| sh2-TFRC | Forward | 5’-GGCCAGCAAAGUUGAGAAATT-3’ |
| Reverse | 5’-UUUCUCAACUUUGCUGGCCTT-3’ | |
| si1-AXIN2 | Forward | 5’-GCGUGGAUACCUUAGACUUTT-3’ |
| Reverse | 5’-AAGUCUAAGGUAUCCACGCTT-3’ | |
| si2-AXIN2 | Forward | 5’-CCAAGUGUCUCUACCUCAUTT-3’ |
| Reverse | 5’-AUGAGGUAGAGACACUUGGTT-3’ | |
| NC | Forward | 5’-UUCUCCGAACGUGUCACGUTT-3’ |
| Reverse | 5’-ACGUGACACGUUCGGAGAATT-3’ |
RNA extraction and quantitative reverse transcription PCR (qRT-PCR)
Total RNA was extracted from cells/tissues using RNAiso Plus (TaKaRa, Tokyo, Japan), and a cDNA Reverse Transcription Kit (TaKaRa, Tokyo, Japan) was used to generate high-fidelity cDNA. Quantitative reverse transcription PCR was performed with a SYBR Kit (TaKaRa, Tokyo, Japan), according to the manufacturer’s protocol, to quantify the relative mRNA expression. The 2-ΔΔCt quantification method was used, and β-actin was used as the normalization control. The primer sequences are listed in Table 1.
Western blot analysis
Total protein was extracted using RIPA buffer (Beyotime Biotechnology) containing 1% protease inhibitor and phenylmethylsulfonyl fluoride (PMSF; Beyotime Biotechnology). After blocking, the PVDF membranes (Millipore, New Bedford, MA, USA) were incubated overnight at 4°C with the primary antibodies anti-TFRC (Abcam, ab8598, 1:100) and anti-β-actin (Cell Signaling Technology, 3700S, 1:1000). The next day, after incubation with the appropriate secondary antibodies, BeyoECL Plus (Beyotime Biotechnology) was used to detect the bands. A Chemilmanger™ 5500 system (Alpha Innotech, San Jose, CA, USA) was used to visualize the results.
Flow cytometry
To exclude dead cells, Fixable Viability Dye eFluor® (Thermo Fisher Scientific, lot 4333605, 1:1000) was used. Then, the cells were stained with the following human antibodies: anti-CD45 (BioLegend, clone HI30, lot B203213, 3:100), anti-TFRC (BioLegend, clone CY1G4, lot B248488, 3:100), anti-Ki-67 (BioLegend, clone Ki-67, lot B227294, 1:20), and anti-AXIN2 (primary antibody: Abcam, ab32197, 1:50; secondary antibody: Thermo Fisher Scientific, lot 1951988, 1:200). These antibodies were used according to the manufacturer’s protocol, and a BD FACSCalibur flow cytometer was used for flow cytometry analyses.
Immunofluorescence
Frozen tissues were fixed in ice-cold 4% paraformaldehyde (Beyotime Biotechnology) for 15 minutes and blocked for 20 minutes. Subsequently, the samples were incubated with a primary antibody against TFRC (Abcam, ab8598, 1:200) overnight at 4°C. After three washes with PBS, the samples were stained with a secondary antibody (Abcam, ab150113, 1:500) for 30 minutes at 37°C, and the nuclei were then counterstained with DAPI (Beyotime Biotechnology). Stained tissues were visualized with an Olympus confocal microscope (Olympus Corp., Tokyo, Japan).
Immunohistochemistry
After deparaffinization, the tissue sections were incubated with boiled citrate buffer for 15 minutes and 3% hydrogen peroxide for 10 minutes. After blocking, the sections were incubated at 4°C overnight with the primary antibodies anti-TFRC (Abcam, ab84036, 1:200) and anti-AXIN2 (Abcam, ab32197, 1:200). Then, the sections were incubated with a secondary antibody (Abcam, ab150075, 1:500), and images were collected by microscopy (Olympus, Tokyo, Japan). The intensity score (0-3) and the score reflecting the percentage of positive cells (0=0%, 1=1-24.9%, 2=25-49.9%, 3=50-74.9%, 4=75-100%) were multiplied to calculate the overall IHC score. The intensity of positive cells was verified by two separate pathologists. Image-Pro Plus 6.0 software was used to assess the percentage of positive cells.
Cell Counting Kit-8 (CCK-8) assay
Cell Counting Kit-8 (Dojindo, Kumamoto, Japan) was used for this assay. Cells (3×10³/well) were seeded into 5 individual 96-well plates. For the first plate, 3 h after seeding, 110 µL of new complete medium containing 10 µL of CCK-8 solution was added to each well to replace the previous medium. Two hours later, the absorbance at 450 nm was measured with an iMARK (Bio-Rad Laboratories Inc., Hercules, CA, USA). We repeated the protocol at the same time for the next 4 days.
5-Ethynyl-2’-deoxyuridine (EdU) assay
An iClickTM EdU Andy FluorTM 647 Flow Cytometry Assay Kit (GeneCopoeia, Rockville, MD, USA) was used for this experiment. Cells (2×10⁵) were seeded into each well of 12-well plates. After 24 h, 30 µM EdU was added to each well. Four hours later, the cells were harvested, stained and detected according to the recommended protocol. Flow cytometry (BD Biosciences, San Jose, CA, USA) was performed following the manufacturer’s instructions. Finally, we analyzed the results with FlowJo software.
Cell cycle assay
After the addition of 1 mL of precooled 70% ethanol, the cells were incubated at 4°C overnight. On the second day, we stained cells with a Cell Cycle and Apoptosis Analysis Kit (Beyotime Biotechnology) following the manufacturer’s protocol. The stained cells were detected by flow cytometry (BD Biosciences, San Jose, CA, USA). ModFit LT software was used to measure the results.
Transwell assay
Mitomycin C (MedChemExpress) at a concentration of 10 µg/mL was used to exclude the effect of cell proliferation. Twenty-four-well culture inserts with an 8.0-µm pore polycarbonate membrane (Millipore, Billerica, MA, USA) were used. For the migration assay, 5×10⁴ cells were seeded into the upper chamber with 200 µL of medium containing 2% FBS, and 800 µL of medium with 12% FBS was added to the lower chamber. Then, the plates were incubated for 24 h. For the invasion assay, 30 µL of Matrigel (BD Biosciences, Franklin Lakes, NJ, USA) was precoated on each filter for 3 h. Cells (1×10⁵) were seeded as mentioned above and then cultured for 48 h. After removing the residual cells in the upper chamber, the cells on the lower surface of the membrane were stained with a 0.1% crystal violet solution. Five viewing fields were selected randomly by microscopy (Olympus, Tokyo, Japan), and the number of stained metastases was assessed with Image-Pro Plus 6.0 software.
In vivo xenograft experiments
The animal experiments were approved by the Institutional Animal Care and Use Committee (IACUC). Five-week-old female BALB/c mice were purchased from the Chinese Academy of Medical Sciences (Beijing, China). These mice were housed in SPF conditions. Xenografts of tumor cells (2×10⁶) were generated via subcutaneous injection in the right flank of each mouse. Beginning on the tenth day, the tumor volume was measured every two days. Tumor volumes were estimated by measuring the longest and shortest diameters of the tumors. On the 18th day, the mice were sacrificed, and the volumes and weights of the tumors were obtained. For the tumor metastasis model, 1.5×10⁶ cells were injected intraperitoneally into each mouse. After 4 weeks, the mice were sacrificed, and H&E staining of metastases was verified by two separate pathologists. Tumor cell metastasis was also monitored with a bioluminescence imaging IVIS 200 system (Xenogen Biosciences, Cranbury, NJ, USA).
RNA sequencing (RNA-seq)
Total RNA was extracted and quantified according to the manufacturer’s instructions. RNA-seq libraries of these RNA samples were constructed according to the technical protocol. The final libraries were amplified with phi29 (Thermo Fisher Scientific, MA, USA), and DNBs were loaded into the patterned nanoarray. Single-end 50-base reads were generated on the BGISEQ-500 platform (BGI-Shenzhen, China). Differentially expressed genes (DEGs) were selected according to the criteria of a fold change ≥2 and Q value (adjusted P value) ≤0.001.
Database analysis
Survival data of EOC patients were obtained from the Kaplan-Meier plotter (http://kmplot.com/analysis/) [19] or the PROGgeneV2 prognostic database (http://www.compbio.iupui.edu/proggene) [20]. Currently, these databases integrate gene expression and clinical data from various cancer types. The cohorts were split based on high and low TFRC/AXIN2 expression. The overall survival rate was analyzed with an autoselect best cutoff. Relapse-free survival was analyzed using PROGgeneV2. TFRC expression data of EOC patients with metastases in their veins or lymph nodes were obtained from University of California Santa Cruz (UCSC) Xena (https://xena.ucsc.edu) [21], and cohorts were split according to the median of patients’ TFRC expression. The expression data of TFRC, AXIN2, Ki-67, PCNA, TWIST and MMP9 in the same patient cohort were obtained from Gene Expression Omnibus (GEO) database at the National Center for Biotechnology Information (http://www.ncbi.nlm.nih.gov/geo) [22].
Statistical analysis
All data are presented as the mean ± standard deviation (SD), and all experiments were repeated independently at least three times under the same conditions. Statistical significance was assessed by performing Student’s t-test, two-way ANOVA with Tukey’s multiple comparison post-test, or Pearson’s correlation coefficients. Statistically significant P values are indicated as *P<0.05, **P<0.01, ***P<0.001, and ****P<0.0001. All statistical analyses were performed using GraphPad Prism 6.0 (GraphPad Software, Inc., La Jolla, CA, USA).
Results
TFRC is overexpressed in EOC and correlates with poor prognosis
First, we observed TFRC expression in human EOC specimens and paired nontumor normal tissues from a total of 10 patients. The results of flow cytometry and immunofluorescence staining revealed that TFRC expression was dramatically higher in tumor tissues than in paired normal tissues (n=10, P=0.0002; Figure 1A and 1B). Further data showed that metastatic tissues had even higher TFRC expression (n=8, P=0.0012; Figure 1C and 1D).
Figure 1.
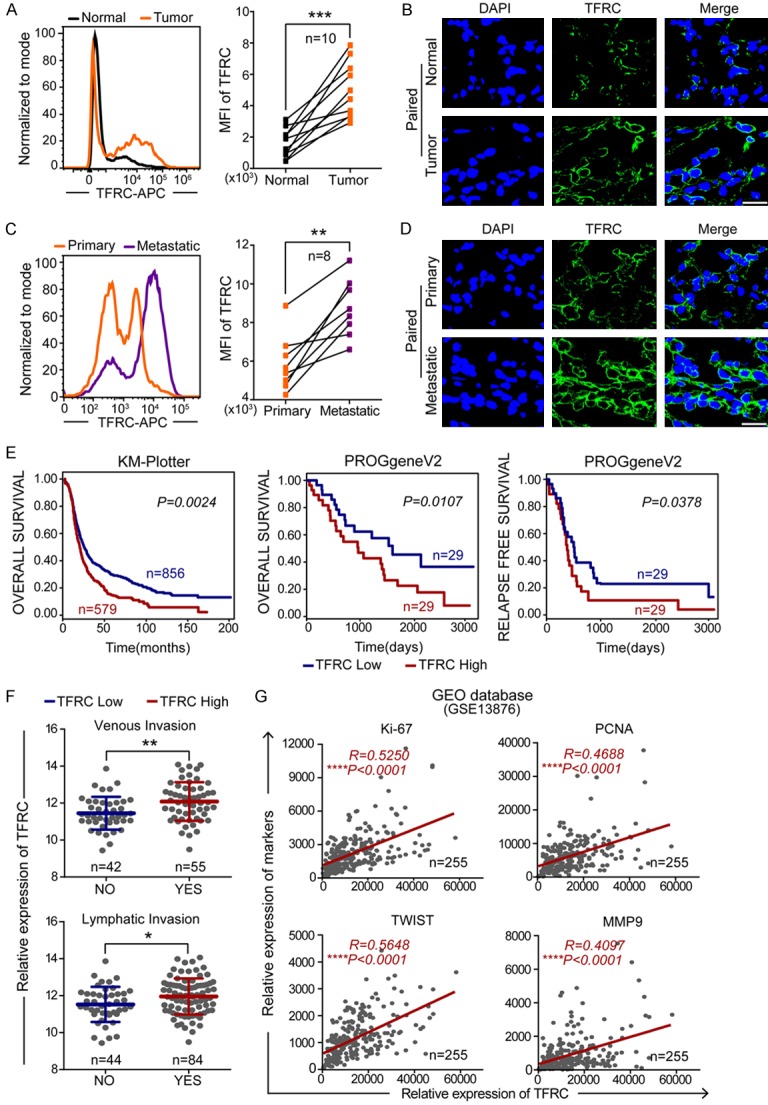
TFRC is overexpressed in EOC and correlates with the prognosis of patients. A, B. Flow cytometry and immunofluorescence showing TFRC expression in EOC and paired normal ovarian tissues (scale bar, 20 μm). C, D. Flow cytometry and immunofluorescence showing TFRC expression in metastatic and paired primary EOC tissues (scale bar, 20 μm). E. The overall survival curve and relapse-free survival curve of ovarian cancer patients from the KM-Plotter and PROgeneV2 websites. F. Data from the UCSC Xena website showed that ovarian cancer patients with high TFRC expression more commonly experienced metastases in their veins or lymph nodes. G. Positive correlation between the expression of TFRC and cell proliferation/metastasis markers in ovarian cancer patients from the GEO database (GSE13876). *P<0.05, **P<0.01, ***P<0.001.
Then, to explore the prognostic value of TFRC in EOC patients, we performed survival analyses and found that high TFRC expression was strongly associated with a poor overall survival rate in ovarian cancer patients (Kaplan-Meier plotter: P=0.0024; PROGgeneV2: P=0.0107; Figure 1E). The data also showed that TFRC overexpression was negatively associated with relapse-free survival time in ovarian cancer patients (PROGgeneV2: P=0.0378; Figure 1E). Additionally, online analyses using the UCSC Xena website revealed that ovarian cancer patients with high TFRC expression were more likely to have metastases in their veins or lymph nodes (venous invasion: P=0.0022; lymphatic invasion: P=0.0181; Figure 1F). It is well known that unregulated cell proliferation and tumor metastasis have a well-established link to rapid tumor progression and poor prognosis [23]. Therefore, we performed correlation analyses with ovarian cancer data from the GEO database (GSE13876) to evaluate whether TFRC is related to cell proliferation and metastasis. The results showed that TFRC expression was significantly positively correlated with cell proliferation/metastasis markers (Ki-67, R=0.5250, P<0.0001; PCNA, R=0.4688, P<0.0001; TWIST, R=0.5648, P<0.0001; and MMP9, R=0.4097, P<0.0001; Figure 1G).
Collectively, these findings indicated that TFRC is a significant prognostic indicator in EOC patients. Moreover, TFRC involvement in the progression of EOC probably occurred through its induction of cancer cell proliferation and metastasis.
Targeting TFRC in EOC cells suppresses cell proliferation and inhibits tumor growth
Considering that TFRC was highly expressed in EOC tissues, we subsequently targeted TFRC to explore its potential therapeutic value in human EOC. Therefore, we generated stable TFRC downregulation EOC cell lines by using two TFRC-specific shRNAs (sh1-TFRC and sh2-TFRC) lentivirus transfection. Fluorescence microscopy (Figure 2A) and flow cytometry (Figure 2B) analyses showed a high transfection rate of lentiviral vectors. The qRT-PCR (Figure 2C), Western blot (Figure 2D) and flow cytometry (Figure 2E and 2F) analyses demonstrated that the expression of TFRC was successfully downregulated at both the mRNA and protein levels in EOC cells.
Figure 2.
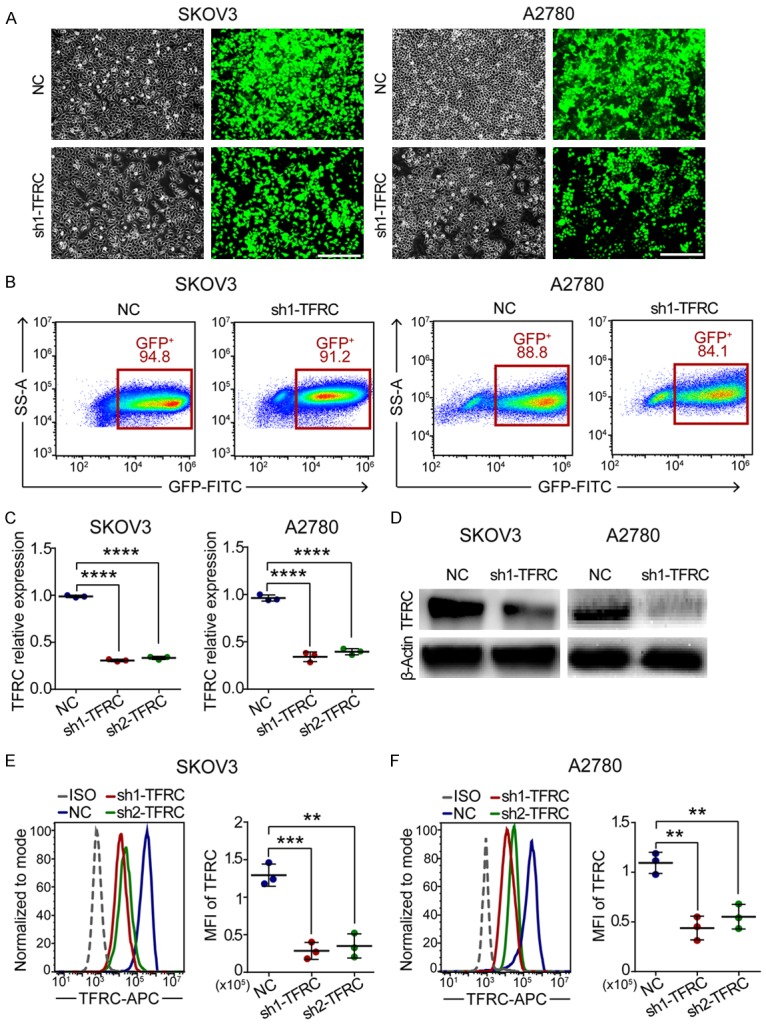
Stable TFRC-knockdown EOC cell lines were established using lentivirus transfection. A. Morphological images of EOC cells transfected with NC or sh1-TFRC lentiviral vectors: the left shows all cells; the right shows stable transfected cells (scale bar, 200 μm). B. Flow sorting of the abovementioned cells. C. qRT-PCR for TFRC mRNA expression. D-F. Western blot and flow cytometry showing TFRC protein expression. All experiments were performed independently at least three times, and the data are expressed as the mean ± SD. *P<0.05, **P<0.01, ***P<0.001 and ****P<0.0001.
Consistent with our database findings, the flow cytometry results of EOC tissues showed that higher TFRC expression correlated with higher Ki-67 expression (n=12, P=0.0018; Figure 3A), which suggested that TFRC might be involved in EOC cell proliferation. Thus, we subsequently performed CCK-8 and EdU assays to investigate the function of TFRC on the proliferation of EOC cells. The CCK-8 assay results revealed that from the 3rd day, the absorbance (corresponding to viability) was dramatically lower in TFRC-downregulated cells than in NC cells (Figure 3B). Furthermore, the EdU-positive cell rates were markedly decreased in the sh1-TFRC group compared with the NC group (Figure 3C). These findings indicated that TFRC knockdown inhibited the proliferation of EOC cells in vitro.
Figure 3.
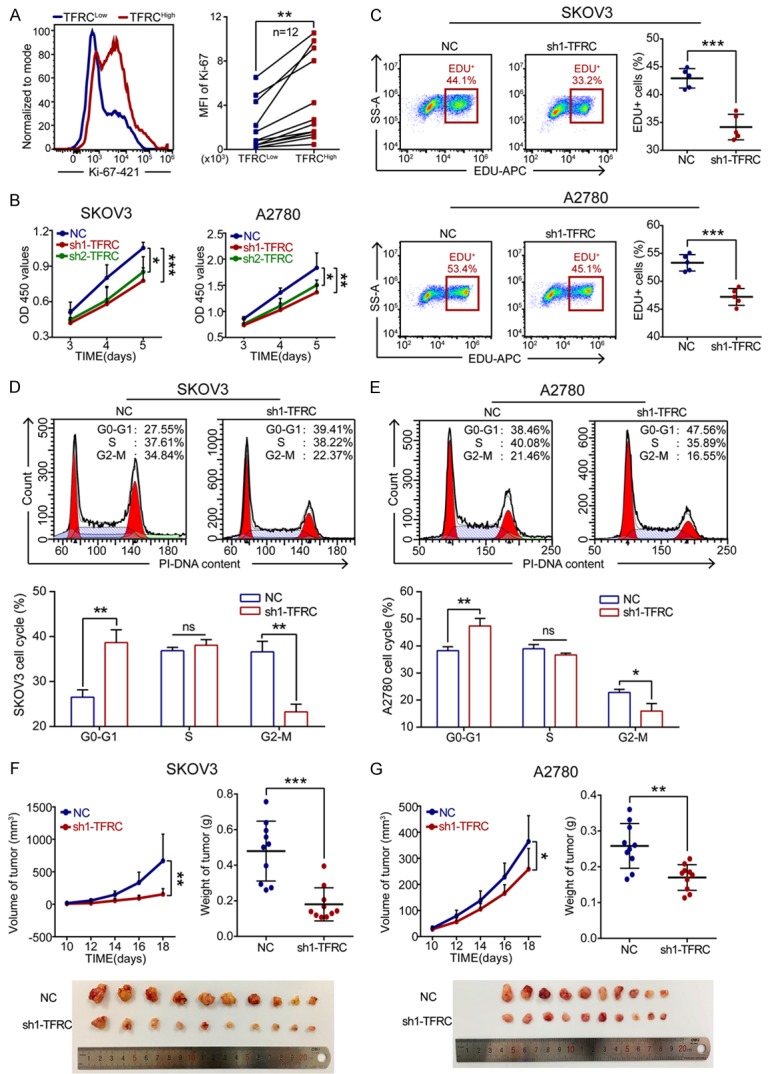
TFRC knockdown suppresses EOC cell proliferation in vitro and in vivo. A. Flow cytometry for Ki-67 expression in high TFRC expression tissues (TFRCHigh) and paired low TFRC expression tissues (TFRCLow) from EOC patients. B. A CCK-8 assay was performed to evaluate the effect of TFRC knockdown on EOC cell proliferation. C. Cell proliferation rates were determined by EdU assay. D, E. Cell cycle analysis of the NC- or sh1-TFRC-transfected cells. F, G. TFRC knockdown in EOC cells inhibited tumor growth in vivo. All experiments were performed independently at least three times, and the data are expressed as the mean ± SD. *P<0.05, **P<0.01, ***P<0.001 and ****P<0.0001.
The cell cycle is closely related to cell proliferation. Thus, we next examined the effect of TFRC silencing on the cell cycle progression of EOC cells. Compared with the NC group, the sh1-TFRC group exhibited a significant increase in the number of G0-G1 phase cells and a decrease in the number of G2-M phase cells for both SKOV3 and A2780 cell lines (Figure 3D and 3E). However, there were no significant differences in the number of cells in S phase between the two groups. Together, these data indicated that TFRC knockdown induced EOC cell G1 phase arrest and inhibited mitosis to suppress EOC cell proliferation in vitro.
To assess whether TFRC knockdown influences EOC cell proliferation in vivo, NC- or sh1-TFRC-transfected EOC cells were injected subcutaneously into nude mice. On day 18 after injection, the mice were sacrificed and analyzed. The results showed that compared to the tumors in the NC group, those in the sh1-TFRC group exhibited apparently reduced volumes and weights (Figure 3F and 3G). These data indicated that TFRC knockdown in EOC cells suppressed tumor growth in vivo.
Targeting TFRC in EOC cells suppresses cell migration and inhibits tumor metastasis
Tumor metastasis is another important determinant of cancer prognosis [24]. Accordingly, we examined the effects of TFRC knockdown on the migration and invasion of EOC cells. The transwell assay results revealed that TFRC silencing led to a noticeable reduction in the number of migrated and invaded EOC cells (Figure 4A and 4B). These data indicated that TFRC knockdown weakened the migratory and invasive abilities of EOC cells in vitro.
Figure 4.
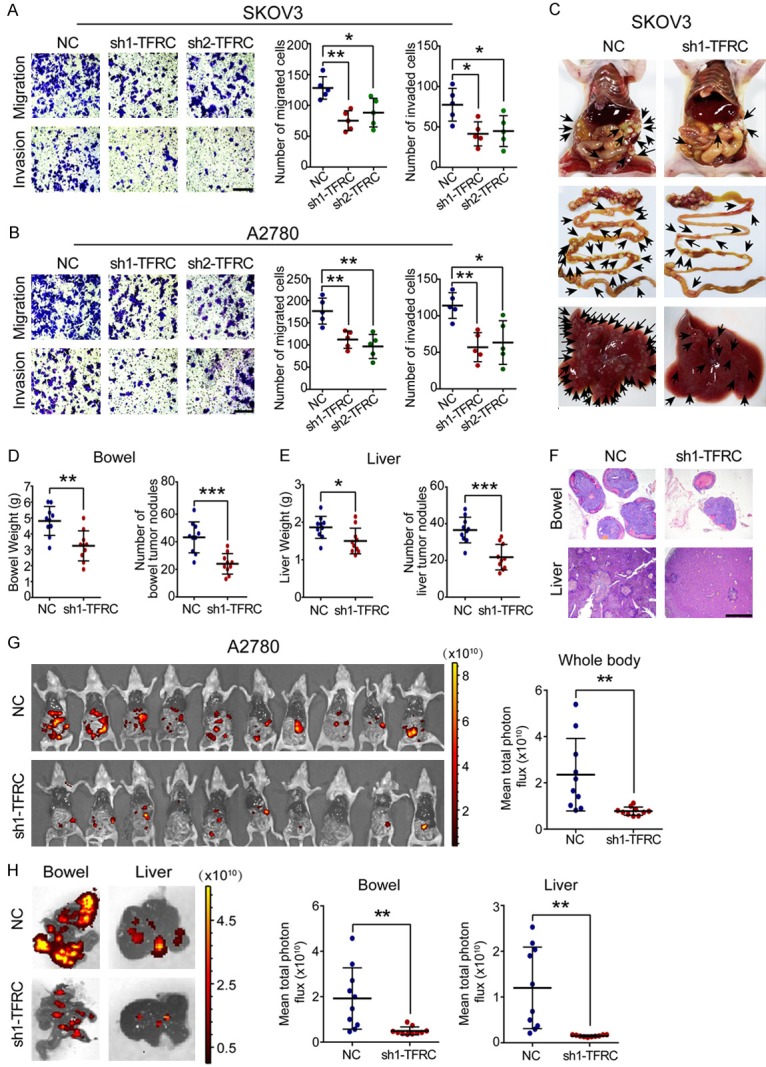
TFRC knockdown suppresses EOC cell metastasis in vitro and in vivo. (A, B) A transwell assay was performed to evaluate the effect of TFRC knockdown on EOC cell metastasis (scale bar, 100 μm). (C) TFRC knockdown in SKOV3 cells inhibited tumor metastasis in vivo. Representative images of the whole body, bowel and liver are shown in sequence. (D, E) Statistical analysis results of the data obtained in (B) are shown. (F) H&E staining was performed to confirm the metastatic tumors (scale bar, 1 nm). (G) The metastasis of A2780 cells in vivo was monitored by bioluminescence imaging. Whole-body images of mice and statistical analysis results are shown. (H) Representative fluorescence images of the bowel/liver and statistical analysis results are shown. All experiments were performed independently at least three times, and the data are expressed as the mean ± SD. *P<0.05, **P<0.01, ***P<0.001 and ****P<0.0001.
Subsequently, we established a tumor metastasis model by intraperitoneally injecting nude mice with EOC cells. We obtained results on day 28 after injection. After injection with SKOV3 cells, the TFRC-knockdown mice had fewer metastases than the NC mice, especially in the bowel and liver tissues (Figure 4C). The bowel/liver weights and metastatic nodules were significantly decreased in mice injected with sh1-TFRC SKOV3 cells (Figure 4D and 4E). Our H&E staining results confirmed that these niduses were metastases induced by SKOV3 cells (Figure 4F). Moreover, the bioluminescence imaging results revealed that substantial tumor metastasis attenuation throughout the whole body in mice transplanted with sh1-TFRC-transfected A2780 cells compared to those transplanted with negative control A2780 cells (Figure 4G). We similarly analyzed the liver and bowel tissues of these mice. The results showed that the sh1-TFRC group exhibited fewer tumor cell metastases (Figure 4H). Together, these data indicated that silencing TFRC expression inhibited EOC cell metastasis in vivo.
Targeting TFRC in EOC cells induces the downregulation of AXIN2
To address the underlying molecular mechanism responsible for TFRC-mediated EOC cell proliferation and metastasis, we used RNA-seq analysis to compare the gene expression of NC-transfected and sh1-TFRC-transfected EOC cells (SKOV3 cell line). There were 311 downregulated genes and 249 upregulated genes in the sh1-TFRC group after TFRC knockdown (Figure 5A). As these genes were involved in various cell functions, we performed a functional enrichment analysis with the Gene Ontology (GO) database, and a comprehensive analysis combining the rich ratio, Q value (adjusted P value) and gene number showed that changes in the following cell functions were significantly enriched: migration regulation (first), proliferation regulation (fourth) and cell cycle regulation (tenth) (Figure 5B). We further analyzed the downregulated genes with functions in cell proliferation and migration and showed that genes with positive regulation capacity changed more obviously than those with negative regulation capacity (Figure 5C). These data were consistent with our previous findings, which indicated that a loss of TFRC function attenuated cell proliferation and metastasis in EOC. Among the relevant genes mentioned above, the axis inhibition protein 2 (AXIN2) showed a dramatic decrease, as evidenced by the heatmap (Figure 5D). To the best of our knowledge, AXIN2 was an important participant in the regulation of cell proliferation, migration and other cell functions [16-18], and AXIN2 was recently reported as an oncogene in several human cancers [25-27]. Thus, we ultimately focused on AXIN2 for further mechanism exploration. However, this did not rule out the possibility that TFRC might work via other proliferation/metastasis-related genes shown in the heatmap, which need more research to verify.
Figure 5.
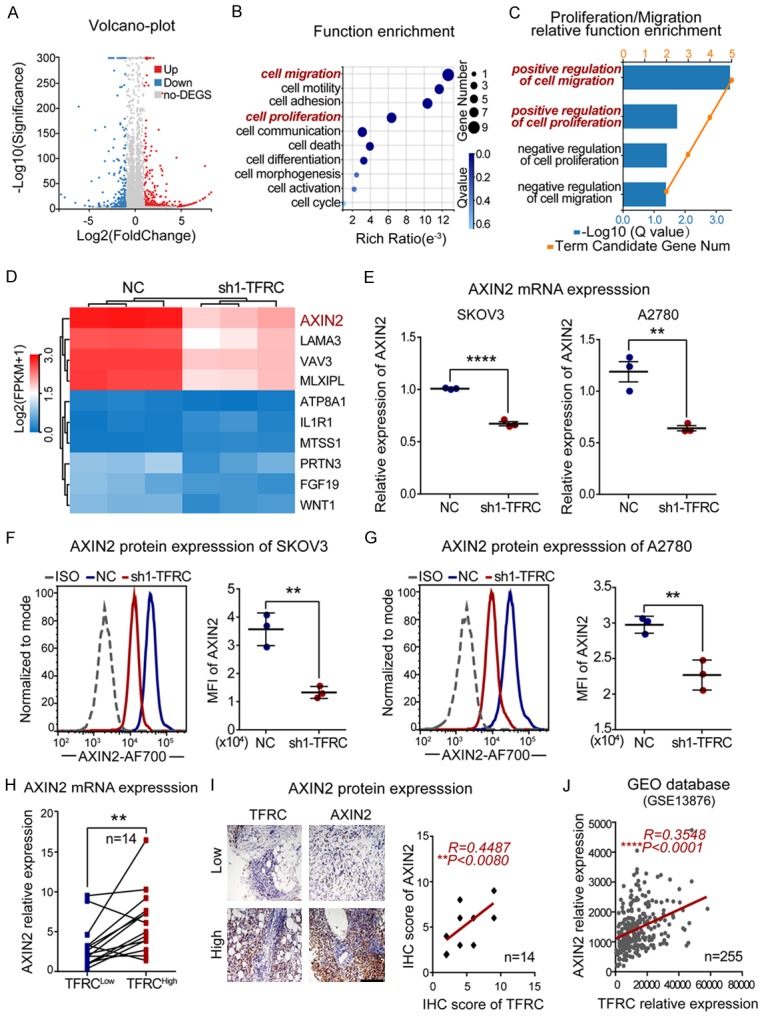
TFRC positively regulates AXIN2 expression in EOC. A. A volcano plot from the RNA-seq analysis shows that the expression of 560 genes was changed (311 downregulated and 249 upregulated) after TFRC knockdown. B. Gene function enrichment analysis was performed with the Gene Ontology (GO) database. C. Genes positively regulating cell proliferation and migration were obviously enriched after TFRC knockdown. D. The heatmap shows that AXIN2 decreased most obviously among the abovementioned genes. E-G. qRT-PCR and flow cytometry results showing AXIN2 mRNA and protein expression in NC- or sh1-TFRC-transfected EOC cells. H. qRT-PCR showing AXIN2 mRNA expression in high TFRC expression tissues (TFRCHigh) and paired low TFRC expression tissues (TFRCLow) from EOC patients. I. Immunohistochemistry showing AXIN2 protein expression in the abovementioned tissues (scale bar, 200 μm) and the statistical analysis results. J. Positive correlation between the expression of TFRC and AXIN2 in ovarian cancer patients from the GEO database (GSE13876). All experiments were performed independently at least three times, and the data are expressed as the mean ± SD. *P<0.05, **P<0.01, ***P<0.001 and ****P<0.0001.
Subsequently, our qRT-PCR and flow cytometry results regarding EOC cells showed that TFRC knockdown induced a decrease in AXIN2 expression at both the mRNA and protein levels (Figure 5E-G). More importantly, our human EOC tissue results verified a positive association between TFRC and AXIN2 at both the mRNA and protein levels (Figure 5H and 5I), and a correlation analysis with GEO data (GSE13876) also supported this positive association (R=0.3548, P<0.0001; Figure 5J). Together, these data indicated that TFRC knockdown induced the downregulation of AXIN2, and the expression levels of TFRC and AXIN2 were closely and positively associated in EOC. According to the abovementioned results, AXIN2 might be involved in TFRC-mediated cell proliferation and metastasis regulation in human EOC.
TFRC regulates the proliferation and migration of EOC cells via AXIN2 expression
To validate the role of AXIN2 in EOC, we knocked down AXIN2 expression in SKOV3 and A2780 cells by using two AXIN2-specific siRNAs (si1-AXIN2 and si2-AXIN2) and found that AXIN2 expression was effectively downregulated at both the mRNA and protein levels (Figure 6A and 6B). Then, the results of CCK-8, EdU and transwell assays revealed that the AXIN2-deficient cells exhibited marked decreases in cell absorbance (Figure 6C), the EdU-positive cell rate (Figure 6D) and the number of migrated cancer cells (Figure 6E). Furthermore, correlation analyses with GEO data (GSE13876) also revealed that AXIN2 expression was positively associated with cell proliferation/metastasis markers (Ki-67, R=0.5127, P<0.0001; PCNA, R=0.2712, P<0.0001; TWIST, R=0.4723, P<0.0001; and MMP9, R=0.2578, P<0.0001; Figure 6F), and a survival analysis performed by Kaplan-Meier Plotter showed that high AXIN2 expression predicted a poor survival outcome in ovarian cancer patients (P=0.0014; Figure 6G).
Figure 6.
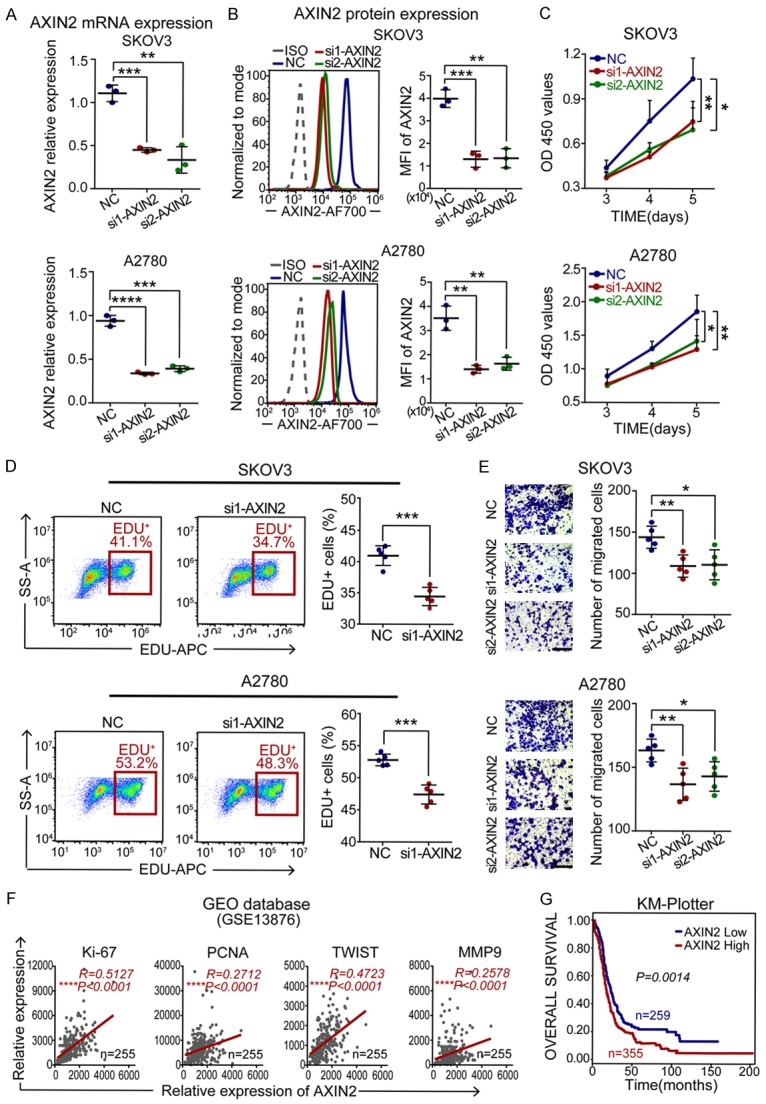
AXIN2 knockdown inhibits EOC cell proliferation and migration. A, B. qRT-PCR and flow cytometry for AXIN2 mRNA and protein expression in NC- or si-AXIN2-transfected EOC cells. C. A CCK-8 assay was performed to evaluate the effect of AXIN2 knockdown on EOC cell proliferation. D. Cell proliferation rates were determined by EdU assay. E. A transwell assay was performed to evaluate cell migration ability (scale bar, 100 μm). F. Positive correlation between the expression of AXIN2 and cell proliferation/metastasis markers in ovarian cancer patients from the GEO database (GSE13876). G. An overall survival curve of ovarian cancer patients from the KM-Plotter website. All experiments were performed independently at least three times, and the data are expressed as the mean ± SD. *P<0.05, **P<0.01, ***P<0.001 and ****P<0.0001.
Subsequently, the AXIN2 plasmid was employed to further determine the relationship between TFRC and AXIN2. As shown in Figure 7A-D, the mRNA and protein levels of AXIN2 were significantly upregulated in the AXIN2 overexpression (OE-AXIN2) group. Then, the CCK-8 assay results showed that compared with the NC and sh1-TFRC groups, the OE-AXIN2 and cotransfection groups had enhanced cell absorbance (Figure 7E and 7F). The transwell assay results showed that there were more migrated cancer cells in the AXIN2-upregulated groups (Figure 7G and 7H). Overall, these data suggested that AXIN2 overexpression could promote EOC cell proliferation and migration and, more importantly, reverse the inhibition caused by TFRC knockdown.
Figure 7.
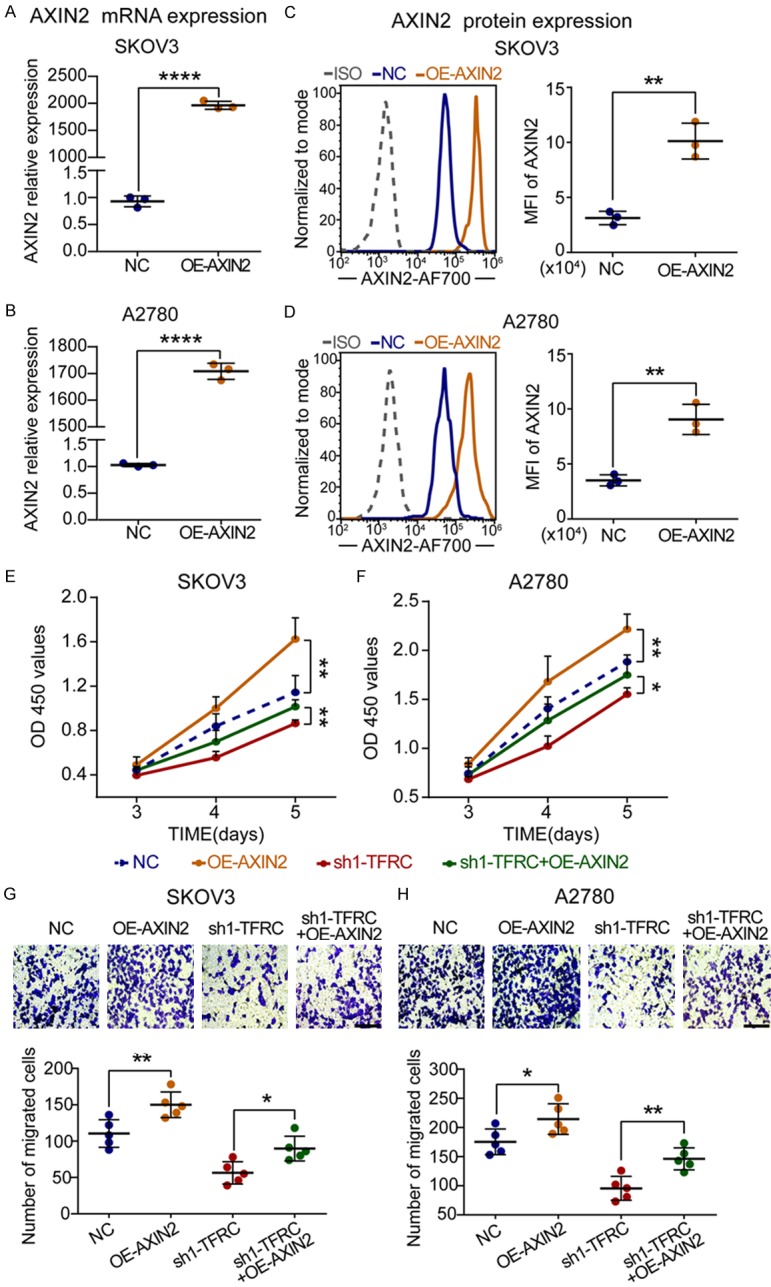
AXIN2 overexpression promotes EOC cell proliferation and migration. A-D. qRT-PCR and flow cytometry for AXIN2 mRNA and protein expression in NC- or overexpression-AXIN2-transfected EOC cells. E, F. A CCK-8 assay was performed to evaluate the effect of AXIN2 upregulation on EOC cell proliferation. G, H. A transwell assay was performed to evaluate cell migration ability (scale bar, 100 μm). All experiments were performed independently at least three times, and the data are expressed as the mean ± SD. *P<0.05, **P<0.01, ***P<0.001 and ****P<0.0001.
Taken together, these findings further confirmed that TFRC-mediated proliferation and metastasis in EOC cells occurred via the expression of AXIN2 and that AXIN2 might be an independent prognostic indicator in human EOC.
Discussion
EOC is the most common type of ovarian cancer, and its 5-year survival rate remains low due to its propensity to recur and metastasize [1-4]. Accordingly, a better understanding of the molecular mechanism underlying EOC progression is urgently needed to facilitate the development of effective therapeutic strategies. As a crucial membrane protein regulating intracellular iron transport, TFRC has been found to be abnormally overexpressed in several human tumor tissues [13-15]. However, little is known about the specific role of TFRC in the progression of EOC.
In our study, we observed a noteworthy increase in TFRC expression in human EOC tissues, which was directly associated with poor prognosis in patients. More importantly, the expression of TFRC and the levels of cell proliferation/metastasis-related biomarkers were strongly and positively correlated. These findings suggested a previously unrecognized conclusion that TFRC might play an oncogenic role in the pathological process of EOC by promoting the proliferation and metastasis of cancer cells. Indeed, we subsequently verified that TFRC knockdown apparently suppressed EOC cell proliferation, migration and invasion in vitro and inhibited tumor growth and metastasis in vivo.
Our research next focused on the underlying target molecule regulated by TFRC in EOC. AXIN2, which is an intracellular protein encoded by the axis formation inhibitor (AXIN) gene, has been confirmed to be an important participant in the regulation of cell proliferation, migration and other cell functions [16-18]. AXIN2 was already well known as a tumor suppressor [28,29]. However, recent studies have reported that AXIN2 functions as an oncogene in breast cancer, colorectal cancer and other cancers [25-27]. More importantly, consistent with our findings, several studies have noted that AXIN2 is highly expressed and associated with poor prognosis in ovarian cancer patients [30,31]. According to our findings that there is a positive correlation between AXIN2 and TFRC and that the former plays a crucial role in the development of cancer, we speculated that TFRC might accelerate EOC progression by regulating AXIN2. Our current results revealed that AXIN2 overexpression in ovarian cancer indicated a poor prognosis in patients and was positively associated with cell proliferation/metastasis-related biomarkers. Significantly, TFRC knockdown induced the downregulation of AXIN2, and there was a positive correlation between TFRC and AXIN2 in both EOC tissues and cells. In addition, our experimental results showed that AXIN2 downregulation could suppress cell proliferation and migration; conversely, its upregulation could promote cell proliferation and migration and reverse the attenuated abilities caused by targeting TFRC. Although the specific mechanism of how TFRC modulated AXIN2 expression remained unclear in our present study, we provided a direction for future exploration of TFRC in human EOC.
In summary, we demonstrated that TFRC is remarkably overexpressed in EOC and is negatively associated with the prognosis of patients. TFRC knockdown dramatically suppresses EOC cell proliferation, migration and invasion in vitro and inhibits tumor growth and metastasis in vivo. Additionally, our study further indicated that TFRC-mediated proliferation and metastasis in EOC cells result from its positive regulation of AXIN2 expression. Taken together, all of our findings suggest that TFRC is a significant indicator of prognosis in EOC, and its future development as a potential novel therapeutic target in human EOC seems promising.
Acknowledgements
This work was supported by the National Natural Science Foundation of China (81372271); and the Science and Technology Innovation Project of Social Career and People’s Livelihood Guarantee of Chongqing (cstc2016shms-ztzx10004). In addition, we thank Ph.D. Long, sincerely, for her patience, support and help all along.
Disclosure of conflict of interest
None.
References
- 1.Torre LA, Trabert B, DeSantis CE, Miller KD, Samimi G, Runowicz CD, Gaudet MM, Jemal A, Siegel RL. Ovarian cancer statistics, 2018. CA Cancer J Clin. 2018;68:284–296. doi: 10.3322/caac.21456. [DOI] [PMC free article] [PubMed] [Google Scholar]
- 2.Pignata S, Cecere S, Du Bois A, Harter P, Heitz F. Treatment of recurrent ovarian cancer. Ann Oncol. 2017;28(Suppl 8):viii51–viii56. doi: 10.1093/annonc/mdx441. [DOI] [PubMed] [Google Scholar]
- 3.Lengyel E. Ovarian cancer development and metastasis. Am J Pathol. 2010;177:1053–64. doi: 10.2353/ajpath.2010.100105. [DOI] [PMC free article] [PubMed] [Google Scholar]
- 4.Lheureux S, Gourley C, Vergote I, Oza AM. Epithelial ovarian cancer. Lancet. 2019;393:1240–53. doi: 10.1016/S0140-6736(18)32552-2. [DOI] [PubMed] [Google Scholar]
- 5.Rockfield S, Raffel J, Mehta R, Rehman N, Nanjundan M. Iron overload and altered iron metabolism in ovarian cancer. Biol Chem. 2017;398:995–1007. doi: 10.1515/hsz-2016-0336. [DOI] [PMC free article] [PubMed] [Google Scholar]
- 6.Lattuada D, Uberti F, Colciaghi B, Morsanuto V, Maldi E, Squarzanti DF, Molinari C, Boldorini R, Bulfoni A, Colombo P, Bolis G. Fimbrial cells exposure to catalytic iron mimics carcinogenic changes. Int J Gynecol Cancer. 2015;25:389–98. doi: 10.1097/IGC.0000000000000379. [DOI] [PubMed] [Google Scholar]
- 7.Radulescu S, Brookes MJ, Salgueiro P, Ridgway RA, McGhee E, Anderson K, Ford SJ, Stones DH, Iqbal TH, Tselepis C, Sansom OJ. Luminal iron levels govern intestinal tumorigenesis after Apc loss in vivo. Cell Rep. 2012;2:270–82. doi: 10.1016/j.celrep.2012.07.003. [DOI] [PubMed] [Google Scholar]
- 8.Torti SV, Torti FM. Iron and cancer: more ore to be mined. Nat Rev Cancer. 2013;13:342–55. doi: 10.1038/nrc3495. [DOI] [PMC free article] [PubMed] [Google Scholar]
- 9.Jung M, Weigert A, Mertens C, Rehwald C, Brüne B. Iron handling in tumor-associated macrophages-Is there a new role for lipocalin-2? Front Immunol. 2017;8:1171. doi: 10.3389/fimmu.2017.01171. [DOI] [PMC free article] [PubMed] [Google Scholar]
- 10.Boult J, Roberts K, Brookes MJ, Hughes S, Bury JP, Cross SS, Anderson GJ, Spychal R, Iqbal T, Tselepis C. Overexpression of cellular iron import proteins is associated with malignant progression of esophageal adenocarcinoma. Clin Cancer Res. 2008;14:379–87. doi: 10.1158/1078-0432.CCR-07-1054. [DOI] [PubMed] [Google Scholar]
- 11.Schoenfeld JD, Sibenaller ZA, Mapuskar KA, Wagner BA, Cramer-Morales KL, Furqan M, Sandhu S, Carlisle TL, Smith MC, Abu Hejleh T, Berg DJ, Zhang J, Keech J, Parekh KR, Bhatia S, Monga V, Bodeker KL, Ahmann L, Vollstedt S, Brown H, Shanahan Kauffman EP, Schall ME, Hohl RJ, Clamon GH, Greenlee JD, Howard MA, Schultz MK, Smith BJ, Riley DP, Domann FE, Cullen JJ, Buettner GR, Buatti JM, Spitz DR, Allen BG. O2- and H2O2-mediated disruption of Fe metabolism causes the differential susceptibility of NSCLC and GBM cancer cells to pharmacological ascorbate. Cancer Cell. 2017;31:487–500. e8. doi: 10.1016/j.ccell.2017.02.018. [DOI] [PMC free article] [PubMed] [Google Scholar]
- 12.Aisen P. Transferrin receptor 1. Int J Biochem Cell Biol. 2004;36:2137–43. doi: 10.1016/j.biocel.2004.02.007. [DOI] [PubMed] [Google Scholar]
- 13.Zanganeh S, Hutter G, Spitler R, Lenkov O, Mahmoudi M, Shaw A, Pajarinen JS, Nejadnik H, Goodman S, Moseley M, Coussens LM, Daldrup-Link HE. Iron oxide nanoparticles inhibit tumour growth by inducing pro-inflammatory macrophage polarization in tumour tissues. Nat Nanotechnol. 2016;11:986–94. doi: 10.1038/nnano.2016.168. [DOI] [PMC free article] [PubMed] [Google Scholar]
- 14.Parenti R, Salvatorelli L, Magro G. Anaplastic thyroid carcinoma: current treatments and potential new therapeutic options with emphasis on TfR1/CD71. Int J Endocrinol. 2014;2014:685396. doi: 10.1155/2014/685396. [DOI] [PMC free article] [PubMed] [Google Scholar]
- 15.Rosager AM, Sørensen MD, Dahlrot RH, Hansen S, Schonberg DL, Rich JN, Lathia JD, Kristensen BW. Transferrin receptor-1 and ferritin heavy and light chains in astrocytic brain tumors: expression and prognostic value. PLoS One. 2017;12:e0182954. doi: 10.1371/journal.pone.0182954. [DOI] [PMC free article] [PubMed] [Google Scholar]
- 16.Zeng L, Fagotto F, Zhang T, Hsu W, Vasicek TJ, Perry WL 3rd, Lee JJ, Tilghman SM, Gumbiner BM, Costantini F. The mouse Fused locus encodes axin, an inhibitor of the Wnt signaling pathway that regulates embryonic axis formation. Cell. 1997;90:181–92. doi: 10.1016/s0092-8674(00)80324-4. [DOI] [PubMed] [Google Scholar]
- 17.Li S, Wang C, Liu X, Hua S, Liu X. The roles of AXIN2 in tumorigenesis and epigenetic regulation. Fam Cancer. 2015;14:325–31. doi: 10.1007/s10689-014-9775-7. [DOI] [PubMed] [Google Scholar]
- 18.Reya T, Clevers H. Wnt signalling in stem cells and cancer. Nature. 2005;434:843–50. doi: 10.1038/nature03319. [DOI] [PubMed] [Google Scholar]
- 19.Gyorffy B, Lánczky A, Szállási Z. Implementing an online tool for genomewide validation of survival-associated biomarkers in ovarian-cancer using microarray data from 1287 patients. Endocr Relat Cancer. 2012;19:197–208. doi: 10.1530/ERC-11-0329. [DOI] [PubMed] [Google Scholar]
- 20.Goswami CP, Nakshatri H. PROGgeneV2: enhancements on the existing database. BMC Cancer. 2014;14:970. doi: 10.1186/1471-2407-14-970. [DOI] [PMC free article] [PubMed] [Google Scholar]
- 21.Liu J, Li T, Liu XL. DDA1 is induced by NR2F6 in ovarian cancer and predicts poor survival outcome. Eur Rev Med Pharmacol Sci. 2017;21:1206–13. [PubMed] [Google Scholar]
- 22.Crijns AP, Fehrmann RS, de Jong S, Gerbens F, Meersma GJ, Klip HG, Hollema H, Hofstra RM, te Meerman GJ, de Vries EG, van der Zee AG. Survival-related profile, pathways, and transcription factors in ovarian cancer. PLoS Med. 2009;6:e24. doi: 10.1371/journal.pmed.1000024. [DOI] [PMC free article] [PubMed] [Google Scholar]
- 23.Li R, Peng C, Zhang X, Wu Y, Pan S, Xiao Y. Roles of Arf6 in cancer cell invasion, metastasis and proliferation. Life Sci. 2017;182:80–4. doi: 10.1016/j.lfs.2017.06.008. [DOI] [PubMed] [Google Scholar]
- 24.Wan L, Pantel K, Kang Y. Tumor metastasis: moving new biological insights into the clinic. Nat Med. 2013;19:1450–64. doi: 10.1038/nm.3391. [DOI] [PubMed] [Google Scholar]
- 25.Wu ZQ, Brabletz T, Fearon E, Willis AL, Hu CY, Li XY, Weiss SJ. Canonical Wnt suppressor, Axin2, promotes colon carcinoma oncogenic activity. Proc Natl Acad Sci U S A. 2012;109:11312–7. doi: 10.1073/pnas.1203015109. [DOI] [PMC free article] [PubMed] [Google Scholar]
- 26.Liu J, Pan S, Hsieh MH, Ng N, Sun F, Wang T, Kasibhatla S, Schuller AG, Li AG, Cheng D, Li J, Tompkins C, Pferdekamper A, Steffy A, Cheng J, Kowal C, Phung V, Guo G, Wang Y, Graham MP, Flynn S, Brenner JC, Li C, Villarroel MC, Schultz PG, Wu X, McNamara P, Sellers WR, Petruzzelli L, Boral AL, Seidel HM, McLaughlin ME, Che J, Carey TE, Vanasse G, Harris JL. Targeting Wnt-driven cancer through the inhibition of Porcupine by LGK974. Proc Natl Acad Sci U S A. 2013;110:20224–9. doi: 10.1073/pnas.1314239110. [DOI] [PMC free article] [PubMed] [Google Scholar]
- 27.Jiang X, Hao HX, Growney JD, Woolfenden S, Bottiglio C, Ng N, Lu B, Hsieh MH, Bagdasarian L, Meyer R, Smith TR, Avello M, Charlat O, Xie Y, Porter JA, Pan S, Liu J, McLaughlin ME, Cong F. Inactivating mutations of RNF43 confer Wnt dependency in pancreatic ductal adenocarcinoma. Proc Natl Acad Sci U S A. 2013;110:12649–54. doi: 10.1073/pnas.1307218110. [DOI] [PMC free article] [PubMed] [Google Scholar]
- 28.Salahshor S, Woodgett JR. The links between axin and carcinogenesis. J Clin Pathol. 2005;58:225–36. doi: 10.1136/jcp.2003.009506. [DOI] [PMC free article] [PubMed] [Google Scholar]
- 29.Li Y, Jin K, Van Pelt GW, van Dam H, Yu X, Mesker WE, Ten Dijke P, Zhou F, Zhang L. c-Myb enhances breast cancer invasion and metastasis through the Wnt/β-catenin/Axin2 pathway. Cancer Res. 2016;76:3364–75. doi: 10.1158/0008-5472.CAN-15-2302. [DOI] [PubMed] [Google Scholar]
- 30.Boone JD, Arend RC, Johnston BE, Cooper SJ, Gilchrist SA, Oelschlager DK, Grizzle WE, McGwin G Jr, Gangrade A, Straughn JM Jr, Buchsbaum DJ. Targeting the Wnt/β-catenin pathway in primary ovarian cancer with the porcupine inhibitor WNT974. Lab Investig. 2016;96:249–59. doi: 10.1038/labinvest.2015.150. [DOI] [PubMed] [Google Scholar]
- 31.Schmid S, Bieber M, Zhang F, Zhang M, He B, Jablons D, Teng NN. Wnt and hedgehog gene pathway expression in serous ovarian cancer. Int J Gynecol Cancer. 2011;21:975–80. doi: 10.1097/IGC.0b013e31821caa6f. [DOI] [PMC free article] [PubMed] [Google Scholar]


