Abstract
Radiosensitivity varies among patients with non-small cell lung cancer (NSCLC). In this work, we aimed to investigate microRNAs associated with this heterogeneity among individuals. We selected miR-1246 from the microRNAs that were revealed by microarray experiments to be differentially expressed between radioresistant and parental cell lines. Both intracellular and extracellular miR-1246 was found to be upregulated after irradiation in a time-dependent pattern, resulting in increased radioresistance of NSCLC cells. We found that mTOR was a direct target gene of miR-1246, which mediated miR-1246-induced autophagy activation. Yin Yang-1 (YY1) was demonstrated to be a new transcription factor that regulates miR-1246 and CDR1as was found to be a circular RNA that sequesters miR-1246, which was confirmed in NSCLC cells and clinical samples. Finally, combining these data with the results from The Cancer Genome Atlas (TCGA), we verified that miR-1246 could be used as a biomarker to predict NSCLC patients’ radiosensitivity and prognosis. Overall, our study fully investigated the effect of miR-1246 on radiosensitivity and comprehensively investigated the potential of miR-1246 as a prognostic biomarker and radiotherapy sensitization target.
Keywords: miR-1246, mTOR, YY1, CDR1as, radiosensitivity, autophagy
Introduction
Lung cancer is one of the leading causes of mortality among cancer types worldwide, in both men and women, and in both developed and developing countries [1,2]. Radiotherapy is a major treatment for patients with both non-small cell lung cancer (NSCLC) and small cell lung cancer (SCLC), especially in patients with advanced cancer [3]. However, the sensitivity of patients to irradiation varies, especially in patients with NSCLC [4]. Many fundamental mechanisms, autophagy in particular, have been confirmed to be associated with radiotherapy efficacy [5]. Irradiation can damage both DNA and extranuclear targets, which causes changes in autophagy levels via activation of many signaling pathways [6]. This, in turn, influences cellular responses to irradiation.
The DNA damage response (DDR) is another significant response mechanism. Irradiation-induced DDR provides various ways to modulate patients’ radiosensitivity. Evidence of a link between DDR and autophagy has emerged in recent years; this may be mediated by inhibition of autophagy, promotion of autophagy, and alterations in the outcome of autophagy [7]. Feng et al. suggested that the DDR inhibited the pivotal autophagy gene mTORC1 by targeting genes downstream of p53, including the AMPK regulatory subunit (AMPKβ), PTEN, and TSC2 [8]. Wang et al. found that the suppression of DNA damage-induced histone H2A ubiquitination was dependent on SQSTM1/p62, which is a substrate and a target for degradation by autophagy [9]. However, although microRNAs (miRNAs) are crucial regulatory factors in signaling pathways and are indicators of the efficiency of radiotherapy [10], there has been little evidence of miRNAs linking DDR and autophagy.
As reported previously, miR-1246 is regulated by the transcription factor p53, which responds to DNA damage. In this work, we first analyzed the relationship between miR-1246 expression and sensitivity of NSCLC cells to irradiation. Then, we determined the underlying mechanism for mTOR-inhibited autophagy activation, linking between DDR and increased autophagy. Finally, we identified another transcription factor, Yin Yang-1 (YY1), as another transcription factor and CDR1as, as a sequester upstream of miR-1246. We also explored the potential of miR-1246 to be a biomarker capable of predicting the radiosensitivity and prognosis of patients with NSCLC.
Materials and methods
Cell culture and RR sublines establishment
The human NSCLC cell lines A549 and PC9 were purchased from American Type Culture Collection (Manassas, U.S.) and cultured in complete conditioned medium (Gibco, U.S.) with a humidified 5% CO2 atmosphere at 37% incubator. The radioresistant cell lines A549-R and PC9-R were stemmed from the parent cell lines A549 and PC9 respectively according to the previous report with minor modifications [11]. In a few words, we seeded A549 and PC9 cells to 10 cm culture dishes. After the cell confluence reached 70%, we treated them with 1.5 Gy (Precision X-Ray, U.S.) at Shandong Provincial Key Laboratory of Radiation Oncology, Shandong Cancer Hospital and Institute (Shandong, China). When the cells re-reached to 80% confluence, we passaged them into new culture dishes and irradiated them with increasing doses (3.5, 5.5, and 7.5 Gy). Then we treated them with another 7 cycles of 7.5 Gy radiation (Figure S1A). Hereto, the RR cell lines were established. Radiation survival curves were generated (Figure S1B) and parameters including D0 (the dose required to reduce survival to 37%), SF2 (the surviving fraction at 2 Gy), and SER10 (the sensitization enhancement ratio at 10%) were recorded (Table S1).
Patient selection and clinical specimen collection
We gathered serum samples from 112 NSCLC patients before treatment at Shandong Cancer Hospital and Institute, between December 2015 to January 2017. All patients received radiotherapy or a combination of radiotherapy and chemotherapy without thoracic surgery before or after radiotherapy. We extracted miRNA from their serum and detected miR-1246 expression levels by quantitative reverse transcriptional polymerase chain reaction (qRT-PCR). Available formalin-fixed paraffin-embedded (FFPE) biopsy samples (n=87) were also collected from a subset of patients for further gene expression detection by in situ hybridization (ISH) and immunohistochemical (IHC) staining. The study was approved by the committees for the ethical review of research at this institute (approval number: SDTHEC201512031).
Colony formation assays (CFA)
Cells were seeded at a density of 1 × 10⁶ cells/60 mm culture dishes. 24 hours later, we transferred miR-1246 agomir or antagomir (Ribobio, Guangzhou, China) into normal cells or RR cells respectively. Six hours later, transferred cells were reseeded into 6-well culture plates and treated with a single dose of irradiation (0, 2, 4, 6, 8, or 10 Gy) after cells adhered to plates. If transfection was not needed, we just seeded cells to 6-well culture plates and conducted irradiation scheme. After 14 days incubated without changing the culture medium, the cells were fixed with 4% paraformaldehyde and stained with crystal violet (Solarbio, Beijing, China) or Giemsa stain (CapitalBio Corporation, Beijing, China). We counted the colonies (with ≥50 cells) number under a microscope and acquired the images by common used camera. The survival fractions (SFs) were calculated as following: SF = Colonies Number Counted/Cells Number Seeded × (Plating Efficiency/100). The survival curves were derived by using the following L-Q model: SF = exp (-(a*x+b*(x2))).
RNA isolation, microarrays and qRT-PCR
Total RNA from cells, cell culture medium and serum samples were extracted by using TRIzol Reagent (Ambion, U.S.). The concentration and purity of RNA were measured by Model 680 (Bio-Rad, U.S.) while the integrity was assessed by denaturing agarose gel electrophoresis.
Three pairs of qualified RNA samples from RR and parental cell lines were sent to CapitalBio Corporation (Beijing, China) for microarray analysis by Affymetrix miRNA 4.0 Array (Santa Clara, U.S.) according to the manufacturer’s protocol.
We used SYBR Green-based miScript PCR arrays (Qiagen, U.S.) to perform qRT-PCR on LC480 (Roche, Switzerland). U6 was used as the internal control. Primers were verified by Primer-BLAST after designing and synthesized by Ribobio (Guangzhou, China); they were listed in Table S2. All the samples were reacted three times independently with the three times technical repetition. The results were normalized against internal controls and analyzed by the 2-ÄÄCt method.
Tumorigenicity in nude mice and irradiation
Female Balb/c nu/nu nude mice between four and six weeks old were obtained from HFK Bioscience Cooperation (Beijing, China). We housed them in lamina flow cabinets with pathogen-free food and water. All mice experiments were conducted according to the National Institutes of Health Guidelines for the Care and Use of Laboratory Animals and approved by our institutional ethics committee. We injected 2*106 cells in 200 µl phosphate buffered saline (PBS) into the mice’ right groin subcutaneously. When average tumor volume reached 100 mm3 or so, we treated mice with miR-1246 agomir or agomir-nc (5 nmol/each) and antagomir or antagomir-nc (10 nmol/each) by the way of multiple centers intratumor injection. A day later, we irradiated tumors with a single 10-Gy dose of radiation. Two days later, we treated mice with miR-1246 agomir or agomir-nc (5 nmol/each) and antagomir or antagomir-nc (10 nmol/each) for another triple ever other three days. We measured tumor size every three days by a caliper. Tumor volume was calculated by using the formula (a*b2)*0.5, in which a and b are long and short dimensions respectively. Mice were sacrificed when the tumor long dimensions reached 1.5 cm. The tumors were removed for molecular detection by serial section. Each group contained six mice.
Oligonucleotide and plasmid transfection
MiR-1246 agomir or antagomir with their control oligonucleotides were purchased from Ribobio (Guangzhou, China). Overexpressed plasmid of YY1 and CDR1as were purchased from Origene (Beijing, China); that of mTOR from Miaolingbio (Wuhan, China). Specific siRNAs were constructed in Cyagen (Guangzhou, China) (Table S2). Plasmid with GFP-LC3 was also purchased from Miaolingbio. Oligonucleotides and plasmids were transfected with LipoFiterTM Liposomal Transfection Reagent from Hanbio (Shanghai, China). The volume of transfection accorded to the basal area of cell culture container.
Western blotting (WB)
Protein was extracted from the cultured cells by cell lysis buffer for Western and IP (Beyotime, Shanghai, China) and quantified by BCA protein assay kit (Beyotime, Shanghai, China). Equal protein from different cells were separated by 10% sodium dodecyl sulfate/polyacrylamide gel (CWBio, Beijing, China) electrophoresis and transferred to a polyvinyl difluoride membrane (0.45 mm PVDF; Millipore, Burlington, U.S.) by a wet system (Bio-Rad, Hercules, U.S.). Subsequently, the PVDF membrane was blocked by 5% skim milk with 0.1% bovine serum albumin (BSA) (Beyotime, Shanghai, China) and incubated by primary antibodies, which includes mTOR, ULK1, Atg14, TEFB, actin from Proteintech, U.S. and p-ULK1, p-Atg14, p-TEFB from Abcam, U.S. Finally, we used HRP-linked anti-rabbit or anti-mouse IgG (1:1000 dilution; CST, U.S.) as the second antibodies and ECL substrate solution (GE Healthcare Life Sciences, U.S.) for blotting.
Dual-luciferase assay
To construct vector, mTOR 3’UTR and CDR1as 3’UTR containing miR-1246 binding sites were amplified and inserted into psiCHECK-2 luciferase reporter vectors (named WT). The site mutation vector was also constructed (named MT). WT and MT vectors were co-transfected with miR-1246 agomir or antagomir respectively into A549 and PC9 cells. A miR-1246 promoter containing YY1 binding sites was also generated and inserted into a pGL3 basic luciferase reporter vector (named wt). The site-directed mutagenesis of YY1 any five binding sites vector were conducted (named mt-A, mt-B, mt-C, mt-D, mt-E, and mt-F). These vectors along with control pGL3 basic vector were co-transfected with YY1-overexpressed vectors into A549 and PC9 cells.
For reporter assays, firefly and renilla luciferase activities were measured at 48 h after transfection using the Dual-Luciferase Reporter Assay System (Promega Corporation, Madison, U.S.). Each transfection was performed three times with three times technic repeats.
Electron microscopy assay
Cells were collected by scraping softly and fixed with 2.5% glutaraldehyde (Servicebio, Wuhan, China). Samples were dehydrated with an increasing concentration gradient of ethanol and propylene oxide after fixation by 0.1% osmium tetroxide. We then embedded the samples for cutting them into 50-nm sections and stained with 3% uranyl acetate and lead citrate. Images were acquired using a JEM-1011CX electron microscope (Tokyo, Japan).
Immunofluorescence assay
Forty-eight hours after GFP-LC3 plasmid transfection, we fixed cells and stained nuclei with 1 mg/ml DAPI (KeyGen BioTECH, Nanjing, China). Zeiss LSM 700 100_oil-immersion objective (Oberkoechen, Germany) was used for imaging acquisition and ZEN 2009 Light edition software for image analysis. Cells with more than 10 GFP-LC3 dots were considered positive and at least 150 positive cells were counted under each group. Finally, we plotted graphs as GFP-LC3 positive dot (autophagic puncta) per cell.
Electrophoretic mobility shift assay (EMSA)
We extracted nuclear protein from A549 and PC9 cells and use EMSA/Gel-Shift Kit (Thermo, U.S.) to detect binding activity of YY1 protein on the promoter region of miR-1246 (YY1-A, YY1-B, YY1-C, YY1-D, YY1-E, and YY1-F). The YY1 recognized probe (Thermo, U.S.) was used as the positive control and samples without nucleoprotein was used as negative control. We incubated 10 minutes with 100-fold specific oligonucleotide competitor (unlabelled wild-type or mutant YY1 probes) for competition experiment. Next, the labelled probe was added. Tanon-5200 (Tanon, China) was used for visualizing bands analysis. Probes used in this study were shown in Table S2.
Chromatin immunoprecipitation (ChIP)-PCR
We first fixed cells with 1% paraformaldehyde to covalently crosslink proteins with DNA; then harvested chromatin. Crosslinked DNA was sheared with sonication before an immmmunoselection process, which required use of Anti-YY1 antibody (Santa, U.S.). After DNA retrieving, we used PCR to measure DNA fragments in the putative YY1-binding sites with specific primers (Table S2).
In situ hybridization (ISH)
Briefly, after fixation, dehydration, dewaxing, digestion, and refixation, the slides were pre-hybridized at 68°C for 20 hours and hybridized in hybridization buffer with digoxigenin-labelled probes specific to miR-1246. The signals of digoxigenin-labelled probes were detected by anti-digoxigenin-488 (Jackson, U.S.). Nuclei were counterstained with 4, 6-diamidino-2-phenylindole (Servicebio, China). Finally, the images were acqured by using a fluorescence microscopy (Leica, SP8 laser confocal microscopy) under 20 × and 40 × objective. The images were analyzed by using Image-pro plus 6.0 (Media Cybernetics, Inc., Rockville, MD, U.S.). The probes used were also shown in Table S2.
Fluorescence in situ hybridization (FISH)
Briefly, after fixation, dehydration, dewaxing, and digestion, the slides were pre-hybridized at 37°C for 1 hour and hybridized in hybridization buffer with DIG-labelled probes specific to CDR1as at 37°C overnight. The signal of DIG-labelled probes was detected by anti-DIG-488 (Jackson, USA). Nuclei were counterstained with 4, 6-diamidino-2-phenylindole (Servicebio, China). Finally, the image acquisition was by means of a fluorescence microscopy (Leica, SP8 laser confocal microscopy) using 20 ×, 40 ×, and 63 × oil objective. The image analysis was got by Image-pro plus 6.0 (Media Cybernetics, Inc., Rockville, MD, USA) and Immunofluorescence Accumulation Optical Density (IOD) was used for evaluating the expression level of CDR1as in NSCLC tissues. The probe was also shown in Table S2.
Immunohistochemical staining (IHC)
After deparaffinizing, rehydrating and treating the tissues serial sections (4-μm) with 3% H2O2 in methanol, antigen was retrieved with citrate buffer (PH 6.0) in a high-pressure steamer. The sections were incubated with antibody against mTOR (Proteintech, U.S.), LC3 (Proteintech, U.S.), and YY1 (Santa, U.S.) after blocked with 5% fat-free dry milk in TBS Tween. The HRP-conjugated secondary antibody was bonded and detected by DAB staining while the image was acquired under a microscope (Olympus, Japan). We evaluated targeted protein expression according to previously description by using the histological score (H score) according to following formula: H score = ratio score × intensity score. The ratio score respected the proportion of positive cells in each specimen, which was quantitatively evaluated as 0 for 0% staining, 1 for 0.01~25% staining, 2 for 25.01~50% staining, 3 for 50.01~75% staining, 4 for >75% staining. The intensity score was graded as follows: 0 for no signal, 1 for weak, 2 for moderate, 3 for strong. The H score of 0~12 was estimated as low (score: 0~5) and high (score: 6~12).
Statistical analyses
The statistical significance of microarray data about fold change was analyzed by using the Student’s t-test and Benjamini Hochberg FDR was used to correct the P-value. Correlation between differentially expressed miRNAs detected by microarray and qRT-PCR was analyzed by using Pearson correlation coefficient. Kaplan-Meier Curves were used for overall survival or disease-free survival analysis. Receiver operating characteristic (ROC) analysis was used to evaluate the power of miR-1246 as predictive biomarkers. Comparison between different experimental groups was performed by using the Student’s t-test or χ2 test. Statistical tests and image processing were performed with GraphPad Prism 7.0, IBM SPSS Statistics 19, and Photoshop CS5.
Results
Profiling of differentially expressed miRNAs between established radioresistant and parental NSCLC cell lines
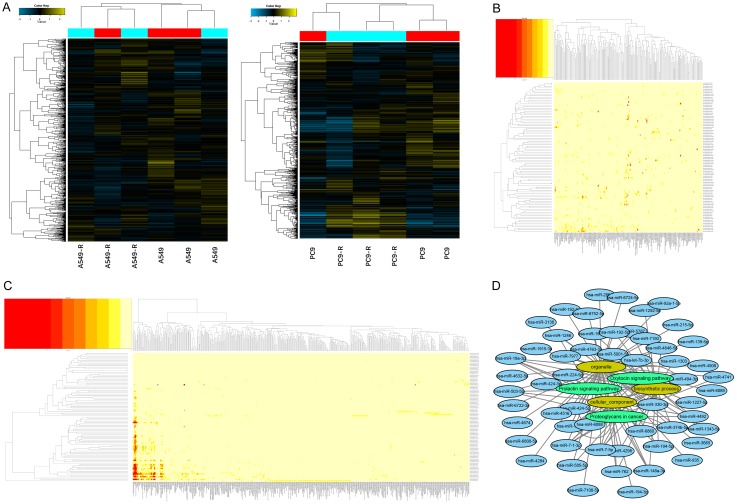
We conducted miRNA microarrays to identify the differentially expressed (DE) miRNAs between RR and parental cell lines (Figure 1A). Seven upregulated and 20 downregulated miRNAs (≥2-fold increase or decrease in expression) were found in A549-R compared with A549, while 66 upregulated miRNAs and four downregulated miRNAs were found in PC9-R compared with PC9. We then performed GO and KEGG pathway enrichment analyses to identify the targeted genes of the DE miRNAs (Figure 1B, 1C). The top three enriched GO and KEGG pathway results and their correlation with DE miRNAs are shown in Figure 1D. A selection of these miRNAs was validated by qRT-PCR for further verification (Figure S2A-C); there was acceptable consistency between the microarray and qRT-PCR results (Figure S2D).
Figure 1.
Screening of differentially expressed miRNAs identified by microarray and functional annotation. A. Hierarchical clustering results of the microarray-verified differentially expressed miRNAs between RR and their parental cell lines. B, C. GO and KEGG analyses of differentially expressed miRNAs. D. Top three enriched GO (yellow) and KEGG (green) pathway results and their correlated differentially expressed miRNAs (blue).
Both intracellular and extracellular miR-1246 expression increases in a time-dependent pattern after irradiation
We selected miR-1246 for further study. As evidenced by qRT-PCR results (Figure S2B, S2C), miR-1246 expression was elevated in RR cell lines compared with parental cell lines. Then, we searched public databases for further evidence of miR-1246 expression changes upon irradiation. After searching Gene Expression Omnibus (GEO, https://www.ncbi.nlm.nih.gov/geo/) for NSCLC radiotherapy-related datasets, GSE112375 caught our attention. This study evaluated the miRNA response of NSCLC cells (A549) upon irradiation by performing miRNA expression profiling on total intracellular RNA at 24 h. The results showed a time-dependent increasing trend (Figure 2A) but with no significance (Figure 2B).
Figure 2.
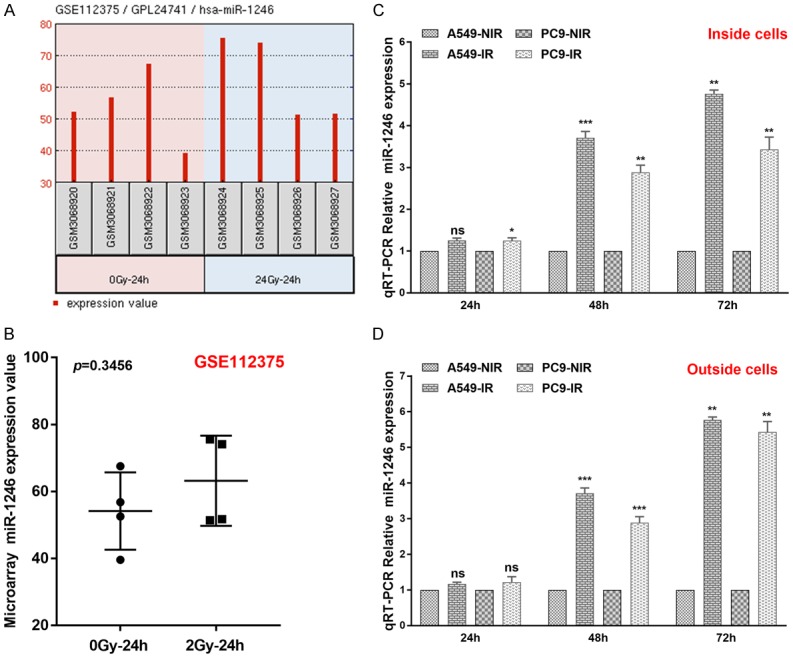
MiR-1246 intracellular and extracellular expression increases in a time-dependent pattern after irradiation of NSCLC cells. A. The intracellular miR-1246 response in A549 cells after irradiation (2 Gy) at 24 h according to GSE112375. B. The relative miR-1246 values as determined by microarray (GSE112375). C. Relative intracellular expression of miR-1246 (n=3) in A549 and PC9 cells after irradiation at 24 h, 36 h, and 72 h; levels are assessed by qRT-PCR. D. Extracellular relative expression of miR-1246 (n=3) in A549 and PC9 cells after irradiation at 24 h, 36 h, and 72 h; levels are assessed by qRT-PCR. Data are shown as the mean ± SD. *, P<0.05; **, P<0.01; ***, P<0.001; ns, no significant. IR: irradiation. NIR: non-irradiation.
To further determine miR-1246 expression changes over time after irradiation, we performed qRT-PCR on both intra- and extracellular total RNA from A549 and PC9 cells. As shown in Figure 2C, 2D, the differences in relative RNA expression levels between the non-irradiation (NIR) and irradiation (IR) groups were not significant, with the exception of intracellular RNA from PC9 cells at 24 h after irradiation. However, 48 h and 72 h later, there was significant miR-1246 differential expression between NIR groups and IR groups in both intra- and extracellular populations of RNA. These results indicated a time-dependent increase in intra- and extracellular miR-1246 levels after irradiation of NSCLC cells.
MiR-1246 decreases radiosensitivity in both NSCLC cell lines and the xenograft model
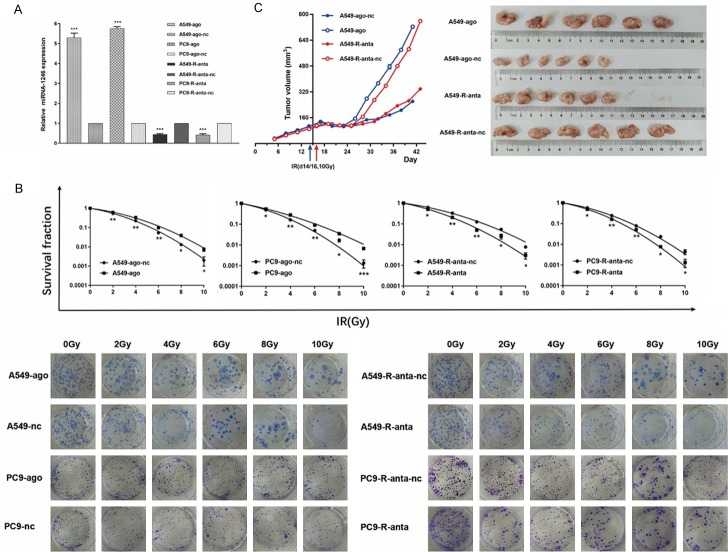
The upregulation of miR-1246 in RR cell lines led us to hypothesize that miR-1246 might enhance radioresistance in NSCLC cells. To test this hypothesis, we transfected miR-1246 agomir into A549/PC9 cells with low levels of endogenous miR-1246 expression, and miR-1246 antagomir into A549-R/PC9-R cells with high levels of endogenous miR-1246 expression (Figure 3A). Then we performed the colony formation assay and calculated the fraction of surviving cells (Figure 3B). Detailed data, including an integrated cell survival curve, are presented in Table S1. These results supported the hypothesis.
Figure 3.
MiR-1246 increases NSCLC cell radioresistance in vitro and in vivo. A. miR-1246 was upregulated after an agomir was transfected into A549 and PC9 cells, while it was downregulated after an antagomir was transfected into A549-R and PC9-R cells. Relative miRNA-1246 expression was detected by qRT-PCR (n=3). B. After transfection, cells were irradiated with 0, 2, 4, 6, 8, or 10 Gy, and colonies formed after 14 days as indicated; n=3 per group. C. Nude mice were subcutaneously injected with tumour cells (n=6) and treated with agomir/nc or antagomir/nc. Tumour volume data are presented as growth curves. When the average volume reached approximately 100 mm3, we radiated the tumours with a single 10 Gy dose. The mice were killed when the longest dimension reached 1.5 cm in any group. Then, the tumours were removed and compared. Data are presented as the mean ± SD. *, P<0.05; **, P<0.01; ***, P<0.001; ns, no significant. Ago: agomir, anta: antagomir, nc: negative control.
For further verification, we examined the effect of miR-1246 on radiosensitivity in vivo. A xenograft model was constructed and treated with the miR-1246 agomir or the antagomir, as described in the Methods section. We found that downregulation of miR-1246 significantly increased the sensitivity of NSCLC cell line-derived tumours to irradiation treatment, whereas its upregulation had the opposite effect (Figure 3C). The results indicated a significant role for miR-1246 in NSCLC radioresistance, prompting further exploration of the underlying mechanism.
MiR-1246 amplifies basal and irradiation-induced autophagy in NSCLC cells
As previously reported, autophagy activation contributes to radioresistance. Moreover, RR pancreatic cancer cell lines have increased basal autophagy activity compared with their parental lines [11]. Therefore, we first investigated whether the same phenomenon existed in NSCLC cell lines. Indeed, LC-II was accumulated and SQSTM1/p62 level decreased in RR cell lines (Figure 4A), indicating the activation of autophagy. Using a GFP-LC3 reporter, we observed a decrease in green fluorescence, which indicates the presence of autophagosomes (Figure 4E). This was further supported by electron microscopy observations (Figure 4C).
Figure 4.
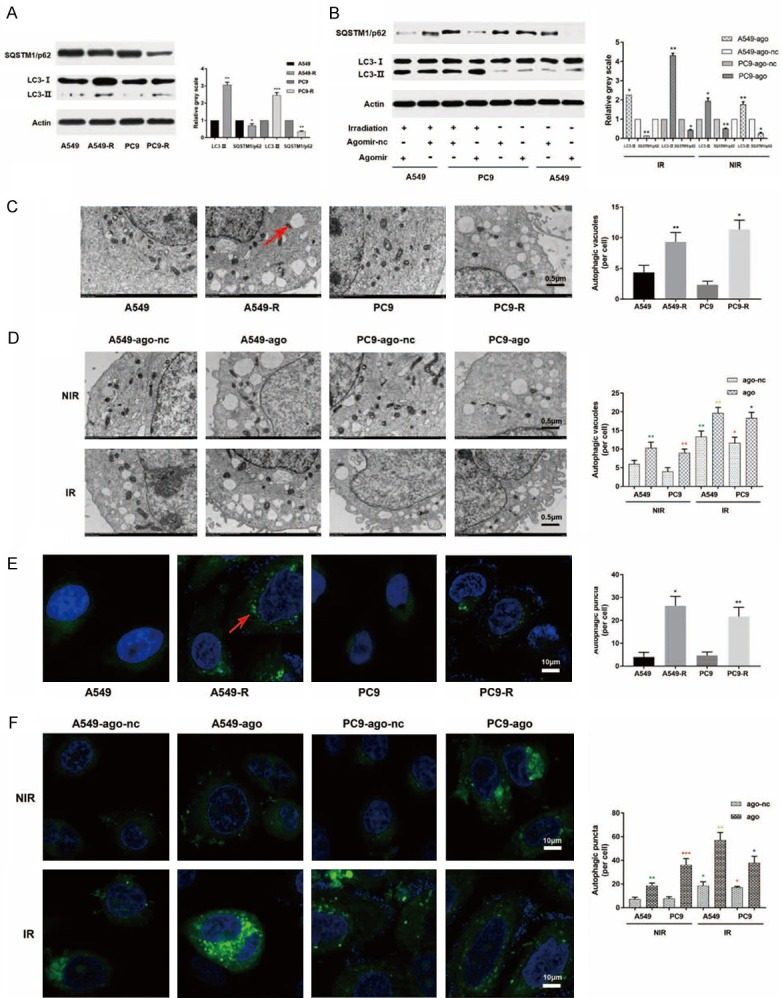
MiR-1246 activates autophagy in NSCLC cells. A. RR cells showed increased LC-II expression and decreased SQSTM1/p62 expression compared with their parental cells. B. Both upregulated miR-1246 and irradiation resulted in an increase in LC-II expression and a decrease in SQSTM1/p62 expression. C. RR cells showed greater autophagic vacuole accumulation than their parental cells, as detected by electron microscopy observations. Red arrow: autophagic vacuoles. D. Both upregulated miR-1246 and radiation resulted in an increase in autophagic vacuole accumulation, as detected by electron microscopy observations. E. RR cells showed greater autophagosome accumulation than their parental cells, as shown by immunofluorescence detection. Red arrow: autophagosome. F. Both upregulated miR-1246 and radiation resulted in an increase in autophagosome accumulation as shown by immunofluorescence detection. Data are presented as the mean ± SD. *, P<0.05; **, P<0.01; ***, P<0.001; ns, no significant. Ago: agomir, anta: antagomir, nc: negative control. IR: irradiation, NIR: non-irradiation. n=3 per group.
Subsequently, we asked whether upregulated miR-1246 was one of the factors causing the observed increase in autophagy. We increased or decreased miR-1246 expression by transfecting agomir or antagomir, respectively, into A549/PC9 or A549-R/PC9-R cells and examined the resulting changes in autophagy levels. As shown in Figures 4B and S3A, upregulated or downregulated miR-1246 significantly increased or decreased the lipidation of LC3 and decreased or increased the expression level of SQSTM1/p62, respectively. Further observation using fluorescence and electron microscopy showed the accumulation and degradation of autophagosomes in overexpressing and downregulated miR-1246 cells, respectively (Figures 4D, 4F, S3B and S3C). All the results supported the assumption that miR-1246 amplifies basal autophagy in NSCLC cells.
Next, we analysed the effect of miR-1246 on autophagy levels after irradiation and found that overexpression of miR-1246 had a role in radiation-induced autophagy activation (Figure 4B, 4D and 4F).
MiR-1246 targets the mTOR axis to activate autophagy
To investigate the underlying mechanism of the aforementioned results, we initially determined the targets of miR-1246. First, we predicted its targets by searching available databases, including miRanda, miRmap, RNAhybrid, miRWalk and TargetScan. After identifying known autophagy-related targets, we measured the effect of miR-1246 on their mRNA levels (Figure 5A). Finally, we chose mTOR as a potential miR-1246 target for further verification.
Figure 5.
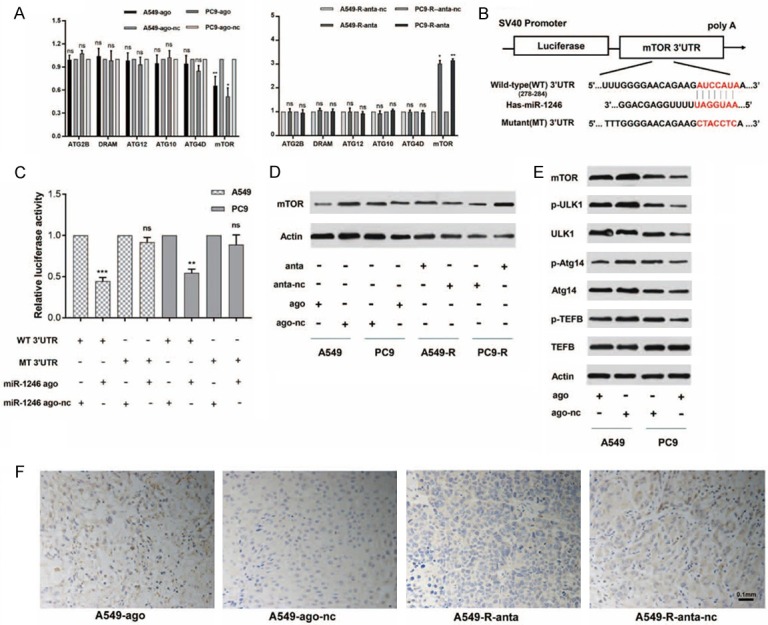
MiR-1246 targets the mTOR axis. A. The relative mRNA expression of predicted targets was detected by qRT-PCR (n=3) in miR-1246 upregulated or downregulated NSCLC cells. Actin was used as an internal reference. Data are presented as the mean ± SD. *, P<0.05; **, P<0.01; ns, no significant. B. The dual-luciferase reporter containing the mTOR 3’UTR is shown. It displays the predicted binding sequences between wild-type 3’UTR and miR-1246, as well as the mutant 3’UTR. C. Luciferase activity assays (n=3) were performed after transfection of miR-1246 agomir or nc into A549 and PC9 cells. The luciferase activity of the agomir-nc transfected cells was set as 1. Data are presented as the mean ± SD. *, P<0.05; **, P<0.01; ns, no significant. D. A549 and PC9 cells were transfected with miR-1246 agomir or nc. The protein expression of mTOR, p-ULK1, ULK1, p-Atg14, Atg14, p-TEFB, and TEFB were measured by Western blot (n=3). Actin was used as an internal reference. E. A549 and PC9 cells were transfected with miR-1246 agomir or nc, while A549-R and PC9-R cells were transfected with miR-1246 antagomir or nc. Then, mTOR expression was determined at the protein level by Western blot analysis (n=3). F. The differential expression of mTOR between xenograft tumour tissues treated with miR-1246 agomir and nc was detected by immunohistochemistry. n=6 per group. Ago: agomir, anta: antagomir, nc: negative control.
As predicted, miR-1246 reduced mTOR expression by recognizing sites in the mTOR 3’untranslated region (3’UTR) (Figure 5B). To determine if there was direct binding, we used a dual-luciferase reporter system in NSCLC cell lines. The miR-1246 agomir inhibited the activity of the luciferase reporter by binding to sites in the mTOR 3’UTR fragment. In contrast, the activity of a luciferase reporter containing a mutated miR-1246 binding site in the 3’UTR fragment was not influenced by the presence of the miR-1246 agomir (Figure 5C). Moreover, the miR-1246 agomir was transfected into A549/PC9 cells and inhibited the expression of mTOR mRNA (Figure 5A) and protein (Figure 5D), and the reverse was true when the antagomir was transfected into A549-R/PC9-R cells. We also performed IHC to examine the difference in mTOR protein expression between miR-1246-upregulated xenograft tumour tissues and controls (Figure 5F). Moreover, we monitored the expression levels of ULK1, ATG14, and TEFB, which have been confirmed as molecules that are downstream of mTOR and activate autophagy (Figure 5E). The results showed that miR-1246 influenced the expression of mTOR and its downstream autophagy-related molecules.
MiR-1246 resists NSCLC cells to radiation by activating mTOR-inhibited autophagy
Based on the results above, we assumed that miR-1246-induced radioresistance depends on mTOR-mediated inhibition of autophagy activation. First, we compared the effect of miR-1246 on irradiation with the effects induced by other autophagy activators or inhibitors. Our results showed that the effect of rapamycin was similar to and even synergistic with the increase in radioresistance caused by miR-1246 upregulation (Figure 6A). Moreover, the effect of the autophagy inhibitor chloroquine (CQ) was similar to and even synergistic with the increase in radiosensitivity caused by miR-1246 downregulation (Figure 6A).
Figure 6.
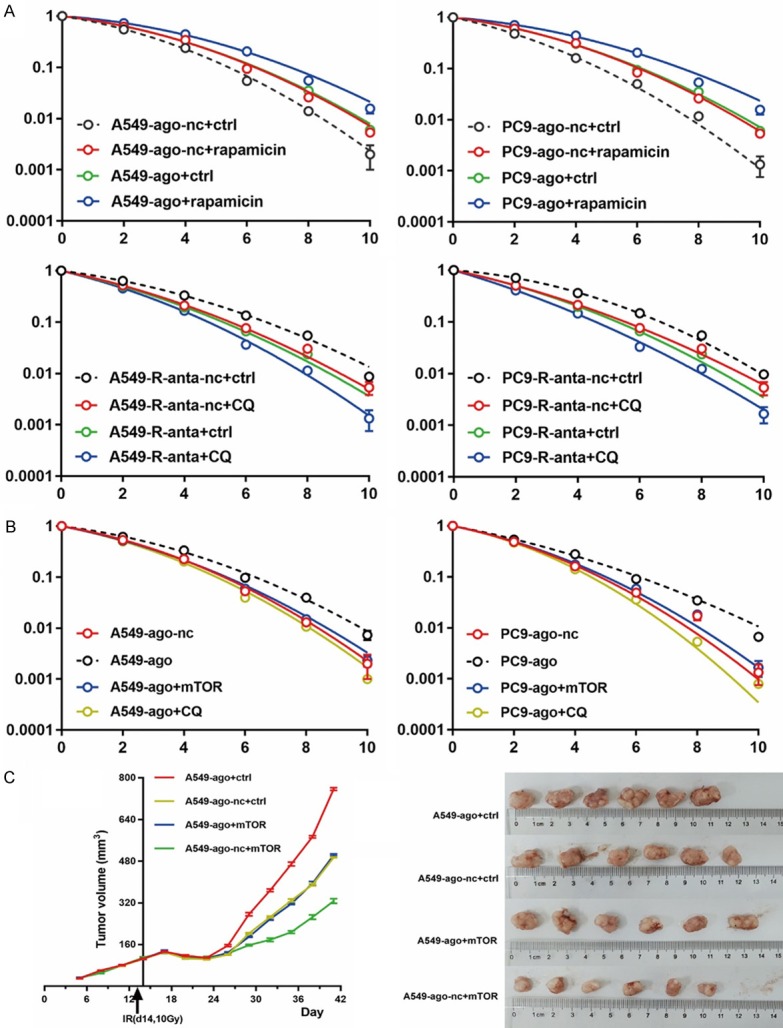
MiR-1246 promotes resistance of NSCLC cells to irradiation by mTOR-mediated inhibition of autophagy activation. (B) NSCLC cells were transfected with miR-1246 agomir, nc, or mTOR plasmid, or they were treated with CQ (10 μmol/L) following irradiation. Survival curves were generated for both (A) and (B) groups. n=3 per group. Data are presented as the mean ± SD. (C) Nude mice were subcutaneously injected with tumour cells transfected with an mTOR expression plasmid or control plasmid. When the average tumour volume reached approximately 100 mm3, they were treated with agomir or nc and a single 10 Gy dose one day later. Tumour volume data were recorded and then they were radiated and removed as mentioned above; n=6 per group. Student’s t-test was used for differential analysis, and data are presented as the mean ± SD. Ago: agomir, anta: antagomir, nc: negative control, ctrl: control.
Second, we examined whether miR-1246-induced radioresistance could be abrogated by mTOR overexpression or CQ application. We found that ectopic mTOR overexpression or CQ treatment inhibited the increase in radioresistance induced by miR-1246 overexpression in vitro (Figure 6B). Finally, we used a xenograft model to test the effects of miR-1246 and mTOR on radiosensitivity in vivo. Overexpression of miR-1246 increased the resistance of A549-derived tumours to irradiation, whereas overexpression of mTOR reversed the effect (Figure 6C).
YY1 increases miR-1246 expression by binding to its promoter region
After exploring the downstream targets, we wondered whether there are important upstream molecules involved in the miR-1246-related irradiation response mechanism. Next, we explored this topic in two ways. On the one hand, we tried to find an active transcription factor. On the other hand, we attempted to find a competing endogenous RNA.
For this purpose, we first used JASPAR to analyse a 2-kb region upstream of the transcription start site of miR-1246. Six YY1-binding motifs were identified inside the putative miR-1246 promoter region. These six-transcription factor-binding sites (TFBSs) were named A, B, C, D, E, and F (Figure 7A). To determine the role of YY1 in miR-1246 expression, we transfected a YY1-overexpressing vector into A549 and PC9 cells and found that miR-1246 was upregulated after YY1 overexpression, which suggested a regulatory effect of YY1 on miR-1246 (Figure 7B). To identify the functional sites of these six predicted TFBSs, we performed a series of dual-luciferase assays. We observed an increase in wild-type miR-1246 promoter luciferase activity upon overexpression of YY1 in both A549 and PC9 cells. Similar effects were observed when any of the five sites were mutated (mt1-6) but not when all six sites were mutated (mt7), which indicated that every site was involved in direct binding between YY1 and the miR-1246 promoter (Figure 7C). Then, EMSAs were used to determine whether these sites could be bound by the nuclear protein extracted from cell lines. When unlabeled YY1 oligonucleotides were added, the shift band disappeared. However, the bands were not affected when a YY1 with mutated sites was added (Figure 7D). Finally, we conducted ChIP assays to confirm that the YY1 protein was recruited to all six TFBSs at the putative miR-1246 promoter (Figure 7E). All these data indicated that YY1 binds to the specific promoter TFBS of miR-1246 and activates transcription.
Figure 7.
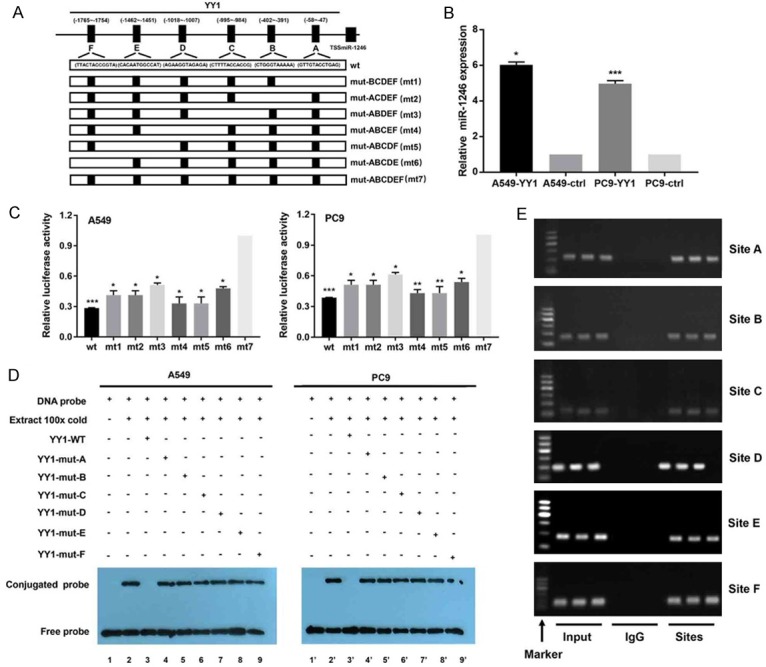
YY1 increases miR-1246 expression by binding to its promoter region. A. The informal structure of the miR-1246 promoter regions sites binding with the YY1. The wild-type (wt) showing the joint sequences and the mutant (mt) ones were introduced to luciferase reporters driven by the promoter. B. The relative miR-1246 expression (n=3) after YY1 overexpression or not was detected by qRT-PCR in NSCLC cells. ctrl: control. C. The dual-luciferase plasmids containing the indicated wt and mts sequences reports were transfected into A549 and PC9 for luciferase activity assays (n=3). Data were presented as the mean ± SD. D. EMSA results for the verification of YY1 binding sites (n=3). Nuclear proteins were extracted from A549 and PC9 cells. Cell lines 1 and 1’ were assessed by the labelled free probe as a control. Cell lines 3 and 3’ were tested with a 100-fold excess of unlabeled wt probe, while cell lines 2 and 2’ were tested without any unlabelled competition. Cell lines 4~9 and 4’~9’ were tested with unlabelled mutants that competed with their respective labelled probes. E. Results from ChIP assays (n=3) using an antibody against YY1; the binding sites were identifed by PCR gel. The input was the positive control, and IgG was used as the negative control. The locations were determined by molecular weight as marker shown. *, P<0.05, **, P<0.01, ***, P<0.001. Data are presented as the mean ± SD.
CDR1as decreases miR-1246 expression by sequestering it
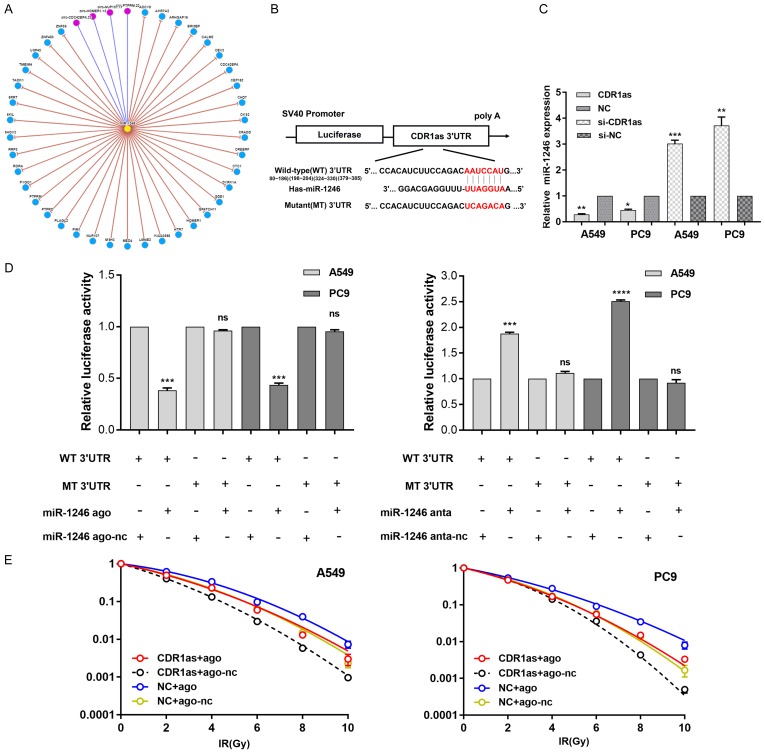
After searching circNet (http://syslab5.nchu.edu.tw/CircNet/), we found many experimentally supported relationships between miR-1246 and circular RNAs (circRNAs) (Figure 8A). CircRNA CDR1as appeared as a possible binding partner when we searched for predicted targeted genes of miR-1246 by TargetScan (Figure 8B). Overexpression of CDR1as decreased miR-1246 expression (Figure 8C). The dual-luciferase assay was conducted to test several binding sites and revealed a strong connection between CDR1as and miR-1246 (Figure 8D). Moreover, CDR1as antagonized the effect of miR-1246 on radioresistance in NSCLC cell lines (Figure 8E). These results further illuminated the radiation response mechanism mediated by miR-1246 in NSCLC cells.
Figure 8.
CDR1as decreases miR-1246 expression and antagonized its effect on radioresistance. A. MiR-1246 interacts with circular RNAs and genes. Yellow node: miRNA, blue nodes: genes, red nodes: circular RNAs. It just includes interactions with greater than or equal ten supporting experiments. B. The dual-luciferase reporter containing CDR1as 3’UTR. It showed the predicted binding sequences between wild-type 3’UTR and miR-1246, as well as the mutant 3’UTR. C. The relative miR-1246 expression (n=3) after CDR1as overexpression or downregulation were detected by qRT-PCR in NSCLC cells. NC: negative controls. si: gene silencing. Data were presented as the mean ± SD. *, P<0.05; **, P<0.01; ***, P<0.001. D. The dual-luciferase plasmids containing the indicated wt and mts sequences reports were transfected into A549 and PC9 for luciferase activity assays (n=3). Data were presented as the mean ± SD. ***, P<0.001; ****, P<0.0001; ns, no significant. E. NSCLC cells were transfected with miR-1246 agomir, nc, CDR1as plasmid, or NC following irradiation. Survival curves were generated. n=3 per group. Data were presented as the mean ± SD.
Correlation of miR-1246 with clinicopathologic factors and other key genes
Next, we explored the correlation of miR-1246 with clinicopathologic factors and the expression of other key genes. We searched The Cancer Genome Atlas (TCGA) (https://www.cancer.gov/) for NSCLC patients with miR-1246, mTOR, and YY1 expression results, and 309 patients met the criteria. As shown in Figure S4, miR-1246 expression was higher in patients with lung squamous cell carcinoma than in patients with lung adenocarcinoma. High miR-1246 expression was associated with high expression of YY1. Moreover, miR-1246 was higher in patients exhibiting tumour progression than those who were not.
To further confirm this relationship, we performed ISH (Figure 9) to measure the abundance of mature miR-1246 in FFPE human NSCLC biopsies (n=87). We also used IHC to detect the expression of mTOR and YY1, and we used FISH to detect CDR1as in the same patients (Figure 9). Analysing the relationship between the expression of these genes and clinicopathological factors showed that high miR-1246 expression had little correlation with clinicopathologic factors but was strongly related to the expression of mTOR, YY1, and CDR1as (Table 1). High miR-1246 expression was associated with low expression of mTOR, high expression of YY1, and low expression of CDR1as. These results are consistent with the previously observed correlation between miR-1246 and the expression of other key genes in cell lines.
Figure 9.
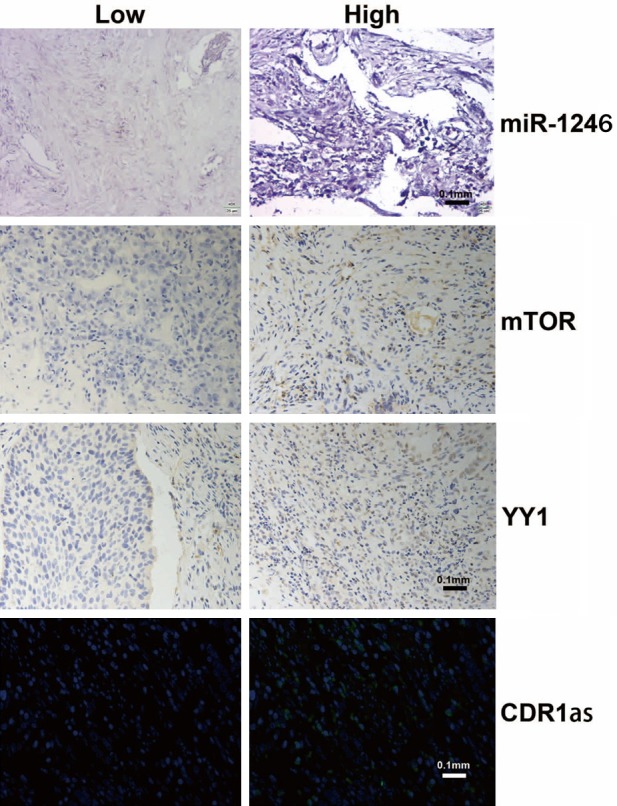
Examples of miR-1246, mTOR, YY1, and CDR1as expression in FFPE tissues from NSCLC patients. MiR-1246 was detected by in situ hybridization. YY1 and mTOR were detected by immunohistochemistry. CDR1as was detected by fluorescence in situ hybridization; n=3 per group.
Table 1.
Relationships of miRNA-1246 expression levels with clinicopathological characteristics and other key genes in NSCLC serum or FFPE tissues
| Characteristics | No. of patients (%) | miRNA-1246 expression in serum | No. of patients (%) | miRNA-1246 expression in FFPE | |||
|---|---|---|---|---|---|---|---|
|
|
|
||||||
| Mean (ΔCt) | p1 | Low | High | p2 | |||
| Age (year) | |||||||
| ≤60 | 49 (43.8) | -1.17 | 0.170 | 40 (46.0) | 18 | 22 | 0.830 |
| >60 | 63 (56.2) | -1.98 | 47 (54.0) | 23 | 24 | ||
| Gender | |||||||
| Female | 37 (33.0) | -2.41 | 0.061 | 23 (26.4) | 12 | 11 | 0.631 |
| Male | 75 (67.0) | -1.24 | 64 (73.6) | 29 | 35 | ||
| Pathology3 | |||||||
| SCC | 56 (55.0) | -1.15 | 0.105 | 35 (40.2) | 21 | 14 | 0.084 |
| AC | 56 (55.0) | -2.10 | 52 (59.8) | 21 | 31 | ||
| Differentiation | |||||||
| Well & Moderate | 88 (78.6) | -1.43 | 0.213 | 67 (77.0) | 29 | 38 | 0.446 |
| Poor | 24 (21.4) | -2.32 | 20 (23.0) | 11 | 9 | ||
| TNM stage | |||||||
| 0~II | 44 (39.3) | -2.307 | 0.062 | 31 (35.6) | 18 | 13 | 0.826 |
| III~IV | 68 (60.7) | -1.187 | 56 (64.4) | 31 | 25 | ||
| Chemotherapy4 | |||||||
| NP | 42 (37.5) | -1.02 | 0.113 | 28 (32,2) | 12 | 16 | 0.106 |
| P or NP | 70 (62.5) | -1.99 | 59 (67.8) | 37 | 22 | ||
| mTOR expression | |||||||
| Low | 31 (35.6) | -0.66 | 0.047* | 31 (35.6) | 10 | 21 | 0.007** |
| High | 56 (64.4) | -2.01 | 56 (64.4) | 36 | 20 | ||
| YY1 expression | |||||||
| Low | 29 (33.3) | -2.57 | 0.022* | 29 (33.3) | 19 | 10 | 0.040* |
| High | 58 (66.7) | -1.00 | 58 (66.7) | 23 | 35 | ||
| CDR1as expression | |||||||
| Low | 45 (51.7) | -0.91 | 0.048* | 45 (51.7) | 13 | 35 | 0.005** |
| High | 42 (48.3) | -2.19 | 42 (48.3) | 24 | 18 | ||
Compared using Student t test;
Compared using χ2 test;
P<0.05;
P<0.01;
SCC: squamous cell carcinoma, AC: adenocarcinoma;
N: Non-platinum drugs; P: platinum drugs; NP: both non-platinum and platinum drugs.
MiR-1246 can be a biomarker to predict NSCLC patients’ radiosensitivity and prognosis
Serum samples from 112 patients with NSCLC who received radiotherapy were collected before any treatment. We extracted total miRNA and measured the level of miR-1246 by qRT-PCR. We also evaluated the radiosensitivity according to RECIST1.1 [12] (Figure 10A, 10B) and recorded the follow-up information. The results showed that patients who were resistant to radiotherapy had higher levels of serum or FFPE miR-1246 than those who were sensitive to radiotherapy (Figure 10C, 10D). The sensitivity and specificity were evaluated by ROC curves, which gave the area under the curve (AUC) values of 0.8485 (sensitivity: 62.50%, specificity: 93.88%) for miR-1246 detection from patient serum (Figure 10E) and 0.8673 (sensitivity: 67.44%, specificity: 93.18%) for miR-1246 detection from patient serum (Figure 10F). Moreover, the patients with lower expression levels of serum or FFPE miR-1246 had longer survival or disease-free survival than those with higher levels (Figure 10G-J). These results indicate that serum or FFPE miR-1246 could be used as a biomarker to predict radiosensitivity and prognosis of NSCLC patients.
Figure 10.
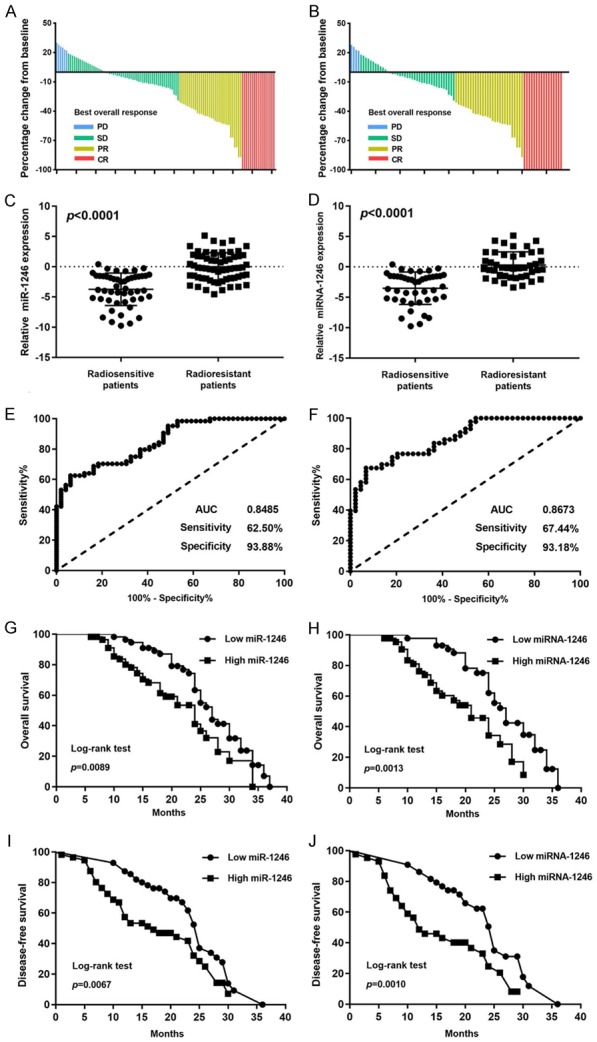
miR-1246 as a biomarker for predicting radiosensitivity and prognosis in NSCLC patients. (A, B) The baseline percentage of NSCLC patients’ best overall response is shown. PD: Progressive Disease; SD: Stable Disease; PR: Partial Response CR: Complete Response. The relative miR-1246 expression level was detected by qRT-PCR in the serum from 112 NSCLC patients (C) and the FFPE tissue from 87 NSCLC patients (D). Receiver operating characteristic (ROC) curve analysis was conducted based on miR-1246 expression in the serum from 112 NSCLC patients (E) and the FFPE tissues from 87 NSCLC patients (F). The AUC, sensitivity, and specifcity values are given in the graph. AUC: Area Under Curve. Kaplan-Meier analysis of overall survival (OS) was performed based on miR-1246 expression in the serum from 112 NSCLC patients (G) and the FFPE tissue from 87 NSCLC patients (H). Kaplan-Meier analysis of disease-free survival (DFS) was performed based on miR-1246 expression in the serum from 112 NSCLC patients (I) and the FFPE tissue from 87 NSCLC patients (J). The median was used as the cut-off value to distinguish between low and high expression of miR-1246.
Discussion
In this study, we verified that upregulation of miR-1246 increased the resistance of NSCLC cells to irradiation by activating mTOR-mediated inhibition of autophagy. A detailed study of the mechanism showed that miR-1246 was also targeted by YY1 and CDR1as. Finally, we also demonstrated the potential of miR-1246 to be both a biomarker that predicts the efficiency of radiotherapy in NSCLC patients and a possible target for radiotherapy sensitization.
MiRNAs are an important kind of small non-coding RNA molecules. The relative stability and wide but tissue-specific distribution made them potential tumour markers for diagnosis and prognosis [13]. MiRNAs usually regulate gene expression at the posttranscriptional level and are involved in many biological processes [13], which means they regulate cellular behaviours and affect carcinogenesis and tumour development. Thus, miRNAs are potential regulators of oncotherapy [13], such as radiotherapy. MiRNAs were shown to perform a function in the radiotherapy of pancreatic cancer patients [11,14] and cervical cancer patients by targeting autophagy-related genes [15]. However, knowledge of the roles that miRNAs play in NSCLC radiotherapy by regulating autophagy are still lacking. That is what we approached next. MiR-1246 participates in many tumour processes [16,17], and extracellular miR-1246 enhances radioresistance by directly targeting DR5 in lung cancer cells [18]. Moreover, DR5 could be regulated by p53 by binding to the its promoter region [19]. P53 responds to irradiation by adjusting the DDR process, which is discussed in detail in the ensuing section. Along with these considerations, we picked miR-1246 from hundreds of differentially expressed miRNAs identified in our experiments. We finally confirmed the effect of miR-1246 in NSCLC radioresistance and its role as a tumour biomarker.
Autophagy is a typical catabolic cellular process that degrades and recycles intra- or extra-cellular components to maintain homeostasis [20]. It occurs under fundamentally normal homeostatic conditions, as well as in response to stressful stimuli, such as hypoxia, nutritional deprivation, DNA damage, and exposure to cytotoxic agents [21]. Moreover, autophagy plays a complex role in cancer, where it can not only activate but also suppress tumour growth, progression, invasion, and other behaviours [21]. Researchers began to consider if it were feasible to modulate autophagy levels to favourr tumour therapy. Many studies have focused on this topic. Rangwala R et al. found that hydroxychloroquine, an autophagy inhibitor, could augment the antitumour treatment of temozolomide in melanoma patients [22]. Liu X et al. indicated that inhibition of autophagy could enhance the efficacy of sorafenib in glioblastoma [23]. As is the case with chemotherapy, autophagy changes also influence the radiotherapeutic response in ovarian and esophageal cancer [24]. Regarding NSCLC, Tareq Saleh and his lab members performed substantial work in cell lines. They emphasized the complexity of the autophagy process and found that autophagy mediates therapeutic effects via its cytotoxic function [25]. In our work, we endeavoured to further improve radiosensitivity in patients with NSCLC by regulating autophagy [26].
There are many ways to regulate autophagy, among which mammalian target of rapamycin (mTOR) pathway is prominent [27]. The level of mTOR-dependent autophagy changes during times of cellular stress, including irradiation. mTOR influences autophagy primarily by phosphorylating ULK1, ATG14, and TEFB [28]. ULK1 and ATG14 are involved in phagophore formation while TFEB is involved in lysosomal biogenesis. After predicting that mTOR is a target of miR-1246, we tested how the expression or phosphorylation of mTOR and these substrates changed after overexpressing miR-1246. The results supported our hypothesis. MiR-1246 could be used as an mTOR inhibitor and an autophagy inducer. Then, we considered whether an autophagy inhibitor, such as chloroquine (CQ), could antagonize the effect of miR-1246. The experimental results indicated that the irradiation effect in cells could be improved by the joint application of CQ with increased miR-1246 expression levels. These results also show the importance of assessing the miR-1246 expression level before initiating NSCLC patients’ radiotherapy.
Ionizing radiation causes DNA damage, which can be repaired by several cellular processes, that is, the DDR. Emerging evidence shows that autophagy is consequently modulated by DDR signalling activation [6]. The known DDR factors upstream of mTOR are REDD1, SESTRINS, NPRL2, and p53 [6]; of these, p53 was of interest to us in this work. As previously reported, p53 inhibits the mTORC1 pathway by stimulating the phosphorylation of the AMPKα subunit and activating TSC for the DDR [29]. As a transcription factor, when p53 is activated by DNA damage, it moves to the nucleus to regulate gene expression. A previous report identifying miR-1246 as a target of the p53 family led us to predict that miR-1246 would target mTOR upon p53 activation, which would allow mTOR to bypass the DDR. Thus far, our data suggested that the phenomenon of miR-1246 differential expression contributes to the underlying mechanism of irradiation-induced autophagy activation by DDR. However, it was still possible that there were other important molecules involved in miR-1246-dependent autophagy activation. Thus, we predicted potential upstream targets of miR-1246; YY1 was identified and was of interest.
YY1 is a zinc finger protein that is involved in transcriptional control over approximately 10% of the total mammalian gene set [30]. We found that miR-1246 is one of the miRNAs regulated by YY1. YY1 upregulated the expression level of miR-1246 after irradiation, which regulates autophagy activation as we described above. The role of YY1 in tumour growth and suppression has been widely studied [31,32], whereas little is known about its curative roles, especially in radiotherapy. Lifeng Feng et al. proposed a YY1-miR372-SQSTM1 regulatory axis in autophagy, which is related to our assumption and supported it [31]. Recently, YY1 was found to be a structural regulator of enhancer-promoter loops that facilitate gene expression [30]. The fact that several combinations of YY1 and miR-1246 functioned like an enhancer-promoter loop is indicative of an important mechanistic result of YY1-dependent miR-1246 overexpression. That observation requires further research that was not involved in our study. Interestingly, YY1 interacted with both mTOR and p53, as previously reported [33,34], which makes it more complicated but meaningful to perform a deep study of this regulatory axis.
A recent study showed that circRNAs can function as miRNA “sponges”, which ar also known as “competing endogenous RNAs (ceRNAs)”; ceRNAs forms a large class of post-transcriptional regulators [35]. CDR1as is a well-known circRNA, that acts as a sponge of several miRNAs and plays a part in cancer development [36]. Sebastian et al. first suggested that CDR1as harbours 63 conserved binding sites for miR-7 [36]. Following studies demonstrated that CDR1as can act as an oncogene in hepatocellular carcinoma [37], colorectal cancer [38], and NSCLC [39] by targeting miR-7 expression. Sang et al. found that ciRS-7 (CDR1as) accelerates esophageal squamous cell carcinoma (ESCC) progression by sponging miR-875-5p to enhance MAGE-A family expression [40]. Li et al. revealed that CDR1as exerts anti-oncogenic function in bladder cancer by sponging miR-135a [41]. However, there is no evidence of a relationship between CDR1as and miR-1246. Furthermore, the function of CDR1as in radiosensitivity is still unclear. That is what we focused on in this study.
This study had some limitations, as well as indicating promising directions for future research. First, dynamic miR-1246 changes in both NSCLC cells and patient samples reveal that miR-1246 could be measured as a biomarker to specifically monitor the disease. It could also be combined with other biomarkers for sensitive prediction of disease progression. Second, the endogenous level of miR-1246 changes over time; its correlation with autophagy or cell cycle has not been investigated, which might be involved in an additional underlying mechanism. Third, as miR-1246 is an mTOR inhibitor, its efficacy compared with that of other such inhibitors deserves further research, as does its coordination with them as possible combined clinical treatments. Finally, the details of the regulatory effect of YY1 on miR-1246 and the relationships between YY1, p53, mTOR, and miR-1246 need deeper exploration.
In summary, miR-1246 decreased the sensitivity of lung cancer cells to irradiation through direct inhibition of mTOR and activation of autophagy, which is regulated by YY1 transcriptional regulation and CDR1as sequestration. Moreover, we show that miR-1246 could be used as a biomarker for predicting radiosensitivity and prognosis in patients with NSCLC. These results may inform the development of a therapeutic model to ameliorate the resistance of NSCLC patients to radiotherapy.
Acknowledgements
This work was supported by the National Natural Science Foundation of China (grant numbers 81530060 and 81874224), the National Key Research and Develop Program of China (grant number 2016YFC0105106) and the Provincial Key Research and Development Program of Shandong (grant number 2017CXZC1206).
Disclosure of conflict of interest
None.
Supporting Information
References
- 1.Bray F, Ferlay J, Soerjomataram I, Siegel RL, Torre LA, Jemal A. Global cancer statistics 2018: GLOBOCAN estimates of incidence and mortality worldwide for 36 cancers in 185 countries. CA Cancer J Clin. 2018;68:394–424. doi: 10.3322/caac.21492. [DOI] [PubMed] [Google Scholar]
- 2.Siegel RL, Miller KD, Jemal A. Cancer statistics, 2018. CA Cancer J Clin. 2018;68:7–30. doi: 10.3322/caac.21442. [DOI] [PubMed] [Google Scholar]
- 3.Miller KD, Siegel RL, Lin CC, Mariotto AB, Kramer JL, Rowland JH, Stein KD, Alteri R, Jemal A. Cancer treatment and survivorship statistics, 2016. CA Cancer J Clin. 2016;66:271–289. doi: 10.3322/caac.21349. [DOI] [PubMed] [Google Scholar]
- 4.Prezzano KM, Ma SJ, Hermann GM, Rivers CI, Gomez-Suescun JA, Singh AK. Stereotactic body radiation therapy for non-small cell lung cancer: a review. World J Clin Oncol. 2019;10:14–27. doi: 10.5306/wjco.v10.i1.14. [DOI] [PMC free article] [PubMed] [Google Scholar]
- 5.Tam SY, Wu VW, Law HK. Influence of autophagy on the efficacy of radiotherapy. Radiat Oncol. 2017;12:57. doi: 10.1186/s13014-017-0795-y. [DOI] [PMC free article] [PubMed] [Google Scholar]
- 6.Hu L, Wang H, Huang L, Zhao Y, Wang J. Crosstalk between autophagy and intracellular radiation response (review) Int J Oncol. 2016;49:2217–2226. doi: 10.3892/ijo.2016.3719. [DOI] [PubMed] [Google Scholar]
- 7.Xin Y, Jiang F, Yang C, Yan Q, Guo W, Huang Q, Zhang L, Jiang G. Role of autophagy in regulating the radiosensitivity of tumor cells. J Cancer Res Clin Oncol. 2017;143:2147–2157. doi: 10.1007/s00432-017-2487-2. [DOI] [PMC free article] [PubMed] [Google Scholar]
- 8.Feng Z, Zhang H, Levine AJ, Jin S. The coordinate regulation of the p53 and mTOR pathways in cells. Proc Natl Acad Sci U S A. 2005;102:8204–8209. doi: 10.1073/pnas.0502857102. [DOI] [PMC free article] [PubMed] [Google Scholar]
- 9.Wang Y, Zhang N, Zhang L, Li R, Fu W, Ma K, Li X, Wang L, Wang J, Zhang H, Gu W, Zhu WG, Zhao Y. Autophagy regulates chromatin ubiquitination in DNA damage response through elimination of SQSTM1/p62. Mol Cell. 2016;63:34–48. doi: 10.1016/j.molcel.2016.05.027. [DOI] [PubMed] [Google Scholar]
- 10.Hummel R, Hussey DJ, Haier J. MicroRNAs: predictors and modifiers of chemo- and radiotherapy in different tumour types. Eur J Cancer. 2010;46:298–311. doi: 10.1016/j.ejca.2009.10.027. [DOI] [PubMed] [Google Scholar]
- 11.Wang P, Zhang J, Zhang L, Zhu Z, Fan J, Chen L, Zhuang L, Luo J, Chen H, Liu L, Chen Z, Meng Z. MicroRNA 23b regulates autophagy associated with radioresistance of pancreatic cancer cells. Gastroenterology. 2013;145:1133–1143. e1112. doi: 10.1053/j.gastro.2013.07.048. [DOI] [PubMed] [Google Scholar]
- 12.Eisenhauer EA, Therasse P, Bogaerts J, Schwartz LH, Sargent D, Ford R, Dancey J, Arbuck S, Gwyther S, Mooney M, Rubinstein L, Shankar L, Dodd L, Kaplan R, Lacombe D, Verweij J. New response evaluation criteria in solid tumours: revised RECIST guideline (version 1.1) Eur J Cancer. 2009;45:228–247. doi: 10.1016/j.ejca.2008.10.026. [DOI] [PubMed] [Google Scholar]
- 13.Hayes J, Peruzzi PP, Lawler S. MicroRNAs in cancer: biomarkers, functions and therapy. Trends Mol Med. 2014;20:460–469. doi: 10.1016/j.molmed.2014.06.005. [DOI] [PubMed] [Google Scholar]
- 14.Fang C, Dai CY, Mei Z, Jiang MJ, Gu DN, Huang Q, Tian L. microRNA-193a stimulates pancreatic cancer cell repopulation and metastasis through modulating TGF-beta2/TGF-betaRIII signalings. J Exp Clin Cancer Res. 2018;37:25. doi: 10.1186/s13046-018-0697-3. [DOI] [PMC free article] [PubMed] [Google Scholar]
- 15.Wei H, Wen-Ming C, Jun-Bo J. Plasma miR-145 as a novel biomarker for the diagnosis and radiosensitivity prediction of human cervical cancer. J Int Med Res. 2017;45:1054–1060. doi: 10.1177/0300060517709614. [DOI] [PMC free article] [PubMed] [Google Scholar]
- 16.Sun Z, Meng C, Wang S, Zhou N, Guan M, Bai C, Lu S, Han Q, Zhao RC. MicroRNA-1246 enhances migration and invasion through CADM1 in hepatocellular carcinoma. BMC Cancer. 2014;14:616. doi: 10.1186/1471-2407-14-616. [DOI] [PMC free article] [PubMed] [Google Scholar]
- 17.Hasegawa S, Eguchi H, Nagano H, Konno M, Tomimaru Y, Wada H, Hama N, Kawamoto K, Kobayashi S, Nishida N, Koseki J, Nishimura T, Gotoh N, Ohno S, Yabuta N, Nojima H, Mori M, Doki Y, Ishii H. MicroRNA-1246 expression associated with CCNG2-mediated chemoresistance and stemness in pancreatic cancer. Br J Cancer. 2014;111:1572–1580. doi: 10.1038/bjc.2014.454. [DOI] [PMC free article] [PubMed] [Google Scholar]
- 18.Yuan D, Xu J, Wang J, Pan Y, Fu J, Bai Y, Zhang J, Shao C. Extracellular miR-1246 promotes lung cancer cell proliferation and enhances radioresistance by directly targeting DR5. Oncotarget. 2016;7:32707–32722. doi: 10.18632/oncotarget.9017. [DOI] [PMC free article] [PubMed] [Google Scholar]
- 19.Zhang Y, Liao JM, Zeng SX, Lu H. p53 downregulates down syndrome-associated DYRK1A through miR-1246. EMBO Rep. 2011;12:811–817. doi: 10.1038/embor.2011.98. [DOI] [PMC free article] [PubMed] [Google Scholar]
- 20.Galluzzi L, Baehrecke EH, Ballabio A, Boya P, Bravo-San Pedro JM, Cecconi F, Choi AM, Chu CT, Codogno P, Colombo MI, Cuervo AM, Debnath J, Deretic V, Dikic I, Eskelinen EL, Fimia GM, Fulda S, Gewirtz DA, Green DR, Hansen M, Harper JW, Jaattela M, Johansen T, Juhasz G, Kimmelman AC, Kraft C, Ktistakis NT, Kumar S, Levine B, Lopez-Otin C, Madeo F, Martens S, Martinez J, Melendez A, Mizushima N, Munz C, Murphy LO, Penninger JM, Piacentini M, Reggiori F, Rubinsztein DC, Ryan KM, Santambrogio L, Scorrano L, Simon AK, Simon HU, Simonsen A, Tavernarakis N, Tooze SA, Yoshimori T, Yuan J, Yue Z, Zhong Q, Kroemer G. Molecular definitions of autophagy and related processes. EMBO J. 2017;36:1811–1836. doi: 10.15252/embj.201796697. [DOI] [PMC free article] [PubMed] [Google Scholar]
- 21.Kroemer G, Marino G, Levine B. Autophagy and the integrated stress response. Mol Cell. 2010;40:280–293. doi: 10.1016/j.molcel.2010.09.023. [DOI] [PMC free article] [PubMed] [Google Scholar]
- 22.Rangwala R, Leone R, Chang YC, Fecher LA, Schuchter LM, Kramer A, Tan KS, Heitjan DF, Rodgers G, Gallagher M, Piao S, Troxel AB, Evans TL, DeMichele AM, Nathanson KL, O’Dwyer PJ, Kaiser J, Pontiggia L, Davis LE, Amaravadi RK. Phase I trial of hydroxychloroquine with dose-intense temozolomide in patients with advanced solid tumors and melanoma. Autophagy. 2014;10:1369–1379. doi: 10.4161/auto.29118. [DOI] [PMC free article] [PubMed] [Google Scholar]
- 23.Liu X, Sun K, Wang H, Dai Y. Inhibition of autophagy by chloroquine enhances the antitumor efficacy of sorafenib in glioblastoma. Cell Mol Neurobiol. 2016;36:1197–1208. doi: 10.1007/s10571-015-0318-z. [DOI] [PMC free article] [PubMed] [Google Scholar]
- 24.Chen Y, Li X, Guo L, Wu X, He C, Zhang S, Xiao Y, Yang Y, Hao D. Combining radiation with autophagy inhibition enhances suppression of tumor growth and angiogenesis in esophageal cancer. Mol Med Rep. 2015;12:1645–1652. doi: 10.3892/mmr.2015.3623. [DOI] [PMC free article] [PubMed] [Google Scholar]
- 25.Saleh T, Cuttino L, Gewirtz DA. Autophagy is not uniformly cytoprotective: a personalized medicine approach for autophagy inhibition as a therapeutic strategy in non-small cell lung cancer. Biochim Biophys Acta. 2016;1860:2130–2136. doi: 10.1016/j.bbagen.2016.06.012. [DOI] [PMC free article] [PubMed] [Google Scholar]
- 26.Eliopoulos AG, Havaki S, Gorgoulis VG. DNA damage response and autophagy: a meaningful partnership. Front Genet. 2016;7:204. doi: 10.3389/fgene.2016.00204. [DOI] [PMC free article] [PubMed] [Google Scholar]
- 27.Paquette M, El-Houjeiri L, Pause A. mTOR pathways in cancer and autophagy. Cancers (Basel) 2018;10 doi: 10.3390/cancers10010018. [DOI] [PMC free article] [PubMed] [Google Scholar]
- 28.Carroll B, Korolchuk VI, Sarkar S. Amino acids and autophagy: cross-talk and co-operation to control cellular homeostasis. Amino Acids. 2015;47:2065–2088. doi: 10.1007/s00726-014-1775-2. [DOI] [PubMed] [Google Scholar]
- 29.Mrakovcic M, Frohlich LF. p53-mediated molecular control of autophagy in tumor cells. Biomolecules. 2018;8 doi: 10.3390/biom8020014. [DOI] [PMC free article] [PubMed] [Google Scholar]
- 30.Weintraub AS, Li CH, Zamudio AV, Sigova AA, Hannett NM, Day DS, Abraham BJ, Cohen MA, Nabet B, Buckley DL, Guo YE, Hnisz D, Jaenisch R, Bradner JE, Gray NS, Young RA. YY1 is a structural regulator of enhancer-promoter loops. Cell. 2017;171:1573–1588. e1528. doi: 10.1016/j.cell.2017.11.008. [DOI] [PMC free article] [PubMed] [Google Scholar]
- 31.Feng L, Ma Y, Sun J, Shen Q, Liu L, Lu H, Wang F, Yue Y, Li J, Zhang S, Lin X, Chu J, Han W, Wang X, Jin H. YY1-MIR372-SQSTM1 regulatory axis in autophagy. Autophagy. 2014;10:1442–1453. doi: 10.4161/auto.29486. [DOI] [PMC free article] [PubMed] [Google Scholar]
- 32.Zhao G, Li Q, Wang A, Jiao J. YY1 regulates melanoma tumorigenesis through a miR-9 ~ RYBP axis. J Exp Clin Cancer Res. 2015;34:66. doi: 10.1186/s13046-015-0177-y. [DOI] [PMC free article] [PubMed] [Google Scholar]
- 33.Inoue K, Fry EA, Frazier DP. Transcription factors that interact with p53 and Mdm2. Int J Cancer. 2016;138:1577–1585. doi: 10.1002/ijc.29663. [DOI] [PMC free article] [PubMed] [Google Scholar]
- 34.Cunningham JT, Rodgers JT, Arlow DH, Vazquez F, Mootha VK, Puigserver P. mTOR controls mitochondrial oxidative function through a YY1-PGC-1alpha transcriptional complex. Nature. 2007;450:736–740. doi: 10.1038/nature06322. [DOI] [PubMed] [Google Scholar]
- 35.Zhang Z, Yang T, Xiao J. Circular RNAs: promising biomarkers for human diseases. EBioMedicine. 2018;34:267–274. doi: 10.1016/j.ebiom.2018.07.036. [DOI] [PMC free article] [PubMed] [Google Scholar]
- 36.Memczak S, Jens M, Elefsinioti A, Torti F, Krueger J, Rybak A, Maier L, Mackowiak SD, Gregersen LH, Munschauer M, Loewer A, Ziebold U, Landthaler M, Kocks C, le Noble F, Rajewsky N. Circular RNAs are a large class of animal RNAs with regulatory potency. Nature. 2013;495:333–338. doi: 10.1038/nature11928. [DOI] [PubMed] [Google Scholar]
- 37.Yu L, Gong X, Sun L, Zhou Q, Lu B, Zhu L. The circular RNA Cdr1as act as an oncogene in hepatocellular carcinoma through targeting miR-7 expression. PLoS One. 2016;11:e0158347. doi: 10.1371/journal.pone.0158347. [DOI] [PMC free article] [PubMed] [Google Scholar] [Retracted]
- 38.Tang W, Ji M, He G, Yang L, Niu Z, Jian M, Wei Y, Ren L, Xu J. Silencing CDR1as inhibits colorectal cancer progression through regulating microRNA-7. Onco Targets Ther. 2017;10:2045–2056. doi: 10.2147/OTT.S131597. [DOI] [PMC free article] [PubMed] [Google Scholar]
- 39.Zhang X, Yang D, Wei Y. Overexpressed CDR1as functions as an oncogene to promote the tumor progression via miR-7 in non-small-cell lung cancer. Onco Targets Ther. 2018;11:3979–3987. doi: 10.2147/OTT.S158316. [DOI] [PMC free article] [PubMed] [Google Scholar]
- 40.Sang M, Meng L, Sang Y, Liu S, Ding P, Ju Y, Liu F, Gu L, Lian Y, Li J, Wu Y, Zhang X, Shan B. Circular RNA ciRS-7 accelerates ESCC progression through acting as a miR-876-5p sponge to enhance MAGE-A family expression. Cancer Lett. 2018;426:37–46. doi: 10.1016/j.canlet.2018.03.049. [DOI] [PubMed] [Google Scholar]
- 41.Li P, Yang X, Yuan W, Yang C, Zhang X, Han J, Wang J, Deng X, Yang H, Li P, Tao J, Lu Q, Gu M. CircRNA-Cdr1as exerts anti-oncogenic functions in bladder cancer by sponging microRNA-135a. Cell Physiol Biochem. 2018;46:1606–1616. doi: 10.1159/000489208. [DOI] [PubMed] [Google Scholar]
Associated Data
This section collects any data citations, data availability statements, or supplementary materials included in this article.


