

Summary
The timely enumeration of cells of nanocellulose‐producing bacteria is challenging due to their unique growth properties. To better understand the metabolism of the bacteria and better control the concentration of living cells during cultivation, a prompt cell counting technology is crucial and urgently required. In this work, two fluorescent dyes, the asymmetrical anthocyanidin dye SYBR Green I (SG) and propidium iodide (PI), were first combined for Komagataeibacter xylinus species to determine live/dead bacterial cells quantitatively and promptly. The number of live and dead K. xylinus cells determined using an epifluorescence microscope corresponded well to the results obtained using a fluorescence microplate reader. The R 2 values were 0.9986 and 0.9920, respectively, and were similar to those obtained with the LIVE/DEAD® BacLightTM commercial kit. SG/PI double‐staining showed proper efficiency in distinguishing live/dead cells for the K. xylinus strain (R 2 = 0.9898). The technology was applied to standardize four different K. xylinus strains, and the initial cell concentration of the strains was precisely controlled (no significant difference among the strains, P> 0.05). The cellulose yield per live cell was calculated, and significant differences (P < 0.05) were found among the four strains in the following order: DHU‐ATCC‐1> DHU‐ZCY‐1> DHU‐ZGD‐1> ATCC 23770. The study shows (i) the application of the SG/PI staining to standardizing inocula for bacterial cellulose production so that a more accurate comparison can be made between different strains, and (ii) the lower cost of using SG rather than the SYTO 9 of the commercially available LIVE/DEAD® BacLightTM kit.
The asymmetrical anthocyanidin dye SYBR Green I was first combined with propidium iodide to determine live/dead bacterial cells quantitatively and promptly for Komagataeibacter xylinus species. The fluorescence staining technology was applied to standardize four different K. xylinus strains in a timely fashion to give a more accurate comparison. The study is the first attempt at precise control of inoculation in bacterial nanocellulose production.
![]()
Introduction
Komagataeibacter xylinus (formerly Acetobacter xylinum or Gluconacetobacter xylinus) is a type of acetic acid bacterium that is the most efficient producer of bacterial nanocellulose (BNC). BNC is a nanostructured biomaterial that has unique physicochemical features, such as high purity (free of lignin and hemicellulose), high specific surface area, high degree of crystallinity, high degree of polymerization, high wet tensile strength and good biocompatibility (Bielecki et al., 2002; Pichetha et al., 2017). Bacterial nanocellulose has attracted increasing attention due to its excellent properties and great potential in wide applications in the fields of paper, textiles, food, cosmetics, advanced materials and biomedicine (Bielecki et al., 2002; Reiniati et al., 2016; Chen et al., 2018). Currently, more studies have focused on the utilization of BNC in biomedical materials, such as vascular graft material (Klemm et al., 2001; Fink et al., 2010; Tang et al., 2016), wound treatment material (Fu et al., 2013; Sulaeva et al., 2015) and many other biomedical fields (Pichetha et al., 2017).
As a species with great potential in the production of the high‐value biomaterial BNC, K. xylinus is a special microorganism with unique metabolic and growth properties. With extensive work experience in this specific field, we find it necessary to establish a method for prompt cell enumeration of the K. xylinus strains during growth and to provide a relatively precise control of the initial living cell concentration in inocula of the strains with the method. Thus, a more accurate comparison of BNC yields among different strains can be made with normalized inocula. This method is crucial but also more challenging for K. xylinus compared with other typical microorganisms, such as the bacterium Escherichia coli and the yeast Saccharomyces cerevisiae. This is because K. xylinus cells grow simultaneously with the synthesis of BNC, which enwraps the bacterial cells (Bielecki et al., 2002). This makes it difficult to release all the cells from the bacterial cellulose for enumeration.
The unique growth properties of K. xylinus strains have made the inherent shortcomings of traditional cell enumeration methods more prominent. Turbidimetric measurement has been considered a method of low sensitivity (Martens‐Habbena and Sass, 2006), whereas for strains of K. xylinus, the absorbance value could be much lower in the early stage of culture and could be influenced by the cell‐nanocellulose matrix during cultivation. The cell dry weight measurement is also not accurate for the same reason. The plate counting method is often associated with large standard deviations and underestimation of microbial cell abundance (Lennon and Jones, 2011). Furthermore, application of the plate counting method on the K. xylinus strains, which have a relatively long growth cycle, makes it more time‐consuming. Plate counts with K. xylinus are also complicated by pellicle formation/BNC. Therefore, developing a prompt cell enumeration method is a hot topic in the area of BNC production, with the aim of better understanding the metabolism of the strain and providing better on‐line control during cultivation. Fluorescence staining technology has been used in the quantitative research of microbial cells in order to improve the accuracy and shorten the time span of measurement. A double‐staining method has been developed to distinguish live and dead bacterial cells during growth. The LIVE/DEAD® BacLightTM commercial kit is well known and widely used and employs a combination of the dyes SYTO 9 and PI. The double‐staining kit has various applications, including water quality testing (Boulos et al., 1999; Barbesti et al., 2000), detection of environmental or soil microorganisms (Pascaud et al., 2009), antibacterial activity assessment (Liato et al., 2017; Bankier et al., 2018) and food quality control (Fernandez‐Perez et al., 2019). However, the SYTO 9/PI assay was not always suitable for the direct quantification of various bacteria, such as Borrelia burgdorferi (Feng et al., 2014). In addition, the price of the kit is rather high, limiting its wider application in more fields. This makes it urgent for researchers to develop a new combination of dyes for the use of fluorescence technology.
Asymmetrical cyanine dye SYBR Green I (SG) could replace SYTO 9 in the commercial kit. SG is a commonly used fluorochrome for staining nucleic acids in agarose gels within molecular biology techniques. SG has been reported to bind dsDNA more tightly and efficiently than SYTO 9 (Monis et al., 2005) and to have a stronger fluorescence intensity of DNA/dyes compared with SYBR Gold, SYBR Green II, SYBR Safe and SYTO 9 under identical excitation (Barbesti et al., 2000; Chung et al., 2015). The purpose of using the SYBR Green I/PI assay is to assess whether the combination works similarly to the SYTO 9/PI (LIVE/DEAD® BacLightTM commercial kit) assay and has a comparable or even better efficiency when used on the K. xylinus strains. The SG/PI staining technique has been used for viability assessment of some bacteria, including Bacillus subtilis (Barbesti et al., 2000), B. burgdorferi (Feng et al., 2014), Citrobacter freundii (Duedu and French, 2017), E. coli (Barbesti et al., 2000; Duedu and French, 2017; Feng et al., 2018), Staphylococcus aureus, Klebsiella pneumoniae and Acinetobacter baumannii (Feng et al., 2018). In a previous study measuring the viability of B. burgdorferi (Feng et al., 2014), the SG/PI assay was found to be superior to all the assays used (including the LIVE/DEAD® BacLightTM assay with the combination of SYTO 9 and PI) in terms of sensitivity, accuracy, reliability and efficiency. However, the SG/PI assay has not been evaluated on the nanocellulose‐producing bacterium K. xylinus as a viability stain. Our group has preliminarily described the use of the SG/PI staining technique on K. xylinus strain ATCC 23770 in a patent (Hong et al., 2013, https://worldwide.espacenet.com/), which is a relatively early use of the two fluorescent dyes. In this study, more detailed work has been performed to investigate and evaluate this method, including precise inoculation for comparison of BNC yields between different strains and prompt monitoring of the cultivation process of four different K. xylinus strains.
To verify the assay's reliability and effectiveness for prompt enumeration of cells of K. xylinus strains during growth, a comparison of the SYTO 9/PI (LIVE/DEAD® BacLightTM) kit and the SG/PI staining was performed. Standard curves were built for rapid processing and analysis with an epifluorescence microscope and a fluorescence microplate reader. These two instruments are usually available in ordinary biological laboratories and worked properly for the K. xylinus strains. In previous work using the double‐staining method, flow cytometry was popularly used to quantify other bacteria (Barbesti et al., 2000; Berney et al., 2007). While more common instruments have been selected in this work, flow cytometry may have potential in this field because this method may enrich information about the K. xylinus strains. The efficiency of distinguishing live and dead bacterial cells was evaluated. Practical utilization of the staining method was performed with four K. xylinus strains to investigate differences in growth and BNC production. With the enumeration method, the initial cell number of the inoculum can be precisely controlled, which is a completely new attempt in the area of BNC production. This work provides an efficient and convenient analysis tool to further investigate K. xylinus strains.
Results and discussion
Fluorescence enumeration method
As indicated in Fig. 1A, a photograph of K. xylinus ATCC 23770 cells was taken after staining with the SYBR Green I and PI mixture. The cells with green fluorescence represent living bacterial cells, and those with red fluorescence represent dead cells. In the photograph, rod‐shaped bacterial cells can be clearly observed in a microscopic field, and the living and dead bacterial cells can be efficiently distinguished using the two fluorescent dyes. The four K. xylinus strains in the current study showed a similar view of rod‐shaped cells distinguished in red and green fluorescence in microscopic photographs when stained with SG/PI mixture (not shown).
Figure 1.

Epifluorescence photographs (qualitative analysis). (A) Arbitrary photograph of the cells of K. xylinus ATCC 23770 stained with SG and PI. (B) BNC membrane after treatment at 30ºC for 1 h with cellulase from Trichoderma viride.
For BNC‐producing strains, cells grow not only in the liquid phase, but also in the cellulose phase. In order to enumerate living cells in the cellulose phase, a preliminary attempt to use cellulase from Trichoderma viride (400 U mg−1 indicated activity on the vial) of 10 mg ml−1 to dissolve the BNC membrane matrix at 30°C for 1 h was made, as indicated in Fig. 1B. The results showed that it was difficult to dissolve the cellulose membrane completely within a practically reasonable time period. The partially dissolved cellulose gave strong background fluorescence because the cellulose fragments adsorbed the staining dyes in a nonspecific manner. To implement the fluorescence method, a resuspended cell solution needs to be made with saline; the method is more applicable to testing liquid samples, where impurities, including cultural media and cellulose, are easier to remove, and free cells can be collected with filtration methods.
As indicated in Fig. 2, regression lines were built with the cell number from fluorescence microscopy (x‐axis) and the fluorescence intensity from the microplate reader (RFU, y‐axis). A comparison was made to evaluate the quantitative determination efficiency of SG/PI double‐staining and SYTO 9/PI staining (BacLightTM 7012 Kit). For the SG/PI staining, a direct linear correlation between cell number and RFU was observed using a double logarithmic plot, and the values of R 2 were 0.9986 and 0.9920 for the live and dead cells respectively. This result was comparable to that using the combination of SYTO 9 and PI, where the R 2 values were 0.9924 and 0.9943 for live and dead cells respectively.
Figure 2.
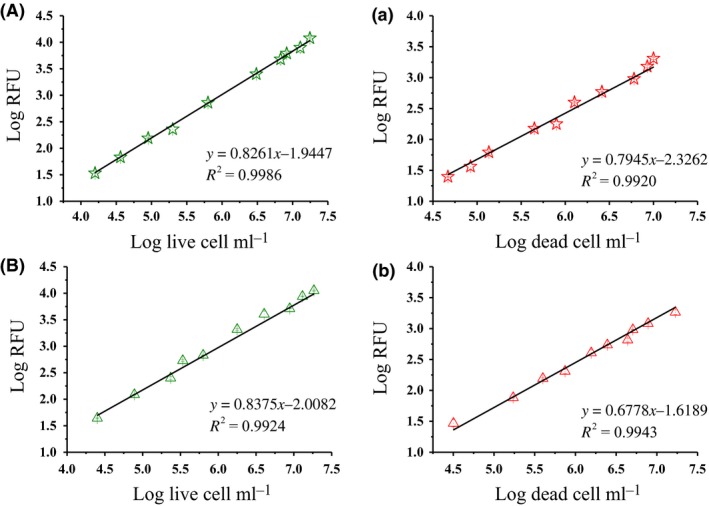
Quantitative determination of the cells of K. xylinus ATCC 23770 with SG/PI (A, a) and BacLightTM 7012 kit (B, b). Regression lines of cell number counted with fluorescence microscopy (x‐axis) and fluorescence intensity in a microplate reader (RFU, y‐axis). The dead cells were made by 0.5% glutaraldehyde treatment for 1 h.
The SG/PI stain mixture showed similar R 2 values as the commercial kit, which indicates that both of them can be used for quantitative detection of K. xylinus cells. The SYBR green I dye is significantly less mutagenic than ethidium bromide (Abiodun et al., 2010) and has been shown a very low mutagenic effect (Singer et al., 1999). The commercial LIVE/DEAD® BacLightTM Kit costs approximately 700 USD, which is adequate for approximately 1000 assays (each assay consists of a 200 µl system in each well of 96‐well microplate); therefore, the price for each assay is approximately 0.7 USD. The price of SYBR Green I (5 ml, 10 000 × stock solution) is approximately 383 USD and 25 mg PI costs approximately 54 USD. For each assay (similarly, a 200 µl system), the final additions of dyes were 0.04 µl of 10 000 × stock solution of SYBR Green I and 2 µg PI, making the final price approximately 7.4 × 10‐3 USD. The application of SG/PI staining would greatly decrease the cost of detection of viable and dead bacteria, which could be much more suitable for large quantities of tests in practical use.
To evaluate the efficiency of SG/PI staining in distinguishing viable and dead cells of K. xylinus strains, an experiment was designed, and the results are shown in Fig. 3. Relative fluorescence intensities (RFU) at 480/530 nm for SG (green fluorescence) and at 480/630 nm for PI (red fluorescence) were determined, and the green/red fluorescence ratio (G/R ratio) was calculated for each proportion of live/dead bacterial cells. The high correlation between the percentage of live cells of K. xylinus (x‐axis) and the G/R ratio (y‐axis) was obtained, and the value of R 2 reached 0.9898, indicating a high quantification efficiency.
Figure 3.

Efficiency of distinguishing live/dead cells with the SG/PI staining method.
To verify the epifluorescence enumeration method, the number of K. xylinus enumerated with the SG/PI method was compared with that detected using the typical spread‐plate counting method. Any data points represent the mean value of three technical replicates, which means one sample was tested in triplicate with the plate spread method and the fluorescent staining method respectively. As indicated in Fig. 4 with a double logarithmic plot, the R 2 value of the regression line is 0.9883, indicating a good correlation between the enumeration result obtained from the SG/PI assay and that from plate counts. However, the quantification results of fluorescent dyes were at least one order of magnitude higher than that of plate counts. It has long been recognized that microbial cells may exist in ‘cryptobiotic’, ‘dormant’, ‘moribund’, or ‘latent’ states, in which they will not form colonies on nutrient media but may have other measurable activity (Davey, 2011). Traditional cultivation techniques underestimate microbial abundance and diversity by multiple orders of magnitude (Lennon and Jones, 2011). The fluorescence enumeration method might be more accurate than traditional plate counting methods. On the other hand, the fluorescence method greatly shortens the time span required for measurement and makes it possible to enumerate the cells in a timely manner.
Figure 4.

Comparison of the SG/PI staining assay with the plate counting method.
Anthocyanidin SG has been applied successfully in the detection of nucleic acids through fluorescence imaging technology. This stain selectively binds to dsDNA and is less prone to interference with various chemical compounds (Martens‐Habbena and Sass, 2006). PI can readily enter nonviable cells and bind to dsDNA. PI was used to test the loss of membrane integrity of Escherichia coli, Listeria monocytogenes and Saccharomyces cerevisiae, and membrane damage was determined as increased uptake of PI with spectrofluorimetry (Garcia‐Gonzalez et al., 2010). The membrane integrity of a cell is a well‐accepted criterion for characterizing viable cells and distinguishing them from damaged and membrane‐compromised cells (Gregori et al., 2001). SYTO 9 penetrates all bacterial membranes and stains the cells green, while PI only penetrates cells with damaged membranes, and the combination of the two stains produces red fluorescing cells (Boulos et al., 1999) For the SG/PI combination, it is also expected that SG is a membrane permeable dye that stains all live cells green, whereas PI is an impermeant dye that stains only dead or damaged cells with a compromised cell membrane red (Feng et al., 2014; Feng et al., 2018). Hence, this assay allows us to distinguish viable from damaged and membrane‐compromised bacterial cells. However, PI uptake is actually dependent on the physiological state of the bacterial cells (Shi et al., 2007), and a recent study (Kirchhoff and Cypionka, 2017) found that the membrane potential of cells could also affect the uptake of PI in viable cells, which would lead to the erroneous conclusion that PI‐stained cells were dead. It has also been reported that the accumulation of succinate from fumarate respiration could induce PI permeability in Shewanella decolorationis biofilm cells, and the PI‐permeable membrane could be repaired in situ when the extracellular succinate was eliminated by switching fumarate respiration to electrode respiration (Yang et al., 2015). To eliminate possible errors, the cell membrane potential of K. xylinus strains and the uptake of PI in viable cells requires further investigation.
Use of the enumeration method in BNC production
As indicated in Fig. 5, the method was used in the cultivation of four K. xylinus strains to investigate cell growth and BNC production. It should be noted that when different strains are compared in terms of their growth profiles and activities, their initial live cell number must be normalized. However, normalization might be more challenging for BNC‐producing strains because of their unique characteristics. The four strains may have different growth rates, and cellulose might form with cell growth and impede the determination of cell number. The normalization can hardly be realized with traditional methods, such as turbidimetric or dry mass measurements. With the current prompt fluorescence enumeration method, normalization of BNC‐producing strains can be realized, and the method is capable of providing precise control of the living cell concentration at the beginning of fermentation.
Figure 5.

Difference in cultivation of four K. xylinus strains. (A) Number of living planktonic cells in culture broth. (B) BNC yield. (C) Glucose consumption per cell. (D) BNC yield per cell. Symbols indicate significant differences, (*) for P < 0.05, (**) for P < 0.01 and (***) for P < 0.001. Symbol # indicates no significant difference (P> 0.05). Each column in the figures represents three replicates, and error bar stands for SD (standard deviation) of the mean. The data in Fig. 6A, 6 and 6 refer only to live planktonic cells in the culture media.
For each strain, a standard curve of microplate RFU readings and cell numbers enumerated with epifluorescence photographs was established. The living cell concentration in seed cultures was analysed, and fresh medium was mixed together with the seed culture to make an initial live cell concentration of approximately 5 × 10⁶ per ml in the cultures. For DHU‐ATCC‐1 and ATCC 23770, living cells in seed culture can grow to relatively high concentrations, and only inocula of 5–10% (v/v) of final culture volume were required to reach the designed live cell concentration (5 × 10⁶ per ml). As indicated in Fig. 5A, the initial live cell concentrations in cultures of DHU‐ATCC‐1 and ATCC 23770 were 4.50 ± 0.10 × 10⁶ per ml and 4.91 ± 0.51 × 10⁶ per ml respectively. However, it is relatively difficult to obtain high cell concentrations in DHU‐ZGD‐1 and DHU‐ZCY‐1 seed cultures; therefore, inocula of 40–60% (v/v) of final culture volume were usually needed to reach the designed live cell concentration (5 × 10⁶ per ml), namely the initial live cell concentrations in cultures of DHU‐ZCY‐1 and DHU‐ZGD‐1 were 4.41 ± 0.16 × 10⁶ per ml and 4.83 ± 0.75 × 10⁶ per ml (Fig. 5A) respectively. In this way, the initial live cell concentration in each culture of the four strains was precisely controlled. As indicated in Fig. 5A, with the prompt counting method, no significant difference (P> 0.05) in live cell concentration was found at the beginning of cultivation (0 days) among the four strains.
After inoculation, shaked cultivation was performed at 30°C for all the strains from 0 to 24 h. In the meantime, cellulose began to be produced, and tiny cellulose pellicles or a small floc of cellulose could be observed in the cultures after 24th h. Static cultivation was then performed after 1 day. On day 5, the living cell concentration in the liquid phase of the ATCC 23770 culture reached 20.6 ± 2.3 × 10⁶ per ml and was significantly (P < 0.01) higher than that in DHU‐ATCC‐1 (14.1 ± 2.1 × 10⁶ per ml). However, on day 5, living cell concentrations in DHU‐ZGD‐1 and DHU‐ZCY‐1 (7.1 ± 1.3 and 5.8 ± 1.9 × 10⁶ per ml respectively) exhibited no significant difference (P> 0.05), and both were significantly (P < 0.01) lower than that in the DHU‐ATCC‐1 and ATCC 23770 cultures. At the end of cultivation (day 9), the living cell concentration in the ATCC 23770 culture (21.8 ± 2.3 × 10⁶ per ml) was significantly higher (P < 0.001) than that in DHU‐ATCC‐1 (16.1 ± 0.5 × 10⁶ per ml). Living cell concentrations in DHU‐ZGD‐1 and DHU‐ZCY‐1 (8.5 ± 1.5 and 5.9 ± 1.6 × 10⁶ per ml respectively) changed slightly compared with the results on day 7.
In static cultures for BNC production, a small amount of living cells are distributed in the liquid phase of the culture, while the vast majority of living cells are embedded in the solid cellulose phase (Bielecki et al., 2002). It has been reported that K. xylinus cells accumulate at the air/liquid interface (Tang et al., 2016), and the liquid phase that is far away from air might contain less oxygen, causing fewer cells to be distributed in the liquid phase. In the cellulose membrane, the living cells also have non‐uniform distribution in the vertical direction, where living cells mainly distribute in the shallow outer region of BNC membrane that is close to the air/oxygen, while in the deep inner region living cells can hardly be observed (Tang et al., 2016; Zhang et al., 2016). The limitation of this work is that the current living cell results are only relevant to the free cells suspended in the liquid phase. However, the analysis of the cells embedded in the cellulose membrane has not been properly performed. Further research regarding the distribution of bacterial cells in the new interfaces (air/BNC and BNC/liquid interfaces) should be performed in a future study, which especially depends on the progress in the staining and quantification technology for the cells in BNC membrane. To remove the cellulose matrix to determine the wrapped cells, cellulase hydrolysis should be performed. Cellulase normally requires 50°C for efficient hydrolysis. A current study found that none of the four BNC‐producing strains were able to grow at temperatures higher than 30°C; at 30°C or lower temperatures, it was impossible to release all living cells from the cellulose matrix without efficient cellulase performance. Attempting to achieve cellulase activity with higher enzyme activity at lower temperatures and with better methods for the separation of cells from the cellulose matrix would be an interesting topic for future studies to investigate the total viable cell amount. Additionally, it should be noticed that the dead cells in each of the four strains were not measured, as the focus in the study was to precisely control the inocula in order to make a more accurate comparison of BNC yield among the four strains. The proportion of dead cells in the inocula and continuing cultures should not impact the current comparison results. However, it would be better to know if some of the strains were prone to lower viability during continuous cultivation, and thus, more characteristics of the strains would be given in the comparison. Further studies are therefore required to provide more information about the strains.
As shown in Fig. 5C, the glucose consumption per cell (QPC) was calculated to provide a better comparison among the four strains. All the cultures of the four strains started with an initial glucose concentration of 25 g l−1. After 9 days of cultivation, the residual glucose concentration was near 0 g l−1 for all four strains. The DHU‐ATCC‐1 strain exhibited a significantly higher (P < 0.05) QPC than the other three strains, and the order is shown as DHU‐ATCC‐1> DHU‐ZCY‐1> DHU‐ZGD‐1> ATCC 23770.
Crude BNC yields were determined on day 9. As indicated in Fig. 5B, DHU‐ZCY‐1, DHU‐ZGD‐1, DHU‐ATCC‐1 and ATCC 23770 demonstrated BNC yields of 12.82 ± 0.18 g l−1, 12.93 ± 0.49 g l−1, 14.78 ± 0.43 g l−1 and 8.65 ± 0.83 g l−1 respectively. No significant differences were found among the first three strains (P> 0.05), but ATCC 23770 exhibited significantly lower (P < 0.001) BNC yield than the others. The BNC yield per cell (YPC) showed a significant difference among the first three strains (Fig. 5D). The YPC of DHU‐ZCY‐1 was significantly lower (P < 0.01) than DHU‐ATCC‐1 and was significantly higher (P < 0.05) than DHU‐ZGD‐1. YPC of ATCC 23770 was significantly lower (P < 0.01) than DHU‐ZGD‐1 and was the lowest among the four strains. These results suggest that BNC production is strain‐dependent. Different strains exhibited significant differences in live cell accumulation in the liquid phase, glucose consumption per cell and BNC yield per cell. It is necessary to emphasize that the quantification of live cells refers only to the planktonic ones in the culture medium. Therefore, the calculated glucose consumption and BNC yield per cell may be distorted, taking into account that the strains may or may not have different proportions of planktonic or BNC‐associated cells.
The experiment in the current study was designed to illustrate the importance of precise control of viable cell concentration in inocula for BNC production. As indicated in Fig. 6, the initial cell concentration had a significant influence on the BNC yield. For the DHU‐ATCC‐1 strain (Fig. 6A), the ATCC‐C2 culture had an initial cell concentration of 3.85 × 10⁶ cell ml−1, which was significantly (P < 0.01) higher than that of the ATCC‐C1 culture (2.85 × 10⁶ cell ml−1). Consequently, (shown in Fig. 6A), the BNC yield of ATCC‐C2 culture (14.8 g l−1) was significantly higher (P < 0.001) than that of ATCC‐C1 culture (10.2 g l−1). For the DHU‐ZCY‐1 strain, the same result was obtained. As indicated in Fig. 6B, ZCY‐C2 culture had an initial cell concentration of 5.96 × 10⁶ cell ml−1, which was significantly (P < 0.001) higher than that of ZCY‐C1 culture (4.01 × 10⁶ cell ml−1). As a result, shown in Fig. 6B, the BNC yield of ZCY‐C2 culture (14.7 g l−1) was significantly higher (P < 0.01) than that of ZCY‐C1 culture (12.8 g l−1).
Figure 6.

Effects of initial living cell concentration on BNC yield. The initial cell concentration (A) and BNC yield (a) of DHU‐ATCC‐1 as well as the initial cell concentration (B) and BNC yield (b) of DHU‐ZCY‐1 are shown. ATCC‐C1 and ATCC‐C2 refer to two cultures of the strain DHU‐ATCC‐1. ZCY‐C1 and ZCY‐C2 refer to two cultures of the strain DHU‐ZCY‐1. The two cultures were derived from two individual seed cultures of each strain. The two individual seed cultures were just prepared for the design of two different initial concentrations of live cells. The two different initial concentrations of live cells were used to start fermentation at day 0. Each seed culture had biological triplicates with three colonies. Symbols indicate significant differences, (*) for P < 0.05, (**) for P < 0.01, and (***) for P < 0.001. Symbol # indicates no significant difference (P> 0.05).
The current results indicated the significance of controlling the initial living cell concentration in BNC production and indicate that traditional inoculation technology based on inoculum volume would cause large errors in the experiment. For scientific studies with a small amount of inoculum and especially in a comparison study of various strains, a more precise control of the viable cells would be necessary. With the prompt fluorescence enumeration method described here, more precise control for inoculation of K. xylinus strains is possible and would be beneficial to better understand the strains in future investigation.
In conclusion, an enumeration method has been developed with SG and PI double‐fluorescent staining. The assay can be performed in < 1 h, and it yields both quantitative and qualitative information for each analysed sample. Standard curves were established by means of the results from epifluorescence microscopy and fluorescence microplate readers. The results indicated that this method can be applied to distinguish live and dead cells of K. xylinus quantitatively in due course. The established method was successfully used to provide precise control of living cell concentration at the beginning of cultivation. By using the method, it is able to standardize the inocula of different K. xylinus strains to make more accurate comparison of the strains. The experimental results show that the initial concentration of viable cells has a significant (P < 0.05) influence on the BNC yield, indicating the necessity to provide precise control of the living cell number at the beginning of cultivation. The cost of SG/PI combination is only approximately 1% of that of commercially available LIVE/DEAD® BacLightTM Kit, making it competitive in the field of enumeration of bacterial cells as well as the practical application in BNC production with K. xylinus. However, the detection of living cells in BNC membranes using this method is also demanded, and further investigation is therefore required.
Experimental procedures
Microorganisms and media
Komagataeibacter xylinus ATCC 23770 was obtained from the American Type Culture Collection (Manassas, VA, USA). DHU‐ZCY‐1, which is deposited as CGMCC 1186 (China General Microbiological Culture Collection Center, Beijing, China), was obtained from Hainan Yeguo Foods Co., Ltd (Hainan, China). DHU‐ATCC‐1 and DHU‐ZGD‐1 are random mutants of ATCC 23770 and DHU‐ZCY‐1, respectively, which were obtained with chemical and physical standard methods (nitrite impregnation combined with UV radiation). All strains were kept at −80°C and activated in liquid culture broth before use.
The culture medium used for the four K. xylinus strains contained 2.5% (w/v) glucose, 0.3% (w/v) tryptone and 0.5% (w/v) yeast extract. The pH value in the media was adjusted to 5.0 with a small amount of 4 M H2SO4 aqueous solution before autoclaving.
Preparation of two fluorescent dyes
SYBR Green I dissolved in dimethylsulfoxide (CAS: 163795‐75‐3, MW: 509.73 g mol−1) and PI in crystalline powder state (CAS: 25535‐16‐4, MW: 668.39 g mol−1) were obtained from Sigma‐Aldrich (St Louis, MO, USA), and the molecular formulas are shown in Fig. 7A and B respectively. According to the product instructions, the SG reagent was originally 100 00×, and it is suggested that it first be diluted 10‐fold with 10 mM Tris‐HCl buffer and 1 mM EDTA (pH 8.0) to obtain an SG stock solution. A PI stock aqueous solution of 10 mg ml−1 was prepared by dissolving the crystalline powder in double‐distilled water. Both dye stock solutions were aseptically filtered with 0.22 μm pore size filter membranes (Millipore, Billerica, MA, USA). Before use, both stock solutions were diluted 100 times with a 0.85% NaCl aqueous solution to make corresponding working solutions.
Figure 7.

Molecular formulas of three fluorescent stains: (A) SYBR Green I, (B) PI and (C) basic structure of SYTO compounds.
A BacLight live/dead bacterial viability fluorescence staining kit (Invitrogen, Grand Island, NY, USA) was used for comparison with the SG/PI double‐staining method. The kit contains SYTO 9 and PI as the two stains used for distinguishing live/dead bacterial cells. Figure 7C shows the basic structure of the SYTO compound (Haugland et al., 1995), which is quite different from that of SYBR Green I.
Preparation of live and dead bacterial cell samples
A seed culture for inoculum was prepared by transferring a single colony of K. xylinus ATCC 23770 from an agar plate (culture medium supplemented with 20 g l−1 agar) in the culture medium of 100 ml, which was then incubated at 30°C and 180 rpm for 24–36 h. (i) The K. xylinus cells in 10 ml culture were collected using filtration by 0.22 μm membrane filters in a 1225 sampling manifold (Millipore). The cells were washed with 20 ml 0.85% saline and collected by filtration to remove the medium component, which might influence fluorescence signals. Then, the cells on the filter membrane were resuspended in 0.85% saline. (ii) Five millilitres of this suspension was taken after gentle mixing and then added to a 50 ml centrifuge tube containing 20 ml of 0.85% NaCl aqueous solution to make a living cell suspension. (iii) Similarly, five millilitres of the suspension was taken again and added to a 50 ml centrifuge tube containing 20 ml of 2.5% glutaraldehyde and incubated for 1 h to kill bacterial cells. The cells were then collected by filtration to remove the chemical components, which may influence the fluorescence stains. The cells were resuspended in 5 ml of 0.85% NaCl aqueous solution to obtain the dead cell suspension.
The live and dead cell suspension was mixed with the following volume to make a gradient proportion of living cells as follows: 0 ml live per 2.0 ml dead (0% live cell proportion), 0.2 ml live per 1.8 ml dead (10% live cell proportion), 1.0 ml live per 1.0 ml dead (50% live cell proportion), 1.8 ml Live per 0.2 ml dead (90% live cell proportion) and 2.0 ml live per 0 ml dead (100% live cell proportion).
The mixed cell suspension was treated with double‐staining as described in the section Bacterial enumeration with a fluorescence microplate reader, and a green/red (G/R) fluorescence ratio was calculated with the following equation.
Green and red fluorescence values were determined at excitation/emission wavelengths of 480/530 nm (for SYBR Green I) and 480/630 nm (for PI) using a multifunctional microplate reader workstation Flexstation II (Molecular Devices, San Jose, CA, USA).
Treatment of a bacterial nanocellulose pellicle with cellulase
A thin BNC pellicle of 4 × 4 mm in a fresh culture of 1 ml was selected for the cellulase treatment. The dosage of the cellulase from Trichoderma viride (Shanghai Yuanye Bio‐Technology Co., Ltd, Shanghai, China) was 10 mg ml−1 (400 U mg−1 indicated activity on the vial). After 1 h of hydrolysis at 30°C, photographs were taken using epifluorescence microscopy.
Bacterial enumeration with epifluorescence microscopy
The resuspended cells described in the above section were diluted with 0.85% NaCl aqueous solution, and 0.7 ml was added to 2 ml Eppendorf tubes. SG and PI working solutions were mixed at a volume ratio of 2:1, and 0.3 ml of the mixture was added to the cell suspension and kept in the dark for 15 min. The stained cell suspension was transferred into a blood cell counting chamber in a dark room. Low‐fluorescence Cargill immersion oil was added to the glass coverslip of the chamber. An epifluorescence microscope equipped with a 100 × oil objective lens (Olympus BX53, Tokyo, Japan) was used for epifluorescence counting. Generally, 8–10 photographs were counted for each sample. Photographs were taken at 485 nm excitation light to capture green fluorescing microorganism cells and then at 493 nm for red fluorescence with the same photograph area. The two photographs were processed with cellSens Standard software (Olympus) to obtain one integrated photograph with the green and red fluorescence. The cell concentration was calculated using the following equation:
where N refers to the cell number observed in a field under the microscope. A refers to the area of a photograph taken with a digital camera. H refers to the height of the counting chamber.
Bacterial enumeration with a fluorescence microplate reader
The same resuspended cell sample used for epifluorescence microscopy was also used for the microplate reader analysis. A suspension of 140 μl was dispensed into three wells of a 96‐well plate, and a control was made with the same volume of 0.85% saline. SG and PI were mixed at a volume ratio of 2:1, and 60 μl of the mixture was added into each well. The optimal concentration was also determined by adding different concentrations of dyes. The plate was incubated at room temperature in the dark for 15 min, and the relative fluorescence units (RFU) were determined with a Synergy H4 Hybrid Microplate Reader (BioTek Instruments, Winooski, VT, USA) at the following excitation/emission wavelengths: 480/530 nm for SG and 480/630 nm for PI. A commercial fluorescence staining kit 7012 containing SYTO 9 and PI (Invitrogen) was first diluted with 0.85% saline according to the protocol from Invitrogen. Then, 60 μl was added to wells with 140 μl cell suspension. All measurements were performed in triplicate.
Regression lines of the number of K. xylinus cells (x‐axis) and corresponding fluorescence intensities (y‐axis) were made. The cell number (x‐axis) was observed using an epifluorescence microscope and calculated using the method described in the above section. The same sample was stained and measured with a fluorescence microplate reader. With the equation obtained from the regression lines, the y‐axis values determined with the microplate reader were used to calculate and obtain the cell number (x‐axis) in the sample. For one or few samples, living cell concentration can be obtained with the epifluorescence microscope method directly; however, for a large quantity of tests, the microplate reader method is efficient and necessary to decrease the work load.
Bacterial enumeration with a culture plate counting method
Komagataeibacter xylinus culture was first put into cell suspension, and gradient dilutions of 10, 100, 200, 500 and 1000 times were made with 0.85% saline. A diluted suspension of 100 μl was taken and spread on agar plates in triplicate. The plates were incubated at 30°C for 48 h, and the colony forming units were enumerated with a colony automatic counter (Shineso, Hangzhou, China). The same diluted suspension was dyed with SG and PI, and the fluorescence values were detected with the microplate reader as described in the above section.
Normalization of four K. xylinus strains with enumeration method
The seed cultures of the four strains were prepared as follows. (i) One colony of each strain was inoculated into 100 ml culture medium and cultivated with a shaking speed of 180 r min−1 for 24–36 h to produce a seed‐1 culture. (ii) For ATCC 23770 and DHU‐ATCC‐1 strains, 5 ml seed‐1 culture was added to 95 ml seed‐2 culture. The seed‐2 culture was cultivated at 30°C with a shaking speed of 180 r min−1 for 12–24 h and then analysed with the enumeration method. (iii) For DHU‐ZCY‐1 and DHU‐ZGD‐1 strains, the seed‐1 cultures were cultivated statically for 3–5 days until jelly cellulose pellicles were observed in the cultures. Each whole jelly cellulose pellicle was cut into small pieces with sterile surgical scissors and added into 100 ml seed‐2 culture. Seed‐2 culture was cultivated at 30°C with a shaking speed of 180 r min−1 for 12–24 h and then analysed with the enumeration method.
The fluorescence value of each seed culture was detected using a microplate reader and was used to calculate the living cell concentration according to the standard curves established in advance. Each cultivation started with approximately 5 × 10⁶ per ml viable cells. Different volumes of seed‐2 culture were taken according to the following formula and supplemented with fresh culture medium to reach a final volume of 30 ml with fixed cell numbers of 5 × 10⁶ per ml. The 30‐ml culture was then transferred to 50 ml Erlenmeyer flasks and cultivated with shaking at 30°C for 1 day followed by static cultivation for 8 days.
Cultivation of four K. xylinus strains
Each culture was performed in biological triplicate (The cultures were grown from three different colonies initially, and the same initial live cell numbers were precisely transferred in three same‐sized bottles after enumeration with the SG/PI staining). On the first day, the inocula of each colony were prepared at 30°C and 180 rpm to rapidly obtain the cells. From the 1st day to the 9th day, static cultivation was performed to obtain a cellulose membrane. Samples were taken aseptically at 0 and 24 h and then every other day. Cell viability in each culture was analysed immediately with the microplate reader enumeration method. Residual glucose in the culture broth was detected using an Accu‐Chek Aviva glucometer (Roche Diagnostics GmbH, Mannheim, Germany), and BNC yield was quantified gravimetrically on the basis of dry weight as described previously (Zou et al., 2017). Each analysis was performed in triplicate, and the mean value was given.
The glucose consumption per cell (Q PC) was calculated using the following equation:
The BNC yield per cell (Y PC) was calculated using the following equation:
Effects of initial living cell concentration on BNC yield
The strains DHU‐ZCY‐1 and DHU‐ATCC‐1 were selected to investigate the effects of initial living cell concentration on BNC yield. Two individual seed cultures of each strain were prepared for the design of two different initial concentrations of live cells and then enumerated with the fluorescence staining method. The two different initial concentrations of live cells were used to start fermentation at 0 day to observe whether higher initial cell concentration could result in higher BNC yield. For each seed culture, three biological replicates were performed with three colonies initially.
Statistical analysis
One‐way ANOVA (analysis of variance) was performed to analyse the significance of the experimental data. In all cases, P < 0.05 indicates statistical significance, and the data are marked with (*) for P < 0.05, (**) for P < 0.01 and (***) for P < 0.001. P> 0.05 was marked with (#).
Conflict of interest
None declared.
Acknowledgements
This study was supported by the National Key gs1%7Chttp://dx.doi.org/10.13039/100006190 Program of China (2018YFC1105501), the Fundamental Research Funds for the Central Universities (2232017A‐02, 2232018A3‐06 and 2232019A3‐08) and the Innovation Foundation of gs2%7Chttp://dx.doi.org/10.13039/501100006249 for Doctoral Candidates (CUSF‐DH‐D‐2015093).
Microbial Biotechnology (2020) 13(2), 458–469
Funding information
This study was supported by the National Key Research and Development Program of China (2018YFC1105501), the Fundamental Research Funds for the Central Universities (2232017A‐02, 2232018A3‐06 and 2232019A3‐08) and the Innovation Foundation of Donghua University for Doctoral Candidates (CUSF‐DH‐D‐2015093).
Contributor Information
Lin Chen, Email: lchen@dhu.edu.cn.
Feng F. Hong, Email: fhong@dhu.edu.cn.
References
- Abiodun, O.O. , Gbotosho, G.O. , Ajaiyeoba, E.O. , Happi, C.T. , Hofer, S. , Wittlin, S. , et al. (2010) Comparison of SYBR Green I‐, PicoGreen‐, and [3H]‐hypoxanthine‐based assays for in vitro antimalarial screening of plants from Nigerian ethnomedicine[J]. Parasitol Res 106: 933–939. [DOI] [PubMed] [Google Scholar]
- Bankier, C. , Cheong, Y. , Mahalingam, S. , Edirisinghe, M. , Ren, G. , Cloutman‐Green, E. , and Ciric, L. (2018) A comparison of methods to assess the antimicrobial activity of nanoparticle combinations on bacterial cells. PLoS ONE 13: 1–13. [DOI] [PMC free article] [PubMed] [Google Scholar]
- Barbesti, S. , Baroni, L. M. , Neri, M. G. , Sgorbati, S. , and Citterio, S. (2000) Two and three‐color fluorescence flow cytometric analysis of immunoidentified viable bacteria. Cytom Part B‐Clin Cy 40: 214–218. [PubMed] [Google Scholar]
- Berney, M. , Hammes, F. , Bosshard, F. , Weilenmann, H.U. , and Egli, T. (2007) Assessment and interpretation of bacterial viability by using the LIVE/DEAD BacLight Kit in combination with flow cytometry. Appl Environ Microb 73: 3283. [DOI] [PMC free article] [PubMed] [Google Scholar]
- Bielecki, S. , Krystynowicz, A. , Turkiewicz, M. , and Kalinowska, H. (2002) Bacterial cellulose In: Biopolymers (Polysaccharides I: polysaccharides from prokaryotes). Weinheim: Wiley‐VCH Verlag, p. 5. [Google Scholar]
- Boulos, L. , Prevost, M. , Barbeau, B. , Coallier, J. , and Desjardins, R. (1999) LIVE/DEAD BacLight: application of a new rapid staining method for direct enumeration of viable and total bacteria in drinking water. J Microbiol Meth 37: 77–86. [DOI] [PubMed] [Google Scholar]
- Chen, G. , Wu, G. , Alriksson, B. , Chen, L. , Wang, W. , Joensson, L.J. , and Hong, F.F. (2018) Scale‐up of production of bacterial nanocellulose using submerged cultivation. J. Chem Technol Biotechnol. 93: 3418–3427. [Google Scholar]
- Chung, Y. , Chen, Y. , and Chang, P. (2015) Strategies of fluorescence staining for trace total ribonucleic acid analysis by capillary electrophoresis with argon ion laser‐induced fluorescence. Electrophoresis 36: 1781–1784. [DOI] [PubMed] [Google Scholar]
- Davey, H.M. (2011) Life, death, and in‐between: meanings and methods in microbiology. Appl Environ Microb 77: 5571. [DOI] [PMC free article] [PubMed] [Google Scholar]
- Duedu, K.O. , and French, C.E. (2017) Two‐colour fluorescence fluorimetric analysis for direct quantification of bacteria and its application in monitoring bacterial growth in cellulose degradation systems. J Microbiol Meth 135: 85–92. [DOI] [PubMed] [Google Scholar]
- Feng, J. , Wang, T. , Zhang, S. , Shi, W. , and Zhang, Y. (2014) An optimized SYBR Green I/PI assay for rapid viability assessment and antibiotic susceptibility testing for Borrelia burgdorferi . PLoS ONE 9: 1–8. [DOI] [PMC free article] [PubMed] [Google Scholar]
- Feng, J. , Yee, R. , Zhang, S. , Shi, W. , Zhang, Y. , Tian, L. , and Zhang, W. (2018) A rapid growth‐independent antibiotic resistance detection test by SYBR Green/Propidium iodide viability assay. Front Med 5: 127. [DOI] [PMC free article] [PubMed] [Google Scholar]
- Fernandez, P.R. , Tenorio, R.C. , and Ruiz, L.F. (2019) Fluorescence microscopy to monitor wine malolactic fermentation. Food Chem 274: 228–233. [DOI] [PubMed] [Google Scholar]
- Fink, H. , Faxaelv, L. , Molnar, G.F. , Drotz, K. , Risberg, B. , Lindahl, T.L. , and Sellborn, A. (2010) Real‐time measurements of coagulation on bacterial cellulose and conventional vascular graft materials. Acta Biomater 6: 1125–1130. [DOI] [PubMed] [Google Scholar]
- Fu, L. , Zhang, J. , and Yang, G. (2013) Present status and applications of bacterial cellulose‐based materials for skin tissue repair. Carbohydr Polym 92: 1432–1442. [DOI] [PubMed] [Google Scholar]
- Garcia‐Gonzalez, L. , Geeraerd, A.H. , Mast, J. , Briers, Y. , Elst, K. , Van Ginneken, L. , et al. (2010) Membrane permeabilization and cellular death of Escherichia coli, Listeria monocytogenes and Saccharomyces cerevisiae as induced by high pressure carbon dioxide treatment. Food Microbiol 27: 541–549. [DOI] [PubMed] [Google Scholar]
- Gregori, G. , Citterio, S. , Ghiani, A. , Labra, M. , Sgorbati, S. , Brown, S. , and Denis, M. (2001) Resolution of viable and membrane‐compromised bacteria in freshwater and marine waters based on analytical flow cytometry and nucleic acid double staining. Appl Environ Microbiol 67: 4662–4670. [DOI] [PMC free article] [PubMed] [Google Scholar]
- Haugland, R.P. , Yue, S.T. , Millard, P.J. , and Roth, B.L. (1995) Cyclic‐substituted Unsymmetrical Cyanine Dyes. Eugene: Molecular Probes Inc, p. 24. [Google Scholar]
- Hong, F. , Zhang, S. , Du, Q. , Lan, S. , Chen, L. , and Dengxin, L. (2013) Fluorescent staining kit for rapid detection on biological cell viability, and application of same, CN103175768 (A). China: Patent. [Google Scholar]
- Kirchhoff, C. , and Cypionka, H. (2017) Propidium ion enters viable cells with high membrane potential during live‐dead staining. J Microbiol Meth 142: 79–82. [DOI] [PubMed] [Google Scholar]
- Klemm, D. , Schumann, D. , Udhardt, U. , and Marsch, S. (2001) Bacterial synthesized cellulose‐artificial blood vessels for microsurgery. Prog Polym Sci 26: 1561–1603. [Google Scholar]
- Lennon, J.T. , and Jones, S.E. (2011) Microbial seed banks: the ecological and evolutionary implications of dormancy. Nat Rev Microbiol 9: 119. [DOI] [PubMed] [Google Scholar]
- Liato, V. , Labrie, S. , and Aider, M. (2017) Study of the antibacterial activity of electro‐activated solutions of salts of weak organic acids on Salmonella enterica, Staphylococcus aureus and Listeria monocytogenes . J Ind Microbiol Biotechnol 44: 23–33. [DOI] [PubMed] [Google Scholar]
- Martens‐Habbena, W. , and Sass, H. (2006) Sensitive determination of microbial growth by nucleic acid staining in aqueous suspension. Appl Environ Microb 72: 87–95. [DOI] [PMC free article] [PubMed] [Google Scholar]
- Monis, P.T. , Giglio, S. , and Saint, C.P. (2005) Comparison of SYTO9 and SYBR Green I for real‐time polymerase chain reaction and investigation of the effect of dye concentration on amplification and DNA melting curve analysis. Anal Biochem 340: 24–34. [DOI] [PubMed] [Google Scholar]
- Pascaud, A. , Amellal, S. , Soulas, M.L. , and Soulas, G. (2009) A fluorescence‐based assay for measuring the viable cell concentration of mixed microbial communities in soil. J. Microbiol Meth 76: 81–87. [DOI] [PubMed] [Google Scholar]
- Pichetha, G.F. , Pirich, C.L. , Sierakowskia, M.R. , Woehla, M.A. , Sakakibaraa, C.N. , Souzab, C.F. , et al. (2017) Bacterial cellulose in biomedical applications: a review. Int J Biol Macromol 104(Part A): 97–106. [DOI] [PubMed] [Google Scholar]
- Reiniati, I. , Hrymak, A.N. , and Margaritis, A. (2016) Recent developments in the production and applications of bacterial cellulose fibers and nanocrystals. Crit Rev Biotechnol 37: 1–15. [DOI] [PubMed] [Google Scholar]
- Shi, L. , Günther, S. , Hübschmann, T. , Wick, L.Y. , Harms, H. , and Müller, S. (2007) Limits of propidium iodide as a cell viability indicator for environmental bacteria. Cytom Part A 71A: 592–598. [DOI] [PubMed] [Google Scholar]
- Singer, V.L. , Lawlor, T.E. , and Yue, S. (1999) Comparison of SYBR Green I nucleic acid gel stain mutagenicity and ethidium bromide mutagenicity in the Salmonella/mammalian microsome reverse mutation assay (Ames test). Mutat Res 439: 37–47. [DOI] [PubMed] [Google Scholar]
- Sulaeva, I. , Henniges, U. , Rosenau, T. , and Potthast, A. (2015) Bacterial cellulose as a material for wound treatment: Properties and modifications. A review. Biotechnol Adv 33: 1547–1571. [DOI] [PubMed] [Google Scholar]
- Tang, J. , Li, X. , Bao, L. , Chen, L. , and Hong, F. F. (2016) Comparison of two types of bioreactors for synthesis of bacterial nanocellulose tubes as potential medical prostheses including artificial blood vessels. J Chem Technol Biotechnol 92: 1218–1228. [Google Scholar]
- Yang, Y. , Xiang, Y. , and Xu, M. (2015) From red to green: the propidium iodide‐permeable membrane of Shewanella decolorationis S12 is repairable. Sci Rep 5: 18583. [DOI] [PMC free article] [PubMed] [Google Scholar]
- Zhang, P. , Chen, L. , Zhang, Q. , Jönsson, L.J. , and Hong, F.F. (2016) Using in situ nanocellulose‐coating technology based on dynamic bacterial cultures for upgrading conventional biomedical materials and reinforcing nanocellulose hydrogels. Biotechnol Prog 32: 1077–1084. [DOI] [PubMed] [Google Scholar]
- Zou, X. , Wu, G. , Stagge, S. , Chen, L. , Jonsson, L.J. , and Hong, F.F. (2017) Comparison of tolerance of four bacterial nanocellulose‐producing strains to lignocellulose‐derived inhibitors. Microb Cell Fact 16: 229. [DOI] [PMC free article] [PubMed] [Google Scholar]