

Abstract
Phthalates are used as solvents and plasticizers in a wide variety of consumer products. Most people are exposed to phthalates as parent compounds through ingestion, inhalation, and dermal contact. However, these parent compounds are quickly metabolized to more active compounds in several tissues. Although studies indicate that the phthalate metabolites reach the ovary, little is known about whether they are ovarian toxicants. Thus, this study tested the hypothesis that phthalate metabolites influence the expression of genes involved in sex steroid synthesis, cell cycle regulation, cell death, oxidative stress, and key receptors, as well as production of sex steroid hormones by mouse antral follicles. The selected metabolite mixture consisted of 36.7% monoethyl phthalate (MEP), 19.4% MEHP, 15.3% monobutyl phthalate (MBP), 10.2% monoisobutyl phthalate (MiBP), and 10.2% monoisononyl phthalate (MiNP), and 8.2% monobenzyl phthalate (MBzP). Antral follicles from adult CD-1 mice were cultured for 96 hours with vehicle control (DMSO) or metabolite mixture (0.065–325 μg/ml). Growth of follicles in culture was monitored every 24 hours. Total RNA was isolated after 24 and 96 hours and used for gene expression analysis. Media were collected and subjected to hormone analysis. Exposure to the phthalate mixture inhibited follicle growth, decreased expression of steroidogenic enzymes, and altered the levels of sex steroids relative to control. The mixture, primarily at the two highest doses, also altered expression of cell cycle regulators, apoptotic factors, oxidative stress genes, and of some receptors. Collectively, these data suggest that mixtures of phthalate metabolites can directly impact follicle health.
Keywords: phthalate mixture, antral follicle, steroidogenesis, cell cycle, apoptosis, oxidative stress
Introduction
Phthalates are a class of chemicals that are commonly used in the production of items such as personal care products (PCPs), plastics, oral medications, and medical tubing [1]. Due to annual production levels of phthalates that reach hundreds of millions of pounds, human exposure is common [2–4]. Routes of exposure include inhalation, dermal contact, ingestion, and through intravenous procedures. Human urine concentrations from environmental exposures are in the ng/mL range [3, 4], whereas oral medication and medical exposures can be in the μg/mL range [5, 6]. Metabolites of phthalates have also been detected in a wide range of human tissues, including serum, sweat, and ovarian follicular fluid [7–11]. Oral exposure results in rapid conversion by enzymes in saliva and in the gut to monoester phthalate metabolites, which are known to be more toxic than their parent compounds [12–17].
Exposures to phthalates are associated with a number of negative health outcomes [3, 4]. In men, urinary levels of phthalate metabolites have been associated with changes in serum hormone levels [18]. In women, urinary phthalate metabolite levels have been correlated with pregnancy loss and preterm birth [19, 20]. In addition, phthalates are endocrine-disrupting chemicals that have been shown to target the ovary [17, 21–26]. This is important because follicles in ovaries are an important source of sex steroid hormones and because damage to follicles at various stages can lead to abnormal hormone levels, abnormal cyclicity, and subfertility/infertility [3, 4].
Reproductive toxicants, such as phthalates, can alter steroidogenesis by causing changes in gene expression in the steroidogenesis synthesis pathway in antral follicles. Previously, we have shown that di(2-ethylhexyl) phthalate (DEHP), a phthalate mixture containing diethyl phthalate (DEP), DEHP, dibutyl phthalate (DBP), diisobutyl phthalate (DiBP), diisononyl phthalate (DiNP), and butyl benzyl phthalate (BBzP), and individual metabolites such as mono(2-ethylhexyl) phthalate (MEHP) interfere with genes that regulate steroidogenesis. Specifically, a phthalate mixture led to decreased expression of most genes in the steroidogenesis pathway in mouse antral follicles in vitro. In addition, the metabolite MEHP caused greater decreases in ovarian gene expression in the pathway than its parent compound DEHP [12, 14].
Phthalates can also interfere with other key processes that affect ovarian follicles. Previously, we have shown that phthalate exposure regulates numerous genes that play a role in the promotion or inhibition of cell cycle progression regulated in antral follicles [14, 23]. Further, we have shown that phthalates can affect expression of genes involved in oxidative stress and atresia [14, 23]. In addition, phthalates can alter expression levels of receptors that bind phthalates such as peroxisome proliferator-activated receptor alpha (Ppara), peroxisome proliferator-activated receptor delta (Ppard), peroxisome proliferator-activated receptor gamma (Pparg), and aryl hydrocarbon receptor (Ahr). Phthalates also can alter expression levels of receptors that receive key hormonal signals can be affected by phthalates such as estrogen receptor alpha (Esr1), estrogen receptor beta (Esr2), androgen receptor (Ar), luteinizing hormone/choriogonadotropin receptor (Lhcgr), and follicle stimulating hormone receptor (Fshr).
Few phthalate mixture studies exist, but we have previously studied the effects of an environmentally relevant parent phthalate mixture on antral follicles [23]. In the current study, we examine the effects of the corresponding mixture of phthalate metabolites on ovarian antral follicles. This mixture contains the metabolites that would be the predominant forms of phthalates reaching the ovary after oral ingestion and first-pass metabolism. We proposed that the mixture of phthalate metabolites significantly affects ovarian follicle growth, affects expression of genes related to steroidogenesis, oxidative stress, cell cycle regulation, apoptosis, and receptors, and affects sex steroid hormone levels produced by ovarian follicles.
Methods
Chemicals
The mixture used in this study contained 36.7% monoethyl phthalate (MEP), 19.4% MEHP, 15.3% monobutyl phthalate (MBP), 10.2% monoisobutyl phthalate (MiBP), and 10.2% monoisononyl phthalate (MiNP), and 8.2% monobenzyl phthalate (MBzP) by weight. The proportions were based on sums of metabolites on a molar basis found in the urine of pregnant women [27]. MEP (Cat. No. M542580), MBP (Cat. No. M525100), MiBP (Cat. No. M547700), MiNP (Cat. No. B185500), and MBzP (Cat. No. M524900) were purchased from Toronto Research Chemicals (North York, ON, Canada). MEHP (Cat. No. ALR-138N) was purchased from AccuStandard (New Haven, CT). A concentrated stock of 435 mg/mL containing different proportions of the six phthalates previously listed was made by weighing individual phthalates and dissolving them in dimethyl sulfoxide (DMSO). The original stock was serial diluted with DMSO to create additional stocks of 0.087, 0.87, 8.7, and 87 mg/mL. These five stocks were each diluted in culture media at 0.75% resulting in media with final phthalate concentrations of 0.065, 0.65, 6.5, 65, and 325 μg/mL.
The concentrations of phthalates chosen for this study (0.065, 0.65, 6.5, 65, and 325 μg/mL) were similar to those in previous follicle culture studies of individual phthalates or a mixture of phthalates. The concentrations based on mass are smaller than those in a study of a parent phthalate mixture previously used by our laboratory [23], but due to the smaller molecular weights of the monoester, the molar concentrations are similar to those used in that study with the parent mixture. In that study, significant changes in gene expression and steroid synthesis were observed at 6.5 μg/mL and higher. Reports of urinary concentrations of individual phthalates in healthy individuals indicate that they are in the 0.1–0.4 μg/mL range, which is comparable to the low end of the range of concentrations used in this study [28]. In addition, reports indicate that plasma concentrations of individual phthalates in the 10–30 μg/mL range are in people that have had medical procedures [5, 6], which is comparable to the middle of the range of concentrations used in this study. Concentrations of 65 and 325 μg/mL are above the reported range in humans, but on a molar basis, they are similar to or lower than the highest levels of parent phthalates used in previous studies in our laboratory [23, 29].
Animals
CD-1 female mice were obtained from Charles River Laboratories (Wilmington, MA) or generated from mice obtained from the same source. The mice were housed at the College of Veterinary Medicine Animal Facility at the University of Illinois at Urbana-Champaign and were allowed to acclimate to the facility if animals were shipped. Animals were subjected to 12-hour light-dark cycles and a temperature range of at 22 ± 1°C was maintained. Water and food (Harlan Teklad 8604) were provided for ad libitum consumption. The Institutional Animal Use and Care Committee at the University of Illinois at Urbana-Champaign approved of and provided oversight for all aspects of animal acquisition, animal care, euthanasia, and tissue collection.
Antral Follicle Culture
Cycling CD-1 female mice aged 32–42 days were euthanized and their ovaries were aseptically removed and placed in unsupplemented α-minimal essential media (α-MEM, Life Technologies, Grand Island, NY) pre-warmed to 37°C. Antral follicles (250–420 μm) were isolated and cleaned of interstitial tissue using watchmaker’s forceps [30, 31]. At least 2–5 mice were used to obtain 60–80 follicles for each culture. A total of 10–12 follicles per treatment per culture were randomly distributed to individual wells containing supplemented treatment media. To avoid cross-contamination due to chemical volatility, a separate 96-well plate (Costar 3596, Corning Incorporated, Corning, NY) was used for each treatment group.
Treatment groups for the cultures included DMSO (vehicle control) and the phthalate mixtures (0.065, 0.65, 6.5, 65, and 325 μg/mL) were prepared in supplemented α-MEM. Media were supplemented with the following (7.6% total, by volume): 1x ITS (10 μg/mL insulin, 5.5 μg/mL transferrin, 5 ng/mL sodium selenite, Sigma-Aldrich, St. Louis, MO), 1x penicillin-streptomycin (100 U/mL penicillin, 100 μg/mL streptomycin, Sigma-Aldrich), 5% fetal bovine serum (FBS, Atlanta Biologicals, Lawrenceville, GA), and 5 IU/mL follicle-stimulating hormone (FSH, Dr. A.F. Parlow, National Hormone and Peptide Program, Harbor-UCLA Medical Center, Torrance, CA). DMSO vehicle or concentrated phthalate mix stocks were diluted to 0.075% by volume in supplemented media. Follicles were cultured for 24–96 hours in 150 μL media in an incubator at 37°C with 5% CO2 and controlled humidity. At 24 hours or 96 hours, follicles and follicle media were pooled separately for each treatment group, snap-frozen, and stored at −80°C until further analysis of gene expression and hormone levels.
Analysis of Antral Follicle Growth
Follicle diameters were measured at time 0 and every 24 hours for 96 hours on two perpendicular axes and then averaged. Measurements were acquired on an inverted microscope equipped with a calibrated ocular micrometer. Sizes of 8–12 individual follicles for each time point/treatment combination were averaged and then compared to the average size at time 0 hours for the same culture, which was defined as 100%. Finally, percentage data from individual experiments were averaged and analyzed (n=3–7 separate cultures).
Antral Follicle Culture Hormone Measurements
Media were collected after 24 or 96 hours of follicle culture and then subjected to enzyme-linked immunosorbent assays (ELISAs, DRG International Inc., Springfield, New Jersey) for pregnenolone, dehydroepiandrosterone (DHEA), progesterone, androstenedione, testosterone, and 17β-estradiol. The lower limit of detection for each assay was 0.05 ng/mL for pregnenolone, 0.07 ng/mL for DHEA, 0.045 ng/mL for progesterone, 0.021 ng/mL for androstenedione, 0.083 ng/mL for testosterone, and 9.7 ng/mL for 17β-estradiol. The assays were performed according to the manufacturer’s protocol. Standard curves for each assay were created using provided standards and standard curves were created using four-parameter logistic curve fitting. A mean value of duplicate runs was calculated for all samples. Sample dilution was done with steroid free serum (DRG International Inc.), if needed, for measurements to be in the range of the standard curve.
Gene Expression Analysis
Total RNA was isolated from snap-frozen antral follicles (8–12 per pooled sample) using an RNeasy Micro Kit (Qiagen, Inc., Valencia, CA) according to the manufacturer’s instructions. RNA was eluted in RNase-free water and the concentration was determined using a NanoDrop (λ=260 nm, Nanodrop Technologies, Inc., Wilmington, DE). RNA (100 ng) was reverse-transcribed to complementary DNA (cDNA) using iScript Reverse Transcriptase (Bio-Rad Laboratories, Inc., Hercules, CA) according to the manufacturer’s protocol. Quantitative polymerase chain reaction (qPCR) analysis was done in 96-well plates in 10 μL reaction volumes containing 0.75 pmol/μL for each of two primers, cDNA derived from 1.67 ng total RNA, and 1x SsoFastEvaGreen dye (Bio-Rad Laboratories). Quantifications were done using the CFX96 Real-Time Detection System (Bio-Rad Laboratories) and CFX Manager Software. All qPCR primers (Integrated DNA Technologies, Coralville, IA) were purchased lyophilized and dissolved in DNase free water and are listed in Table 1. A mean value of duplicate runs was calculated for all samples. Reactions were performed for Ahr, aryl hydrocarbon receptor repressor (Ahrr), Aifm1, androgen receptor (Ar), aryl hydrocarbon receptor nuclear translocator (Arnt), BCL2-associated X protein (Bax), B cell leukemia/lymphoma 2 (Bcl2), Bcl2-like 10 (Bcl2l10), BCL2-related ovarian killer (Bok), constitutive androstane receptor (Car), caspase 3 (Casp3), caspase 8 (Casp8), catalase (Cat), cyclin A2 (Ccna2), cyclin B1 (Ccnb1), cyclin B2 (Ccnb2), cyclin D2 (Ccnd2), cyclin D3 (Ccnd3), cyclin E1 (Ccne1), cyclin-dependent kinase 2 (Cdk2), cyclin-dependent kinase 4 (Cdk4), cyclin-dependent kinase 6 (Cdk6), cyclin-dependent kinase inhibitor 1A (Cdkn1a), cyclin-dependent kinase inhibitor 1B (Cdkn1b), cyclin-dependent kinase inhibitor 1C (Cdkn1c), cyclin-dependent kinase inhibitor 2A (Cdkn2a), cyclin-dependent kinase inhibitor 2B (Cdkn2b), cyclin-dependent kinase inhibitor 2C (Cdkn2c), cyclin-dependent kinase inhibitor 2D (Cdkn2d), cytochrome P450 11A1 (Cyp11a1), cytochrome P450 17A1 (Cyp17a1), cytochrome P450 19A1 (Cyp19a1), cytochrome P450 1A1 (Cyp1a1), cytochrome P450 1B1 (Cyp1b1), Esr1, Esr2, Fshr, glutathione peroxidase 1 (Gpx1), glutathione reductase (Gsr), 17-beta-hydroxysteroid dehydrogenase (Hsd17b1), 3-beta-hydroxysteroid dehydrogenase (Hsd3b1), Lhcgr, antigen identified by monoclonal antibody Ki67 (Ki67), Ppara, Ppard, Pparg, S-phase kinase associated protein 2 (Skp2), superoxide dismutase 1 (Sod1), and steroidogenic acute regulatory protein (Star). The qPCR protocol began with incubation at 95°C for 5 minutes. This was followed by 36 cycles at 95°C for 10 seconds, at 60°C for 10 seconds, and at 72°C for 10 seconds. Melting from 65°C to 95°C was followed by extension at 72°C for 2 minutes. Melting temperature graphs, standard curves, and threshold cycle (Ct) values were acquired for each gene analyzed. The expression data were normalized to the corresponding values for 18S ribosomal RNA (Rn18s). Individual relative fold changes were calculated by the Pfaffl method [32], then fold changes for each treatment were calculated compared to the control for the corresponding culture.
Table 1.
The listed sequences of DNA oligonucleotide primers were used for qPCR gene expression assays.
| Gene symbol | Gene name | Forward primer (5’→3’) | Reverse primer (5’→3’) |
|---|---|---|---|
| Ahr | aryl hydrocarbon receptor | TTCTTAGGCTCAGCGTCAGCTA | GCAAATCCTGCCAGTCTCTGAT |
| Ahr | aryl hydrocarbon receptor repressor | AGAGCTGTGTCCCCAGGGAAGT | AGCTGCCCACGCTCCACATT |
| Aifm1 | apoptosis-inducing factor, mitochondrion-associated 1 | AGGACGGTGAGCAACATGAA | GTTCTATCCACCCATCCCGC |
| Ar | androgen receptor | GGCGGTCCTTCACTAATGTCAACT | GAGACTTGTGCATGCGGTACTCAT |
| Arnt | aryl hydrocarbon receptor nucleartranslocator | GATGCGATGATGACCAGATGTG | CAGTGAGGAAAGATGGCTTGTAGG |
| Bax | BCL2-associated X protein | TGAAGACAGGGGCCTTTTTG | AATTCGCCGGAGACACTCG |
| Bcl2 | B cell leukemia/lymphoma 2 | ATGCCTTTGTGGAACTATATGGC | GGTATGCACCCAGAGTGATGC |
| Bcl2l10 | Bel 2-like 10 | CGCTACACACACTGACTGGA | CTTTAGGATCCCCTGCCCTG |
| Bok | BCL2-related ovarian killer | CTGCCCCTGGAGGACGCTTG | CCGTCACCACAGGCTCCGAC |
| Car | constitutive androstane receptor | GTCAGCAAGGCCCAGAGAC | AAGATGCTTTCTCTGCCCGC |
| Casp3 | caspase 3 | TGGTGATGAAGGGGTCATTTATG | TTCGGCTTTCCAGTCAGACTC |
| Casp8 | caspase 8 | CGAGAGGAGATGGTGAGAGAGC | CAGGCTCAAGTCATCTTCCAGC |
| Cat | Catalase | GCAGATACCTGTGAACTGTC | GTAGAATGTCCGCACCTGAG |
| Ccna2 | cyclin A2 | GCTCTACTGCCCGGAGGCTGA | TGGCCTACATGTCCTCTGGGGAA |
| Ccnb1 | cyclin B1 | TGCATTCTCTCAGTGCCCTCCACA | AGACAGGAGTGGCGCCTTGGT |
| Ccnb2 | cyclin B2 | CTATCCGGCGGGCAGTTTTA | GGCAGAGCTGGTACTTTGGT |
| Ccnd2 | cyclin D2 | CCTTTGACGCAGGCTCCCTTCT | ACCCTGGTGCACGCATGCAAA |
| Ccnd3 | cyclin D3 | AAAGGAGATCAAGCCGCACA | AGCCAGAGGGAAGACATCCT |
| Ccne1 | cyclin E1 | GGTGTCCTCGCTGCTTCTGCTT | CCGGATAACCATGGCGAACGGA |
| Cdk2 | cyclin-dependent kinase 2 | GTGGTACCGAGCACCTGAAA | CGGGTCACCATTTCAGCAAA |
| Cdk4 | cyclin-dependent kinase 4 | AGAAACCCTCGCTGAAGCGGCA | TGGGGGTGAACCTCGTAAGGAGA |
| Cdk6 | cyclin-dependent kinase 6 | ACGTGGTCAGGTTGTTTGATG | CGGGCTCTGGAACTTTATCC |
| Cdkn1a | cyclin-dependent kinase inhibitor 1A | TTAGGCAGCTCCAGTGGCAACC | ACCCCCACCACCACACACCATA |
| Cdkn1b | cyclin-dependent kinase inhibitor 1B | GTTTCAGACGGTTCCCCGAA | TTCTTAATTCGGAGCTGTTTACGTC |
| Cdkn1c | cyclin-dependent kinase inhibitor 1C | CTGGACAGGACAAGCGATCC | GCTGTTCTGCTGCGGAGGTA |
| Cdkn2a | cyclin dependent kinase inhibitor 2A | GCTCTGGCTTTCGTGAACAT | CGAATCTGCACCGTAGTTGA |
| Cdkn2b | cycl in dependent kinase inhibitor 2B | CAGATCCCAACGCCCTGAAC | GTCGTGCACAGGTCTGGTAA |
| Cdkn2c | cyclin dependent kinase inhibitor 2C | AACGTCAACGCTCAAAATGGA | GGAGAAGCCTCCTGGCAATC |
| Cdkn2d | cyclin dependent kinase inhibitor 2D | CTGAACCGCTTTGGCAAGAC | ATCTTGGACATTGGGGCTGG |
| Cyp11a1 | cytochrome P450, family 11, subfamily a, polypeptide 1 | AGATCCCTTCCCCTGGTGACAATG | CGCATGAGAAGAGTATCGACGCATC |
| Cypl7a1 | cytochrome P450, family 17, subfamily a, polypeptide 1 | CCAGGACCCAAGTGTGTTCT | CCTGATACGAAGCACTTCTCG |
| Cypl9a1 | cytochrome P450, family 19, subfamily a, polypeptide 1 | CATGGTCCCGGAAACTGTGA | GTAGTAGTTGCAGGCACTTC |
| Cyp1a1 | cytochrome P450, family 1, subfamily a, polypeptide 1 | TGTCAGATGATAAGGTCATCACG | TCTCCAGAATGAAGGCCTCCAG |
| Cyp1b1 | cytochrome P450, family 1, subfamily b, polypeptide 1 | GCGACGATTCCTCCGGGCTG | TGCACGCGGGCCTGAACATC |
| Esr1 | estrogen receptor alpha | AATTCTGACAATCGACGCCAG | GTGCTTCAACATTCTCCCTCCTC |
| Esr2 | estrogen receptor beta | GGAATCTCTTCCCAGCAGCA | GGGACCACATTTTTGCACTT |
| Fshr | follicle stimulating hormone receptor | AGCAAGTTTGGCTGTTATGAGG | GTTCTGGACTGAATGATTTAGAGG |
| Gpx1 | glutathione peroxidase 1 | CCTCAAGTACGTCCGACCTG | CAATGTCGTTGCGGCACACC |
| Gsr | glutathione reductase | CAGTTGGCATGTCATCAAGCA | CGAATGTTGCATAGCCGTGG |
| Hsdl7b1 | 17-beta-hydroxysteroid dehydrogenase 1 | AAGCGGTTCGTGGAGAAGTAG | ACTGTGCCAGCAAGTTTGCG |
| Hsd3b1 | 3-beta-hydroxysteroid dehydrogenase 1 | CAGGAGAAAGAACTGCAGGAGGTC | GCACACTTGCTTGAACACAGGC |
| Lhcgr | luteinizinghormone/choriogonadotropin receptor | AACCCGGTGCTTTTTACAAACC | TCCCATTGAATGCATGGCTT |
| Ki67 | antigen identified by monoclonal antibody Ki 67 | GCTCACCTGGTCACCATCAA | ACTACAGGCAGCTGGATACG |
| Ppara | Peroxisome proliferator activated receptor alpha | TGAACAAAGACGGGATG | TCAAACTTGGGTTCCATGAT |
| Ppard | Peroxisome proliferator activator receptor delta | ATGGGACTCACTCAGAGGCT | TGGCTGTTCCATGACTGACC |
| Pparg | peroxisome proliferator activated receptor gamma | TGTGAGACCAACAGCCTGACGG | GTCCTGAATATCAGTGGTTCACCGC |
| Rn18s | 18S ribosomal RNA | TCGGCGTCCCCCAACTTCTTA | GGTAGTAGCGACGGGCGGTGT |
| Skp2 | S-phase kinase-associated protein 2 | GCCCTCGGTCCTTTATGGAG | ATTCTGCAGCTTGGAGCACT |
| Sod1 | superoxide dismutase 1 | TTCCGTCCGTCGGCTTCTCGT | CGCACACCGCTTTCATCGCC |
| Star | steroidogenic acute regulatory protein | CAGGGAGAGGTGGCTATGCA | CCGTGTCTTTTCCAATCCTCTG |
Statistical Analysis
All data were analyzed using SPSS Statistics software (SPSS Inc., Chicago, IL). Data were expressed as means ± standard error of the means (SEM) for 3–7 separate experiments in each treatment group. Multiple comparisons between normally distributed experimental groups were made using one-way analysis of variance (ANOVA) followed by Dunnett post hoc comparisons, if equal variances were assumed, or Games-Howell post hoc comparisons if equal variances were not assumed. If data were not normally distributed, comparisons between experimental and control groups were done using Mann-Whitney U tests. Statistical significance (*) was assigned for p ≤ 0.05. Borderline significance (^) was assigned for 0.05 < p ≤ 0.10.
Results
Effects of the Metabolite Mixture on Antral Follicle Growth
To assess the effects of the phthalate metabolite mixture on the growth of antral follicles, the diameters of individually cultured antral follicles were monitored for 96 hours. Averages at each time point were determined for vehicle control (DMSO) and at five doses of the metabolite mixture (0.065–325 μg/mL) as shown in Fig. 1 (n=3–7 cultures). Percentage growth of the vehicle control over 96 hours was similar to previous reports using the same culture system [17, 23]. The phthalate metabolite mixture for the three lowest doses (0.065, 0.65, and 6.5 μg/mL) did not significantly affect the follicle growth relative to control at any time point. The 65 μg/mL dose significantly inhibited follicle growth only at the 96-hour time point compared to control (n=4, p ≤ 0.05). The 325 μg/mL dose led to a borderline decrease in growth at 48 hours and a significant decrease in growth at both 72 and 96 hours compared to control (n=3, p ≤ 0.05).
Figure 1.
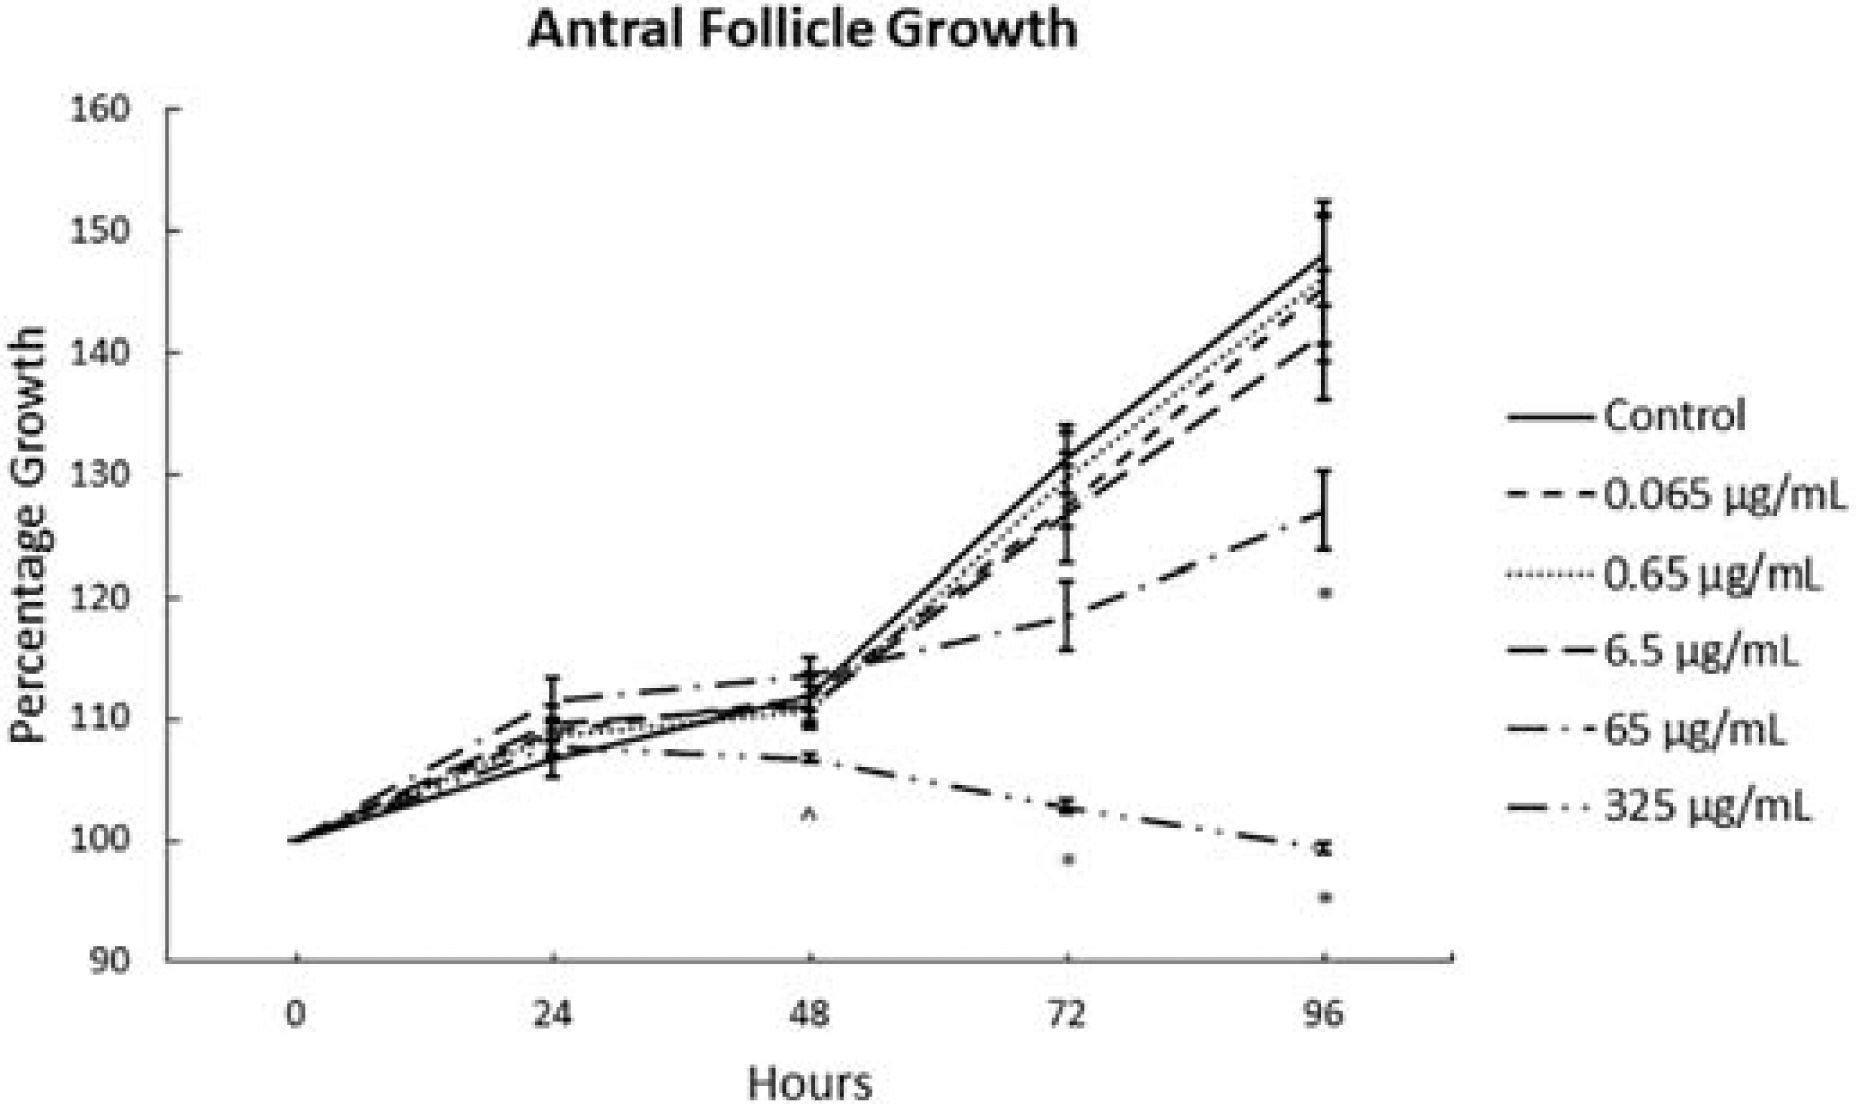
Effects of the monophthalate mixture on antral follicle growth. Mouse antral follicles were treated with vehicle control (DMSO) or the monophthalate mixture (0.065–325 μg/mL) for 96 hours. Follicle growth relative to initial size (100%) was measured every 24 hours. The graph indicates means ± SEMs from 3–7 separate cultures (8–12 follicles/treatment/culture). * p ≤ 0.05; ^ 0.05 < p ≤ 0.10
Effects of the Metabolite Mixture on Sex Steroid Hormone Levels
The effects of the phthalate metabolite mixture on the levels of sex steroid hormones were assessed at both 24 and 96 hours (Fig. 2, n=3–7). For each hormone, the amount detected for the control sample was higher at 96 hours than at 24 hours. The phthalate mixture at 24 hours (65 and 325 μg/mL) caused levels of pregnenolone to be higher compared to control (p ≤ 0.05). The phthalate mixture at 24 hours (65 and 325 μg/mL) and at 96 hours (6.5, 65, and 325 μg/mL) caused progesterone levels to be significantly higher compared to control (p ≤ 0.05). The phthalate mixture at 96 hours (65 μg/mL) caused DHEA levels to be significantly higher than control (p ≤ 0.05). The phthalate mixture at 24 hours (65 and 325 μg/mL) and at 96 hours (65 and 325 μg/mL) caused androstenedione levels to be significantly higher compared to control (p ≤ 0.05). The phthalate mixture at 24 hours (6.5, 65, and 325 μg/mL) and at 96 hours (65 and 325 μg/mL) caused testosterone levels to be significantly higher compared to control (p ≤ 0.05). The phthalate mixture at 24 hours (6.5 and 65 μg/mL) caused estradiol levels to be significantly higher compared to control, and the mixture at 96 hours (325 μg/mL) caused estradiol levels to be significantly lower compared to control (p ≤ 0.05).
Figure 2.
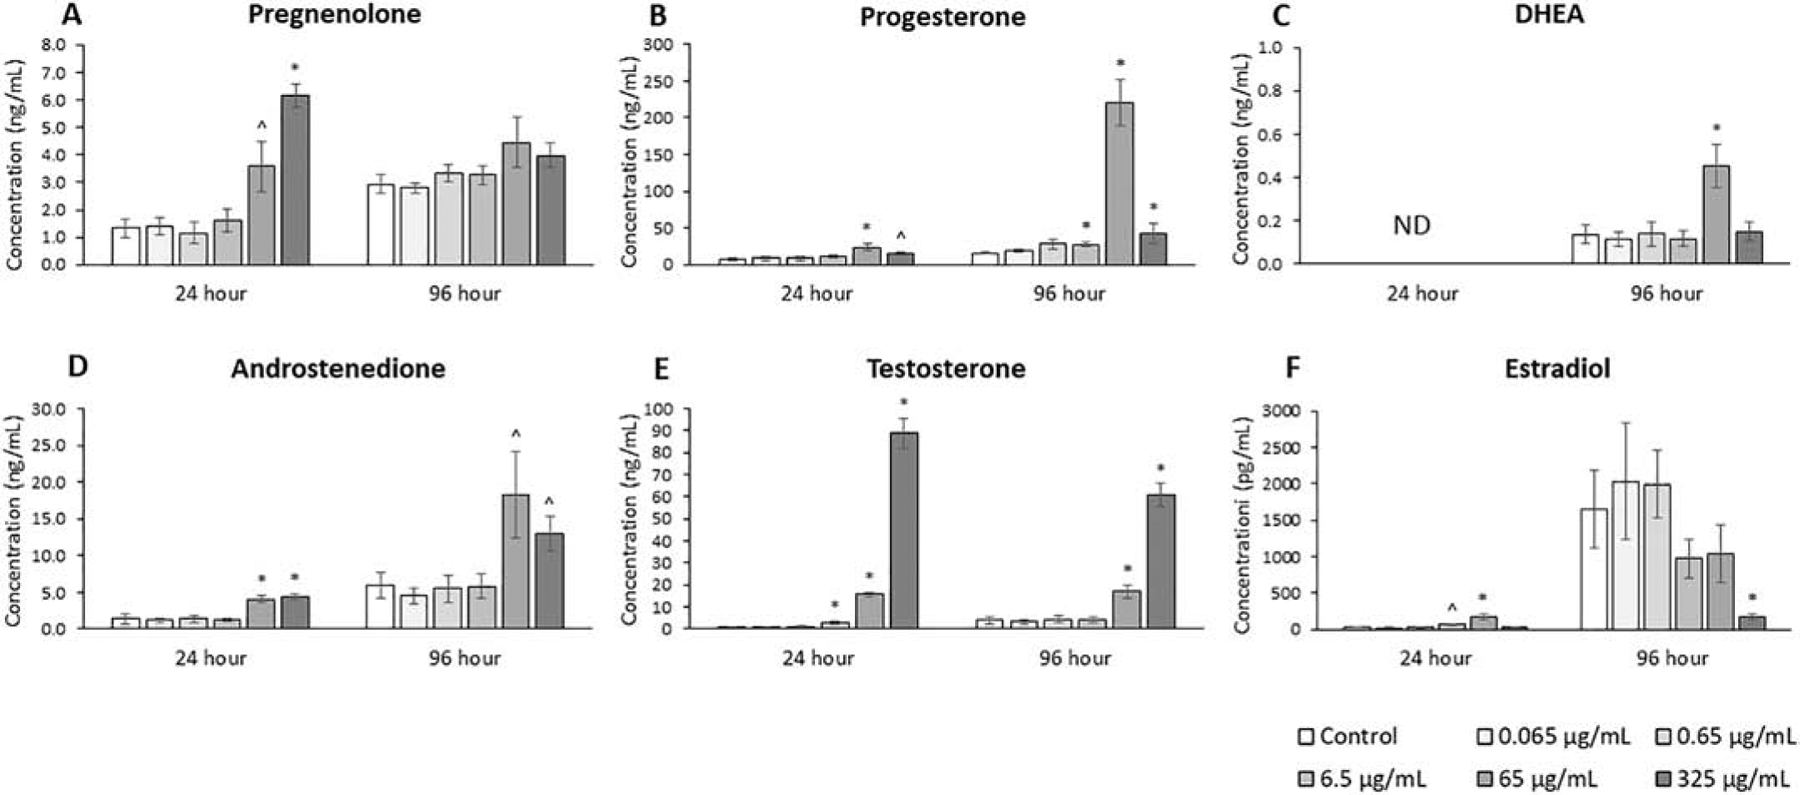
Effects of the monophthalate mixture on the sex steroid hormone levels from antral follicles. Mouse antral follicles were treated with vehicle control (DMSO) or the monophthalate mixture (0.065–325 μg/mL) for 96 hours. At 24 and 96 hours, media for each treatment-culture were pooled and subjected to ELISAs for pregnenolone (A), progesterone (B), DHEA (C), androstenedione (D), testosterone (E), and estradiol (F). The graphs indicate means ± SEMs from 3–7 separate cultures (8–12 follicles/treatment/culture). * p ≤ 0.05; ^ 0.05 < p ≤ 0.10
Effects of the Metabolite Mixture on Steroid Pathway Gene Expression
The expression of genes key to the steroid synthesis and degradation pathway was analyzed because of the relationship of steroidogenic enzymes to hormone levels (Fig. 3, n=3–7). The phthalate mixture at 24 and 96 hours (65 and 325 μg/mL) increased Star expression 2–3 fold compared to control (p ≤ 0.05). The phthalate mixture at 24 and 96 hours (325 μg/mL) decreased Cyp11a1 expression 3–10 fold compared to control (p ≤ 0.05). The phthalate mixture (0.65 and 6.5 μg/mL) decreased Hsd3b1, Cyp17a1, and Cyp19a1 expression as much as 30% at 24 hours and as much as 3-fold at 96 hours compared to control (p ≤ 0.05). The phthalate mixture (65 μg/mL) decreased Hsd3b1, Cyp17a1, Hsd17b1, and Cyp19a1 expression as much as 2-fold at 24 hours and as much as 20-fold at 96 hours compared to control (p ≤ 0.05). The phthalate mixture at 24 hours and 96 hours (325 μg/mL) decreased Hsd3b1, Cyp17a1, Hsd17b1, and Cyp19a1 expression from 10- to over 100-fold compared to control (p ≤ 0.05). The phthalate mixture at 24 hours and 96 hours (325 μg/mL) increased Cyp1a1 expression from 3-to 10-fold compared to control (p ≤ 0.05). The phthalate mixture at 24 hours (325 μg/mL) decreased Cyp1b1 expression 7-fold and at 96 hours (65 and 325 μg/mL) decreased Cyp1b1 expression from 30% to 3-fold compared to control (p ≤ 0.05).
Figure 3.
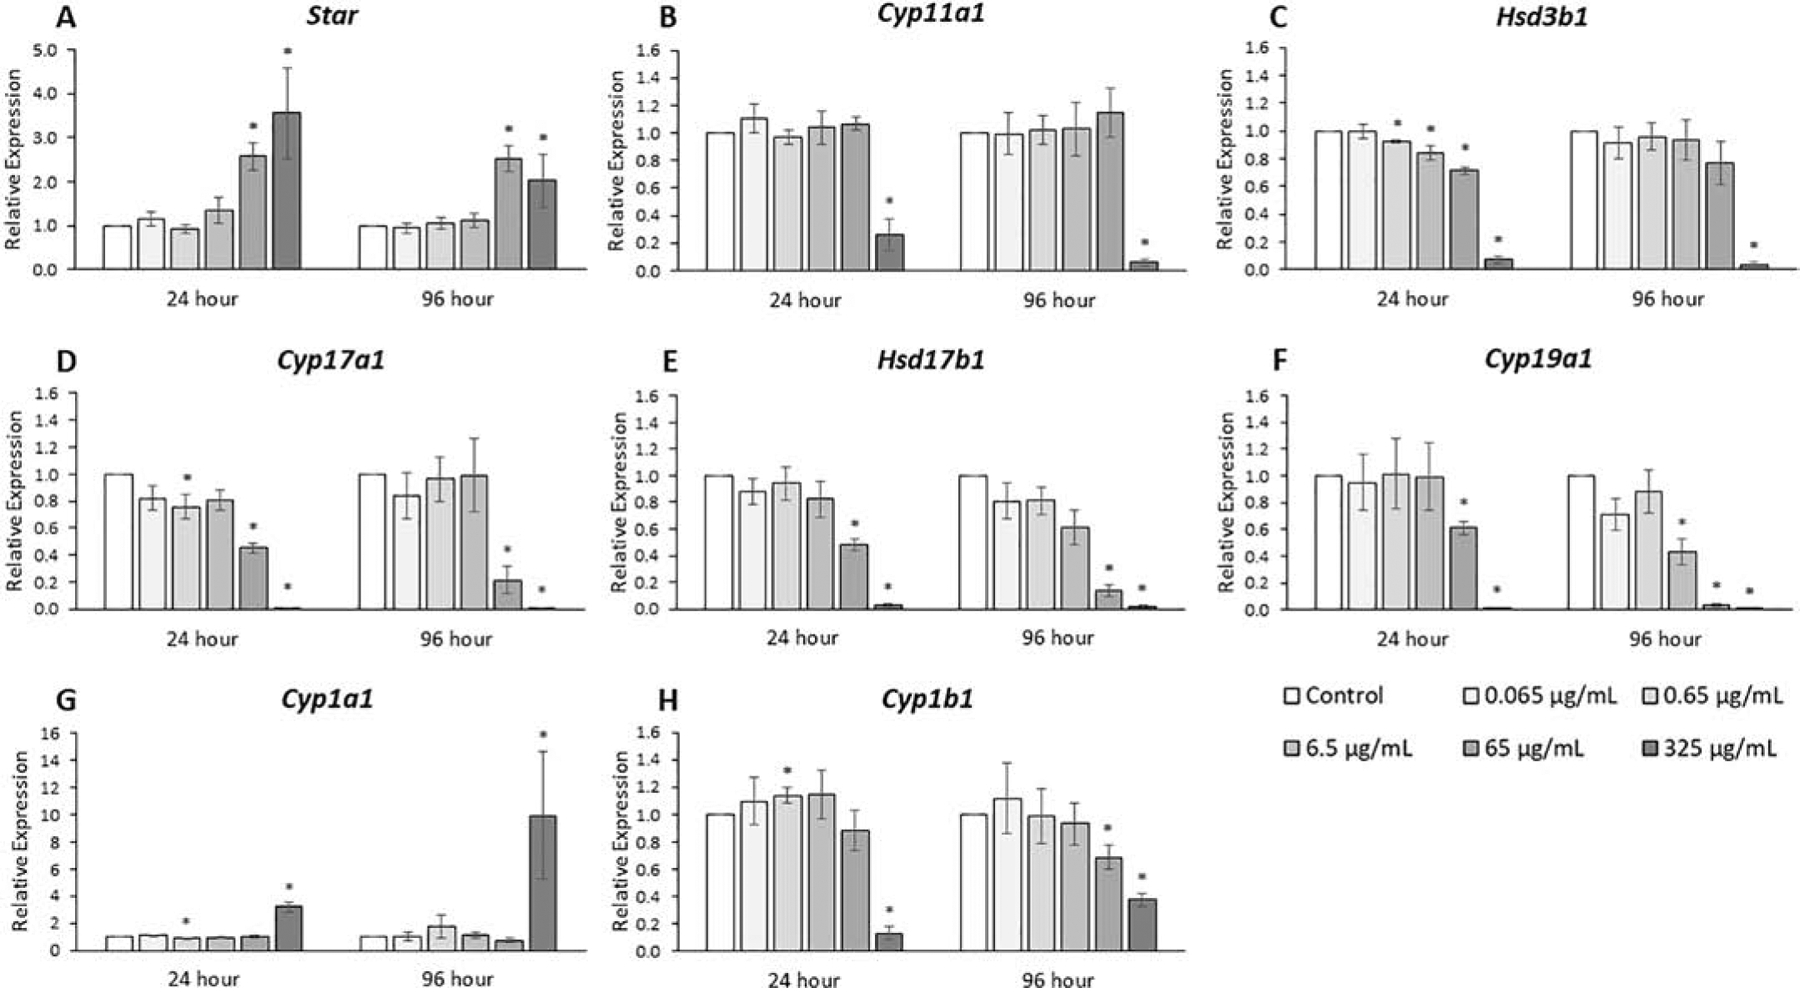
Effects of the monophthalate mixture on the sex steroid pathway gene expression levels from antral follicles. Mouse antral follicles were treated with vehicle control (DMSO) or the monophthalate mixture (0.065–325 μg/mL) for 96 hours. At 24 and 96 hours, cDNA samples derived from follicles were subjected to qPCR for Star (A), Cyp11a1 (B), Hsd3b1 (C), Cyp17a1 (D), Hsd17b1 (E), Cyp19a1 (F), Cyp1a1 (G), and Cyp1b1 (H). The graphs indicate means ± SEMs from 3–7 separate cultures (8–12 follicles/treatment/culture). * p ≤ 0.05; ^ 0.05 < p ≤ 0.10
Effects of the Metabolite Mixture on Cell Cycle Regulator Gene Expression
The expression levels of cyclins (CCNs) that promote progression through the cell cycle were analyzed because of their importance to the antral follicle, which has active cell division (Fig. 4, n=3–7). Overall, the metabolite mixture decreased the expression of these genes compared to control (Fig. 4, n=3–7, p ≤ 0.05). The phthalate mixture at 96 hours (0.065, 0.65, and 6.5 μg/mL) caused Ccna2, Ccnb1, and Ccnb2 expression to significantly decrease up to 40% and it (65 μg/mL) caused Ccna2, Ccnb1, and Ccnb2, and Ccne1 expression to decrease from 2- to 6-fold compared to control (p ≤ 0.05). The phthalate mixture at 24 hours (325 μg/mL) decreased the expression of Ccna2, Ccnb2, and Ccnd3 from 3- to 6-fold and at 96 hours (325 μg/mL), the mixture decreased the expression of Ccna2, Ccnb1, Ccnb2, and Ccnd3 and Ccne1 from 2- to 20-fold compared to control (p ≤ 0.05).
Figure 4.
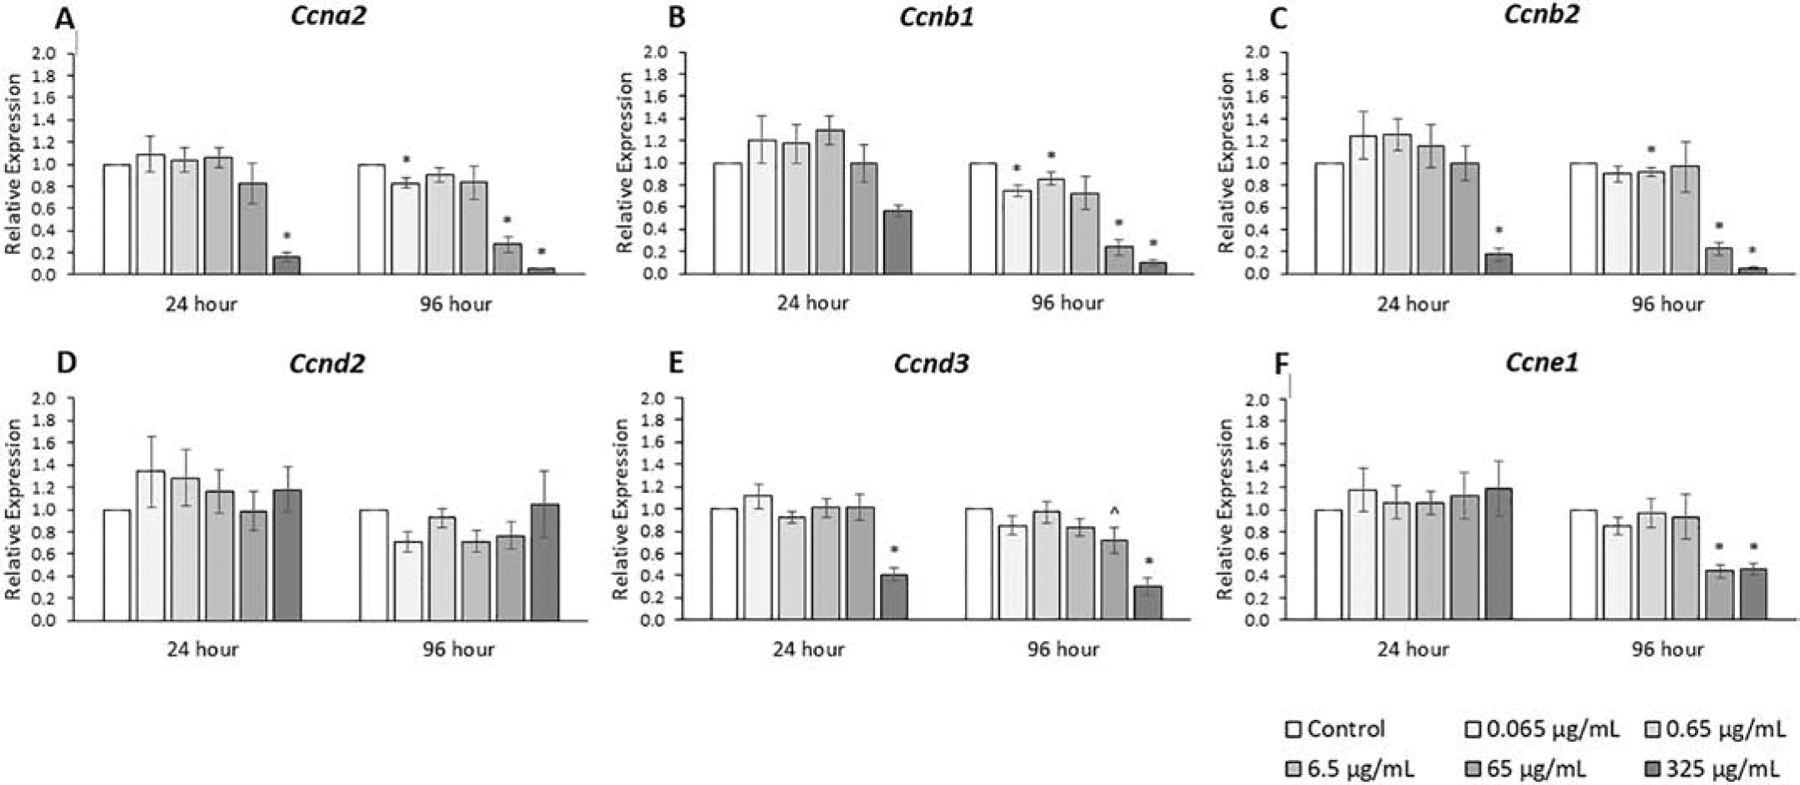
Effects of the monophthalate mixture on expression levels of cell cycle regulator genes (CCN family) from antral follicles. Mouse antral follicles were treated with vehicle control (DMSO) or the monophthalate mixture (0.065–325 μg/mL) for 96 hours. At 24 and 96 hours, cDNA samples derived from follicles were subjected to qPCR for Ccna2 (A), Ccnb1 (B), Ccnb2 (C), Ccnd2 (D), Ccnd3 (E), and Ccne1 (F). The graphs indicate means ± SEMs from 3–7 separate cultures (8–12 follicles/treatment/culture). * p ≤ 0.05; ^ 0.05 < p ≤ 0.10
The expression levels of cyclin-dependent kinases (CDKs), which also promote cell cycle progression (Fig. 5, n=3–7), and expression levels of Ki67, a cell proliferation marker, were compared among treatment groups (Fig. 5, n=3–7). The phthalate mixture at 24 hours (325 μg/mL) decreased the expression of Cdk2 and Cdk4 by 30% and at 96 hours (325 μg/mL) decreased the expression of Cdk2 by 3-fold compared to control (p ≤ 0.05). The phthalate mixture decreased the expression of the marker of cell proliferation, Ki67, at 24 hours (325 μg/mL) by 10-fold, and decreased expression at 96 hours by 30% (0.065 and 6.5 μg/mL), by 20-fold (65 μg/mL), and by 200-fold (325 μg/mL) compared to control (p ≤ 0.05).
Figure 5.
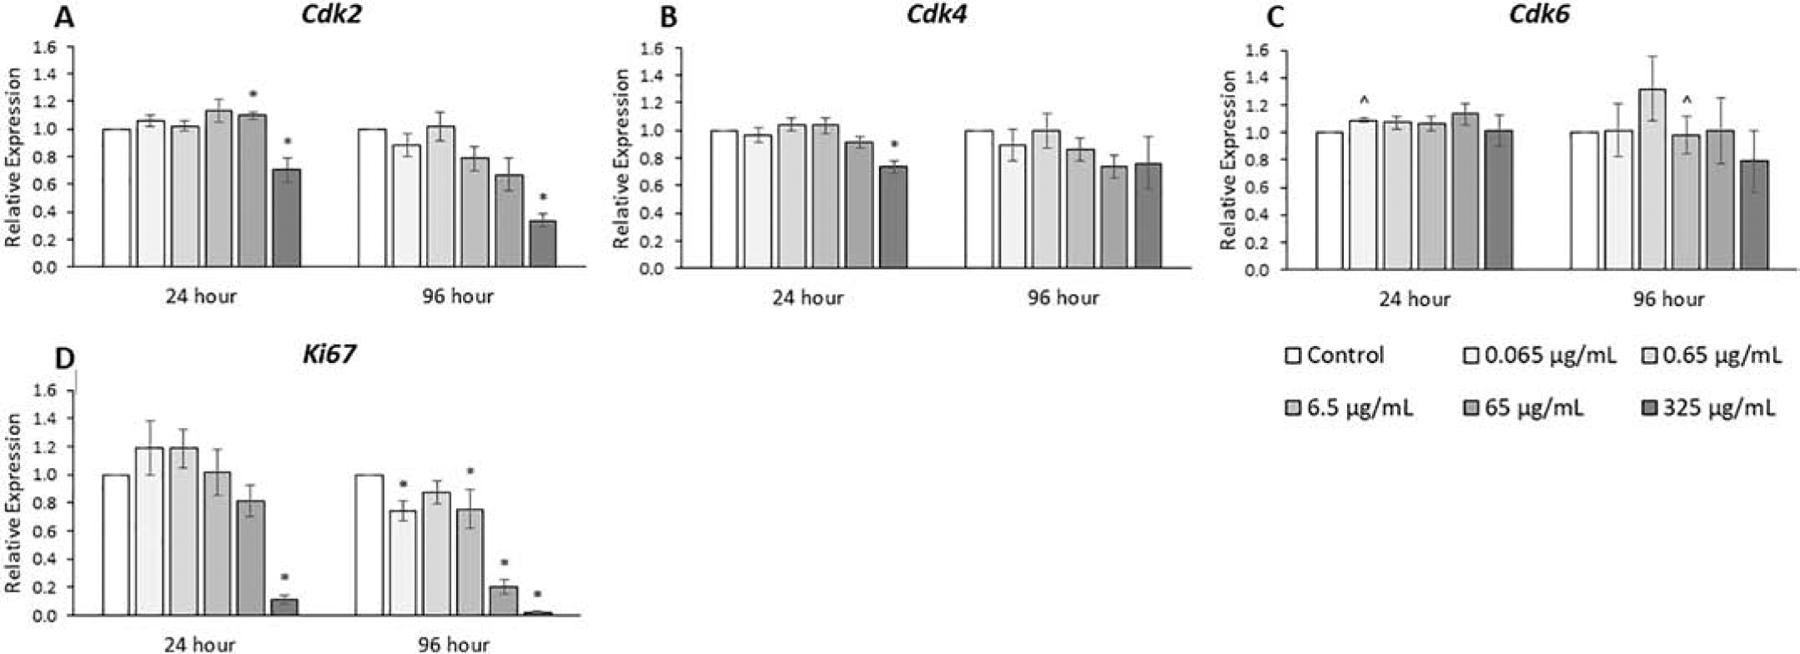
Effects of the monophthalate mixture on expression levels of cell cycle regulator genes (CDK family) and Ki67 from antral follicles. Mouse antral follicles were treated with vehicle control (DMSO) or the monophthalate mixture (0.065–325 μg/mL) for 96 hours. At 24 and 96 hours, cDNA samples derived from follicles were subjected to qPCR for Cdk2 (A), Cdk4 (B), Cdk6 (C), and Ki67 (D). The graphs indicate means ± SEMs from 3–7 separate cultures (8–12 follicles/treatment/culture). * p ≤ 0.05; ^ 0.05 < p ≤ 0.10
The expression of inhibitors of cyclin-dependent kinases (CDKIs), genes that inhibit progression through the cell cycle, and of Skp2, a CDKI regulator, were compared among treatment groups (Fig. 6, n=3–7). The phthalate mixture at 24 hours (65 μg/mL) increased Cdkn1a expression over 50%, and at 24 and 96 hours (325 μg/mL), it increased Cdkn1a expression 5- to 7-fold compared to control (p ≤ 0.05). The phthalate mixture at 24 and 96 hours (325 μg/mL) increased Cdkn2b expression 50% to 5-fold compared to control (p ≤ 0.05). The phthalate mixture at 24 and 96 hours (65 and 325 μg/mL) decreased Cdkn1b, Cdkn1c, Cdkn2c, and Cdkn2d expression as much as 5-fold compared to control. Time-dependent effects for Cdkn2a expression existed at higher concentrations because the phthalate mixture at 24 hours (325 μg/mL) increased expression 3-fold and at 96 hours (65 and 325 μg/mL) decreased expression 3-fold compared to control (p ≤ 0.05). Additionally, the phthalate mixture at 24 and 96 hours (65 and 325 μg/mL) decreased Skp2 expression as much as 3-fold compared to control.
Figure 6.
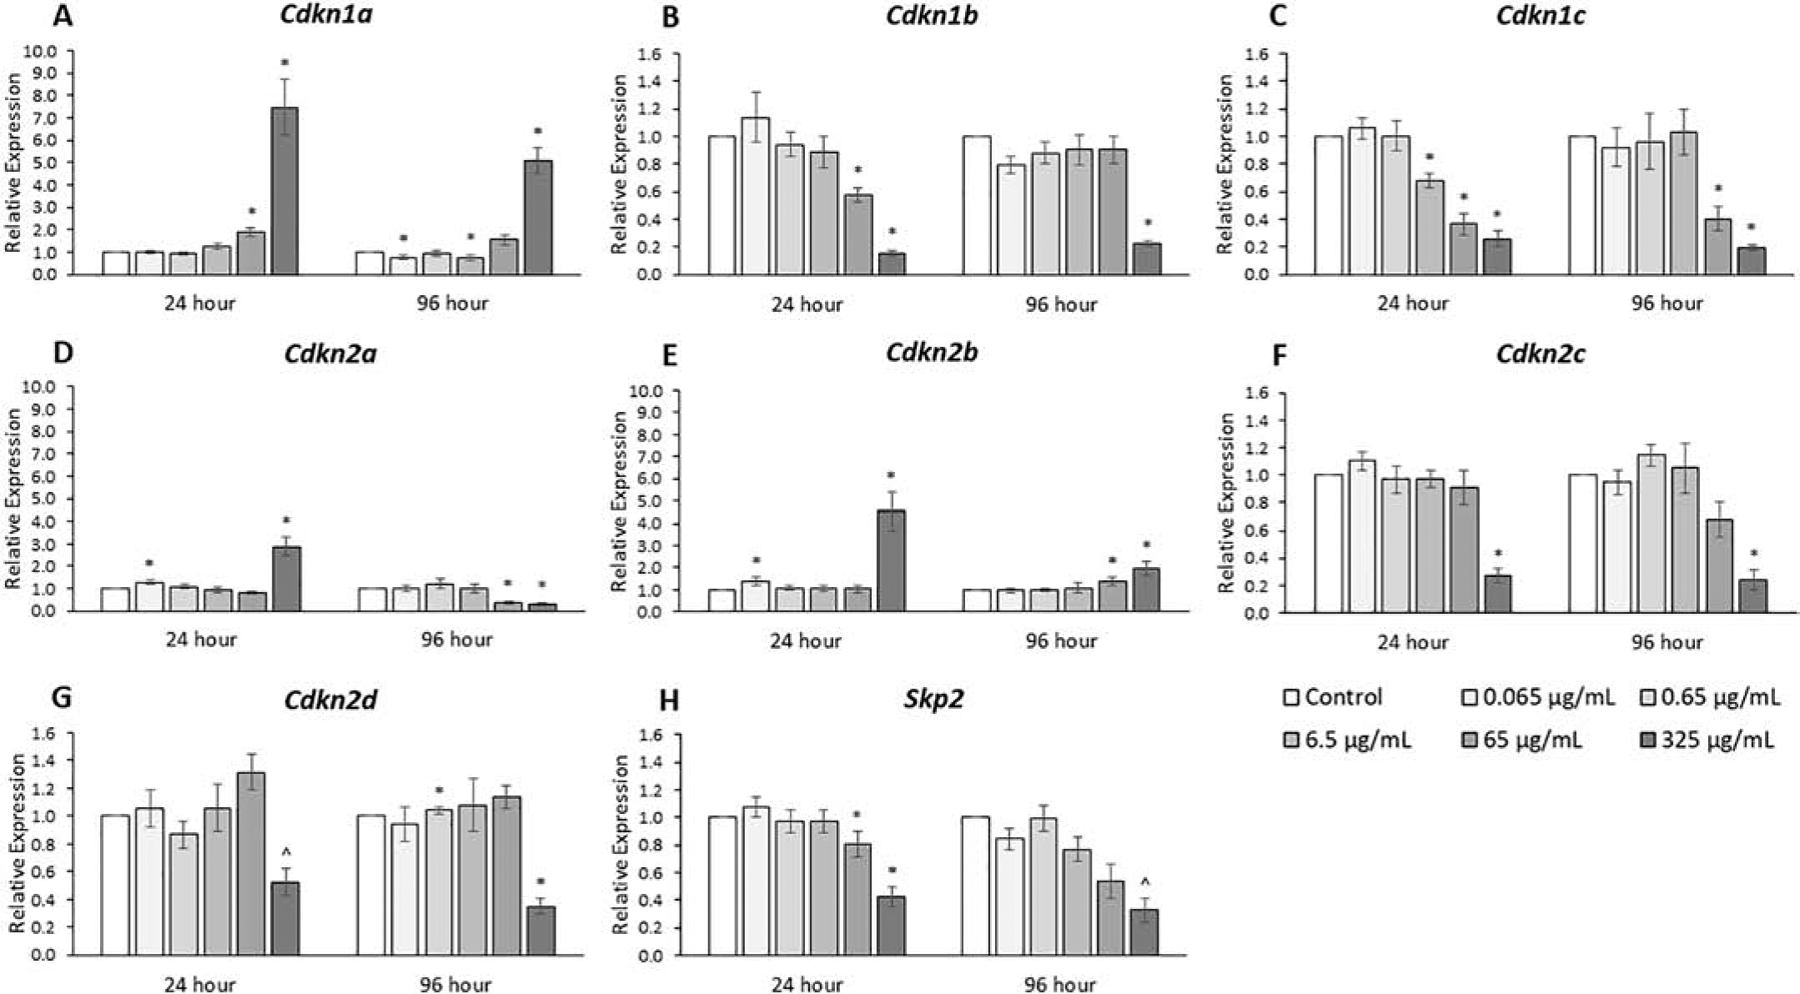
Effects of the monophthalate mixture on expression levels of cell cycle regulator genes (CDKI family) and Skp2 from antral follicles. Mouse antral follicles were treated with vehicle control (DMSO) or the monophthalate mixture (0.065–325 μg/mL) for 96 hours. At 24 and 96 hours, cDNA samples derived from follicles were subjected to qPCR for Cdkn1a (A), Cdkn1b (B), Cdkn1c (C), Cdkn2a (D), Cdkn2b (E), Cdkn2c (F), Cdkn2d (G), and Skp2 (H). The graphs indicate means ± SEMs from 3–7 separate cultures (8–12 follicles/treatment/culture). * p ≤ 0.05; ^ 0.05 < p ≤ 0.10
Effects of the Metabolite Mixture on Apoptotic Factor Gene Expression
The expression levels of genes that promote apoptosis were compared among treatment groups (Fig. 7, n=3–7). The phthalate mixture at 24 hours (0.065, 0.65, and 6.5 μg/mL) and 96 hours (0.065, 0.65, and 6.5 μg/mL) decreased Bok, and Casp8 expression as much as 20% compared to control (p ≤ 0.05). The phthalate mixture at 24 and 96 hours (65 and 325 μg/mL) decreased Bok, Casp3, and Casp8 expression from 20% to 3-fold compared to control (p ≤ 0.05). The phthalate mixture at 24 hours (65 μg/mL) and 96 hours (65 μg/mL) increased Aifm1 expression as much as 2-fold compared to control (p ≤ 0.05). The phthalate mixture at 24 hours (325 μg/mL) increased Bid expression 2-fold compared to control (p ≤ 0.05). At 96 hours (6.5 and 65 μg/mL), the phthalate mixture decreased Bax expression up to 20% and at 24 and 96 hours, the mixture (325 μg/mL) increased Bax expression 2- to 3-fold compared to control (p ≤ 0.05).
Figure 7.
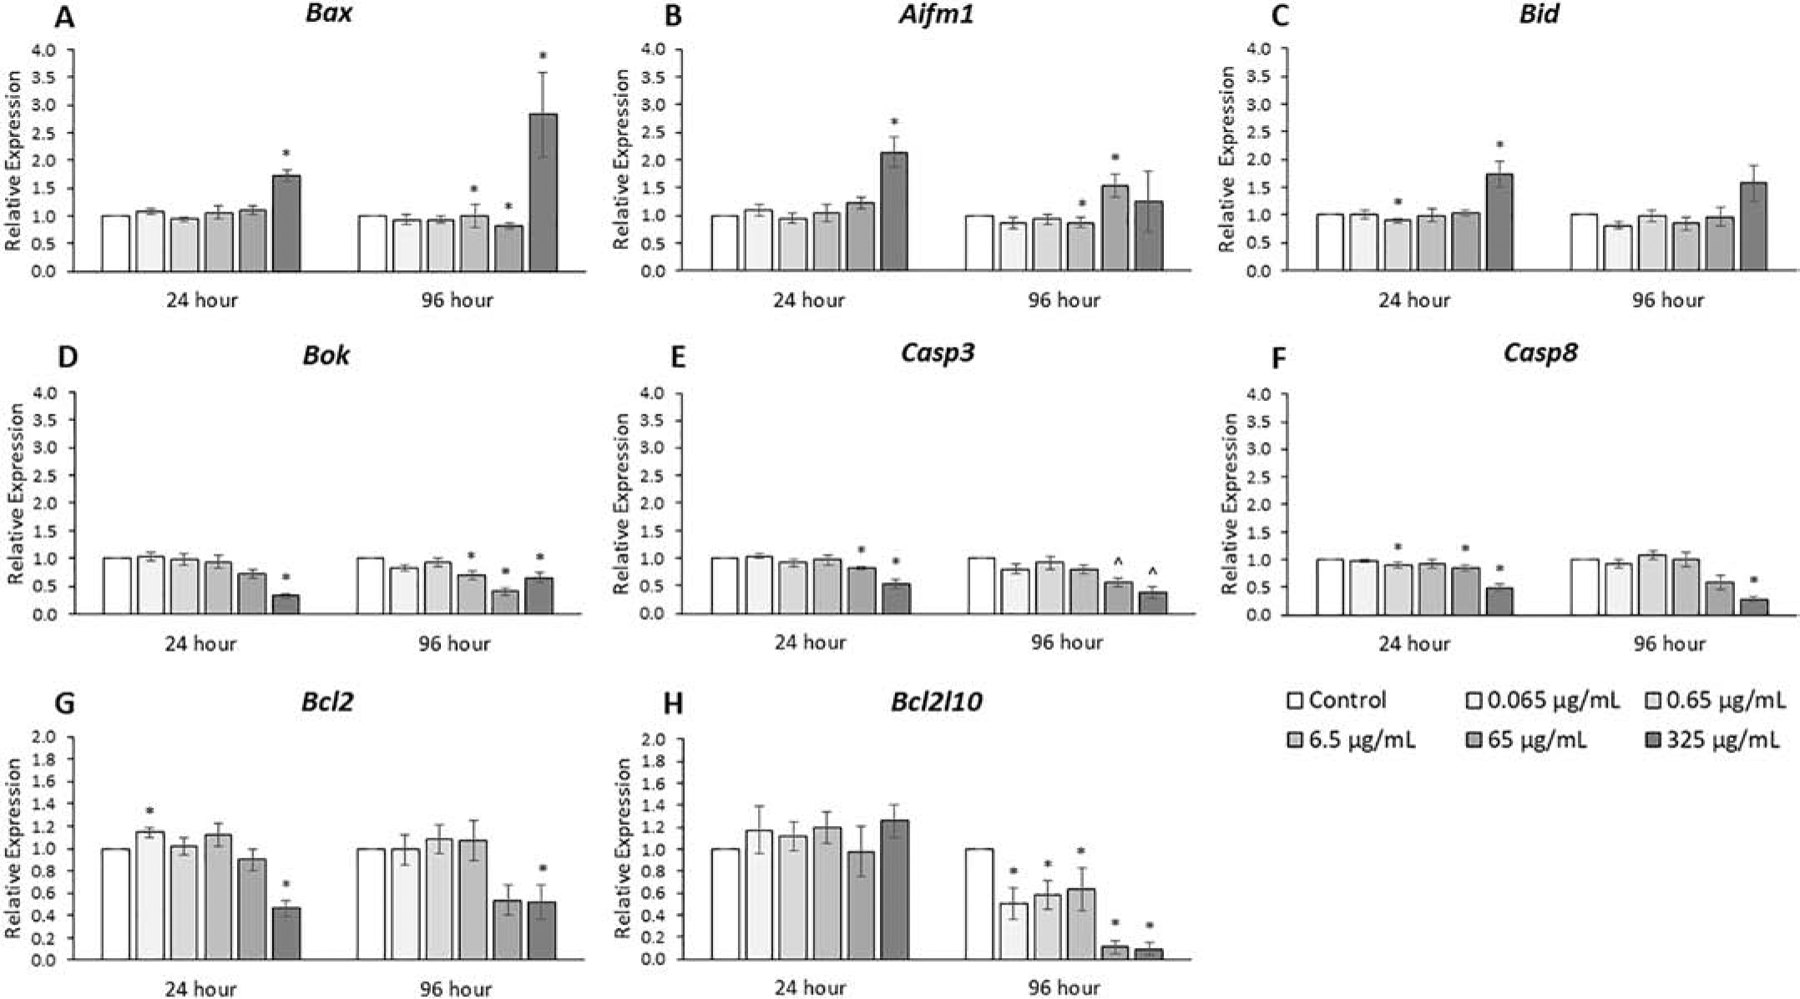
Effects of the monophthalate mixture on six pro-apoptotic and two anti-apoptotic gene expression levels from antral follicles. Mouse antral follicles were treated with vehicle control (DMSO) or the monophthalate mixture (0.065–325 μg/mL) for 96 hours. At 24 and 96 hours, cDNA samples derived from follicles were subjected to qPCR for Bax (A), Aifm1 (B), Bid (C), Bok (D), Casp3 (E), Casp8 (F), Bcl2 (G), and Bcl2l10 (H). The graphs indicate means ± SEMs from 3–7 separate cultures (8–12 follicles/treatment/culture). * p ≤ 0.05; ^ 0.05 < p ≤ 0.10
The expression levels of genes that inhibit apoptosis were also analyzed in the treatment groups (Fig. 7, n=3–7). The phthalate mixture at 24 hours (0.065 μg/mL) increased the expression of Bcl2 over 10% compared to control and the phthalate mixture at 24 hours (325 μg/mL) decreased the expression of Bcl2 about 2-fold compared to control (p ≤ 0.05). Time-dependent effects were stronger for Bcl2l10 as the phthalate mixture at 96 hours (0.065, 0.65, 6.5, 65, and 325 μg/mL) decreased the expression of Bcl2l10 between 2- and 10-fold compared to control (p ≤ 0.05).
Effects of the Metabolite Mixture on Antioxidant Enzyme Gene Expression
Oxidative stress has been shown to increase in the ovary due to phthalate exposure [17, 33]. Antioxidant enzymes are important for counteracting stress, so expression levels of four such enzymes were tested in this study and the results varied depending on dose, time, and gene (Fig. 8, n=3–7). The phthalate mixture at 24 and 96 hours (65 and 325 μg/mL) caused Cat and Gsr expression to be as much as 3-fold higher compared to control (p ≤ 0.05). The phthalate mixture at 24 and 96 hours (325 μg/mL) caused Gpx expression to be as much as 2-fold lower compared to control (p ≤ 0.05).
Figure 8.
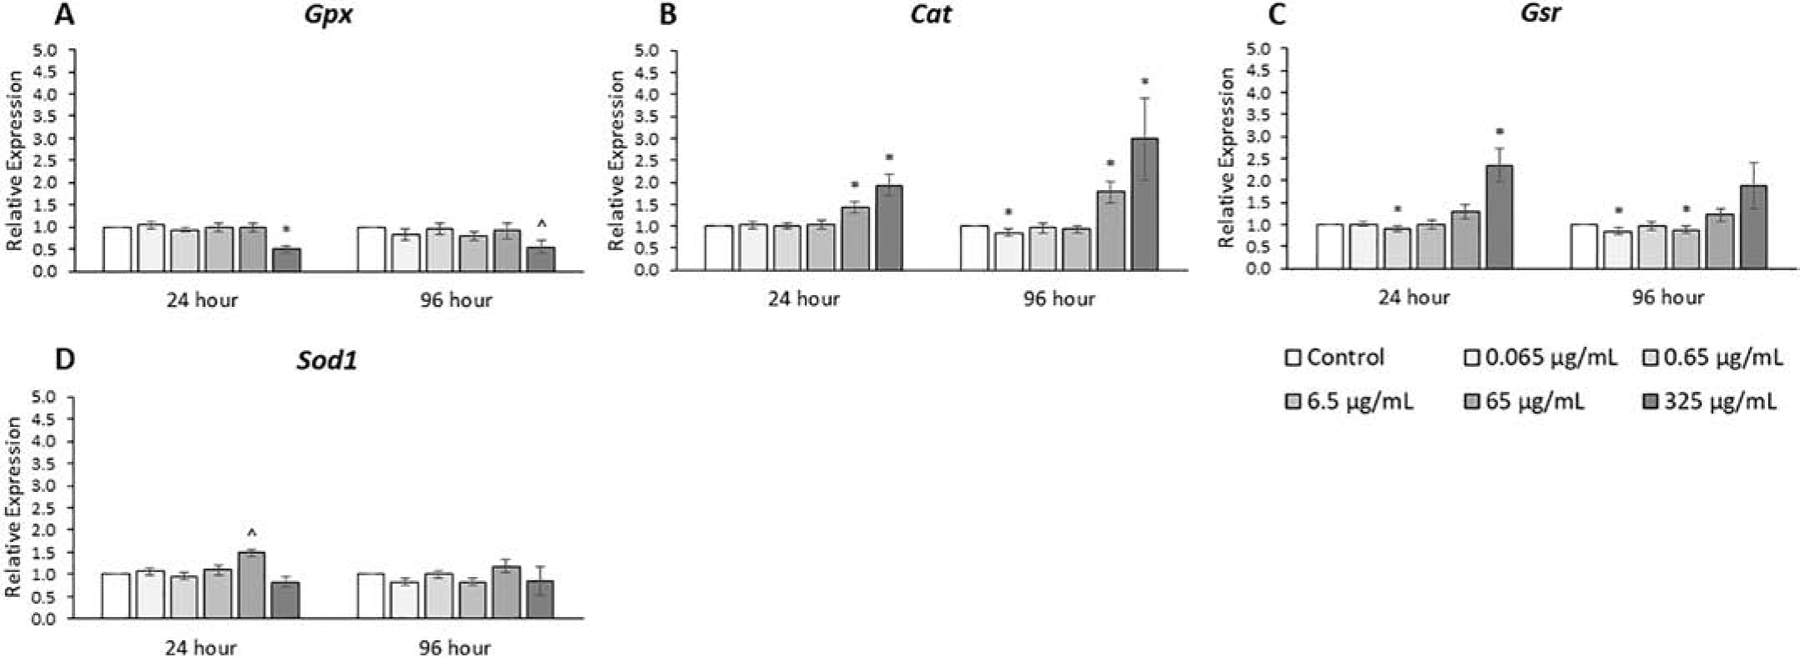
Effects of the monophthalate mixture on oxidative stress pathway gene expression levels from antral follicles. Mouse antral follicles were treated with vehicle control (DMSO) or the monophthalate mixture (0.065–325 μg/mL) for 96 hours. At 24 and 96 hours, cDNA samples derived from follicles were subjected to qPCR for Gpx (A), Cat (B), Gsr (C), and Sod (D). The graphs indicate means ± SEMs from 3–7 separate cultures (8–12 follicles/treatment/culture). * p ≤ 0.05; ^ 0.05 < p ≤ 0.10
Effects of the Metabolite Mixture on Receptor Gene Expression
The expression levels of various receptors were compared among treatment groups (Figs. 9, 10, & 11, n=3–7). Some nuclear receptors, such as PPARs, Ahr, and Car have been shown to interact directly with phthalates [34–36]. The cell surface receptors for LH and FSH (Lhcgr and Fshr) directly affect steroidogenesis and follicle proliferation [3]. The phthalate mixture at 24 and 96 hours (325 μg/mL) decreased Ppara expression 2- to 5-fold compared to control (p ≤ 0.05). In contrast, the phthalate mixture at 24 hours (65 and 325 μg/mL) increased Ppard expression from 30% to 2-fold compared to control (p ≤ 0.05). Similarly, at 24 hours (65 and 325 μg/mL) the phthalate mixture increased Pparg expression from 50% to 2-fold and at 96 hours (325 μg/mL), the mixture increased Pparg expression by 60% compared to control (p ≤ 0.05). In addition, at 24 hours (65 and 325 μg/mL), the phthalate mixture increased Car expression from 60% to 2-fold and at 96 hours (65 and 325 μg/mL), the mixture increased Car expression from 30 to 70% compared to control (p ≤ 0.05).
Figure 9.
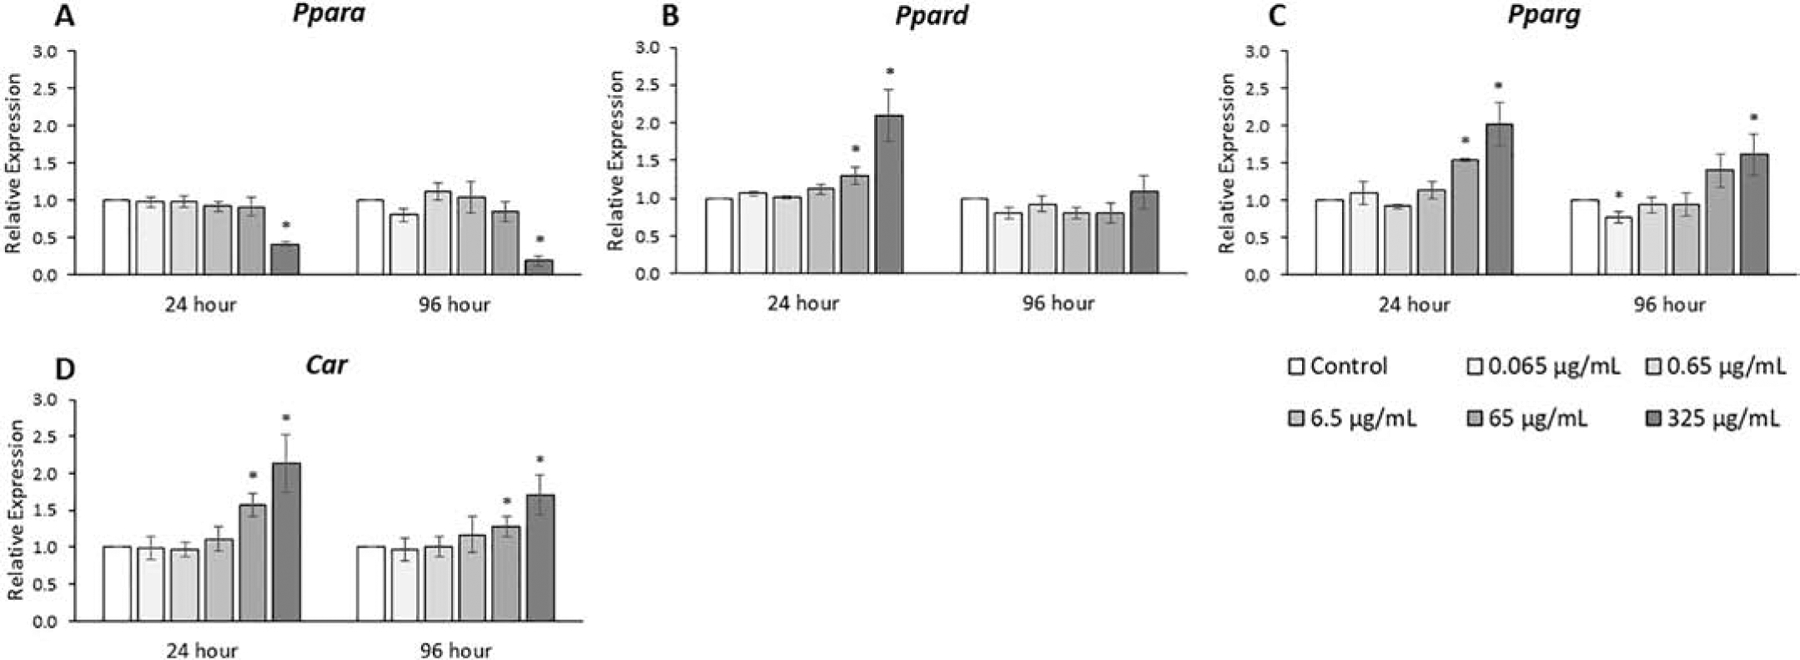
Effects of the monophthalate mixture on PPAR receptor and Car gene expression levels from antral follicles. Mouse antral follicles were treated with vehicle control (DMSO) or the monophthalate mixture (0.065–325 μg/mL) for 96 hours. At 24 and 96 hours, cDNA samples derived from follicles were subjected to qPCR for Ppara (A), Ppard (B), Pparg (C), Car (D). The graphs indicate means ± SEMs from 3–7 separate cultures (8–12 follicles/treatment/culture). * p ≤ 0.05; ^ 0.05 < p ≤ 0.10
Figure 10.
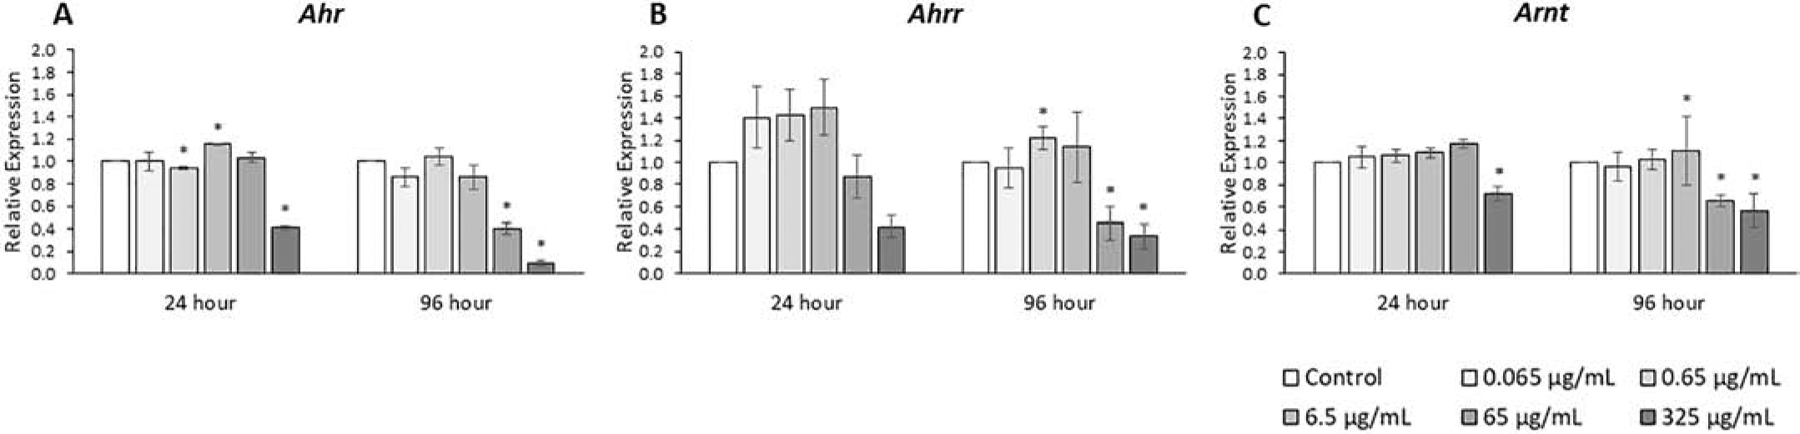
Effects of the monophthalate mixture on the expression levels of Ahr receptor and related genes from antral follicles. Mouse antral follicles were treated with vehicle control (DMSO) or the monophthalate mixture (0.065–325 μg/mL) for 96 hours. At 24 and 96 hours, cDNA samples derived from follicles were subjected to qPCR for Ahr (A), Ahrr (B), and Arnt (C). The graphs indicate means ± SEMs from 3–7 separate cultures (8–12 follicles/treatment/culture). * p ≤ 0.05; ^ 0.05 < p ≤ 0.10
Figure 11.
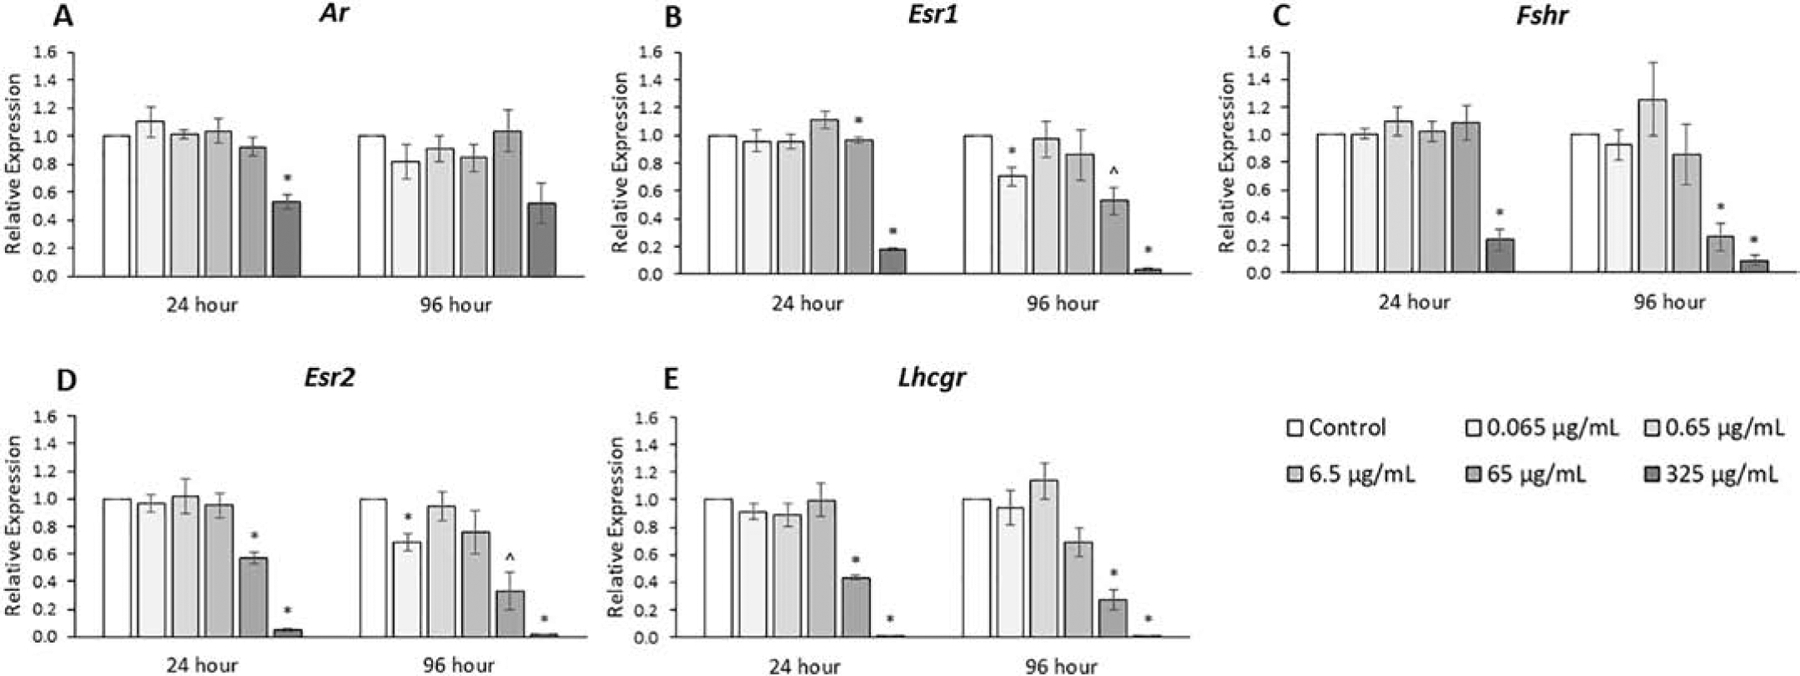
Effects of the monophthalate mixture on gene expression levels of relevant receptors from antral follicles. Mouse antral follicles were treated with vehicle control (DMSO) or the monophthalate mixture (0.065–325 μg/mL) for 96 hours. At 24 and 96 hours, cDNA samples derived from follicles were subjected to qPCR for Ar (A), Esr1 (B), Fshr (C), Esr2 (D), and Lhcgr (E). The graphs indicate means ± SEMs from 3–7 separate cultures (8–12 follicles/treatment/culture). * p ≤ 0.05; ^ 0.05 < p ≤ 0.10
The expression levels of the Ahr and of two interacting proteins, Arnt and Ahrr, were analyzed (Fig. 10, n=3–7). The phthalate mixture at 24 hours (325 μg/mL) decreased Ahr and Arnt expression 30% to 60% compared to control (p ≤ 0.05). The phthalate mixture at 96 hours (65 and 325 μg/mL) decreased Ahr, Ahrr, and Arnt expression 40% to 2-fold compared to control (p ≤ 0.05).
The expression levels of other relevant receptors are shown in Fig. 11 (n=3–7). For the androgen receptor, Ar, the phthalate mixture (325 μg/mL) decreased expression by 50% at 24 hours. Similar trends were seen for Esr1 and Fshr, where the phthalate mixture decreased expression at 24 hours (325 μg/mL) by 4- to 6-fold, at 96 hours (65 μg/mL) by 2- to 4-fold, and at 96 hours (325 μg/mL) by 20- to 25-fold compared to control (p ≤ 0.05). Similar trends were seen for Esr2 and Lhcgr, where the phthalate mixture decreased expression at 24 hours (65 μg/mL) by 2-fold, at 96 hours (65 μg/mL) by 3- to 4-fold, and at 24 and 96 hours (325 μg/mL) by 20- to 100-fold compared to control (p ≤ 0.05).
Discussion
In this study, we examined the effects of an environmentally relevant mixture of phthalate metabolites on antral follicles in culture. Our main findings show that the mixture decreased follicle growth and caused dysregulation of genes involved in the expression of key receptors, cell cycle progression, oxidative stress, and apoptosis. In addition, the mixture caused changes in the expression of genes involved in steroidogenesis and corresponding changes in levels of sex steroid hormones. Many of the trends in changes in gene expression were the same as for our previous study using a mixture of parent phthalate compounds [23]. In general, the changes were more dramatic with the metabolite mixture, as would be expected since the monoester phthalate metabolites are known to be more bioactive than the parent diesters [12–17]. Most of the genes analyzed showed decreases in gene expression with the mixture, but over 25% of the genes analyzed showed significant increases in expression at the highest doses; this indicates that the mechanisms involved are more complex than a general loss of cellular function at highest doses.
The mixture of phthalate metabolites used in this study was based upon the results of a study of phthalate metabolites present in the urine of pregnant women. Both the ratios of the six phthalates and the levels of the doses are similar to a previous study from our laboratory using a parent phthalate mixture [23]. For comparison, 500 μg/mL of the parent mixture is approximately equal to 375 μg/mL of the monophthalate mixture on a molar basis. Therefore, the four highest doses in the parent phthalate study (1, 10, 100, and 500 μg/mL) are quite comparable to the four highest doses of monophthalates in this study (0.65, 6.5, 65, and 325 μg/mL) on a molar basis.
We observed that the mixture at the highest doses decreased the growth rate of cultured follicles after 72 and 96 hours. Corresponding to these decreased growth rates were observed decreases in the expression of seven of nine genes (CCNs and CDKs) that stimulate progression through the cell cycle. In addition, the mixture caused a marked decrease in the expression of Ki67, a common marker of proliferation. We also observed some changes in expression levels of CDKIs, genes that inhibit the CDKs through protein-protein interactions, as the mixture both increased and decreased expression of the seven genes analyzed compared to control. We also analyzed the expression of Skp2, a cyclin that promotes progression through the cell cycle by promoting degradation of the CDKN1A, CDKN1B, and CDKN1C inhibitor proteins. Therefore, the decreases in expression of Skp2 at the highest doses means that it is likely that protein levels of these three inhibitors at the highest doses might be greater than would be expected solely from their transcript levels, i.e. CDKN1A levels might be even higher and CDKN1B and CDKN1C levels might have a smaller decrease compared their respective transcript levels versus control. An important observation was that many of these changes in expression of cell cycle genes were present at the 24-hour time point, which is prior to the first observed decreases in growth rates at 72 hours. This suggests that the mixture-induced changes in expression lead to slow follicle growth. Previous studies have shown that monoester phthalates, such as MEHP, or parent phthalates, such as DBP, DEHP, or a parent mixture, can affect cell cycle regulators [14, 23, 29]. The general trends of decreased expression of cell cycle promoters and/or increased expression of cell cycle inhibitors are consistent between this study and those previous studies.
We also analyzed another class of genes related to observed rates of follicle growth, pro- and anti-apoptotic genes. At the three lowest doses, the general trend was that the mixture caused small decreases in the expression of pro-apoptotic genes and small increases in anti-apoptotic genes, which in combination may decrease the amount of cell death. This is consistent with our unchanged growth curve results at these doses because decreases in the rates of cellular atresia would not be expected to result in noticeable increases in the rates of follicle growth. However, increases in the ratios of pro- to anti-apoptotic gene expression could lead to increases in atresia that are detectable at the level of follicle size. This may be the case at the two higher doses where the general trend was an increase in pro-apoptotic factors and a decrease in anti-apoptotic factors. This trend is opposite that of our previous study in which the parent phthalate mixture decreased the Bax/Bcl2 ratio at the highest doses [23] but is similar to our previous study where MEHP alone increased the Bax/Bcl2 ratio [17]. These results for the monophthalate mixture indicate there may be increased atresia in antral follicles with very high exposures to phthalate metabolites and potentially a slight protective effect against atresia in antral follicles at lower doses of parent compounds in the range of normal environmental exposures [14, 23, 29, 37]. Interestingly, a previous study using the parent mixture showed a reduction in atresia compared to control. This is likely because the mixture-treated follicles are suspended in the cell cycle, and thus they are less likely to undergo atresia [23]. Future studies with monophthalates could examine cell viability and membrane integrity.
Another cellular mechanism that could contribute to the reduced growth rate of antral follicles that we observed is oxidative stress [3, 38]. We monitored the gene expression of four genes that encode enzymes key for controlling the levels of reactive oxygen species (ROS), Gpx, Cat, Gsr, and Sod1. The results were mixed, as one of the four genes decreased and two of the four genes increased in expression in response to the mixture. The decrease in Gpx expression caused by the mixture is similar to our previous study in which MEHP alone decreased Gpx expression [17]. A decrease in Gpx expression could lead to a decrease in peroxidase activity and therefore an accumulation of the ROS H2O2. Previous studies have shown that Cat may increase in expression, as was seen in this study, in response to oxidative stress from increased H2O2 levels [39]. Previous studies also show a precedent for oxidative stress to induce Gsr expression [40, 41], as was seen in this study.
One important function of antral follicles is the production of sex steroid hormones; thus, we examined the effect of the mixture on expression levels of genes in the synthesis and degradation pathways of the sex steroid hormones. The mixture decreased the expression of five enzymes in the pathway that converts cholesterol to estradiol. Genes at the beginning and middle of the pathway (Cyp11a1, Hsd3b1) were affected at only the highest dose, genes in the middle and end of the pathway (Cyp17a1, Hsd17b1) were affected at the two highest doses, and a gene at the end of the pathway (Cyp19a1) was affected at the three highest doses. The results for the two enzymes responsible for estradiol degradation were mixed, as the mixture caused increased expression of Cyp1a1 and decreased expression of Cyp1b1 at the highest doses. The gene that regulates the import of cholesterol into the pathway is Star, and in contrast to the changes in other genes, its expression was significantly higher at the two highest doses. Figure 12 shows a summary of the overall trends of changes in gene expression and hormone levels in this pathway after 96 hours of follicle culture.
Figure 12.
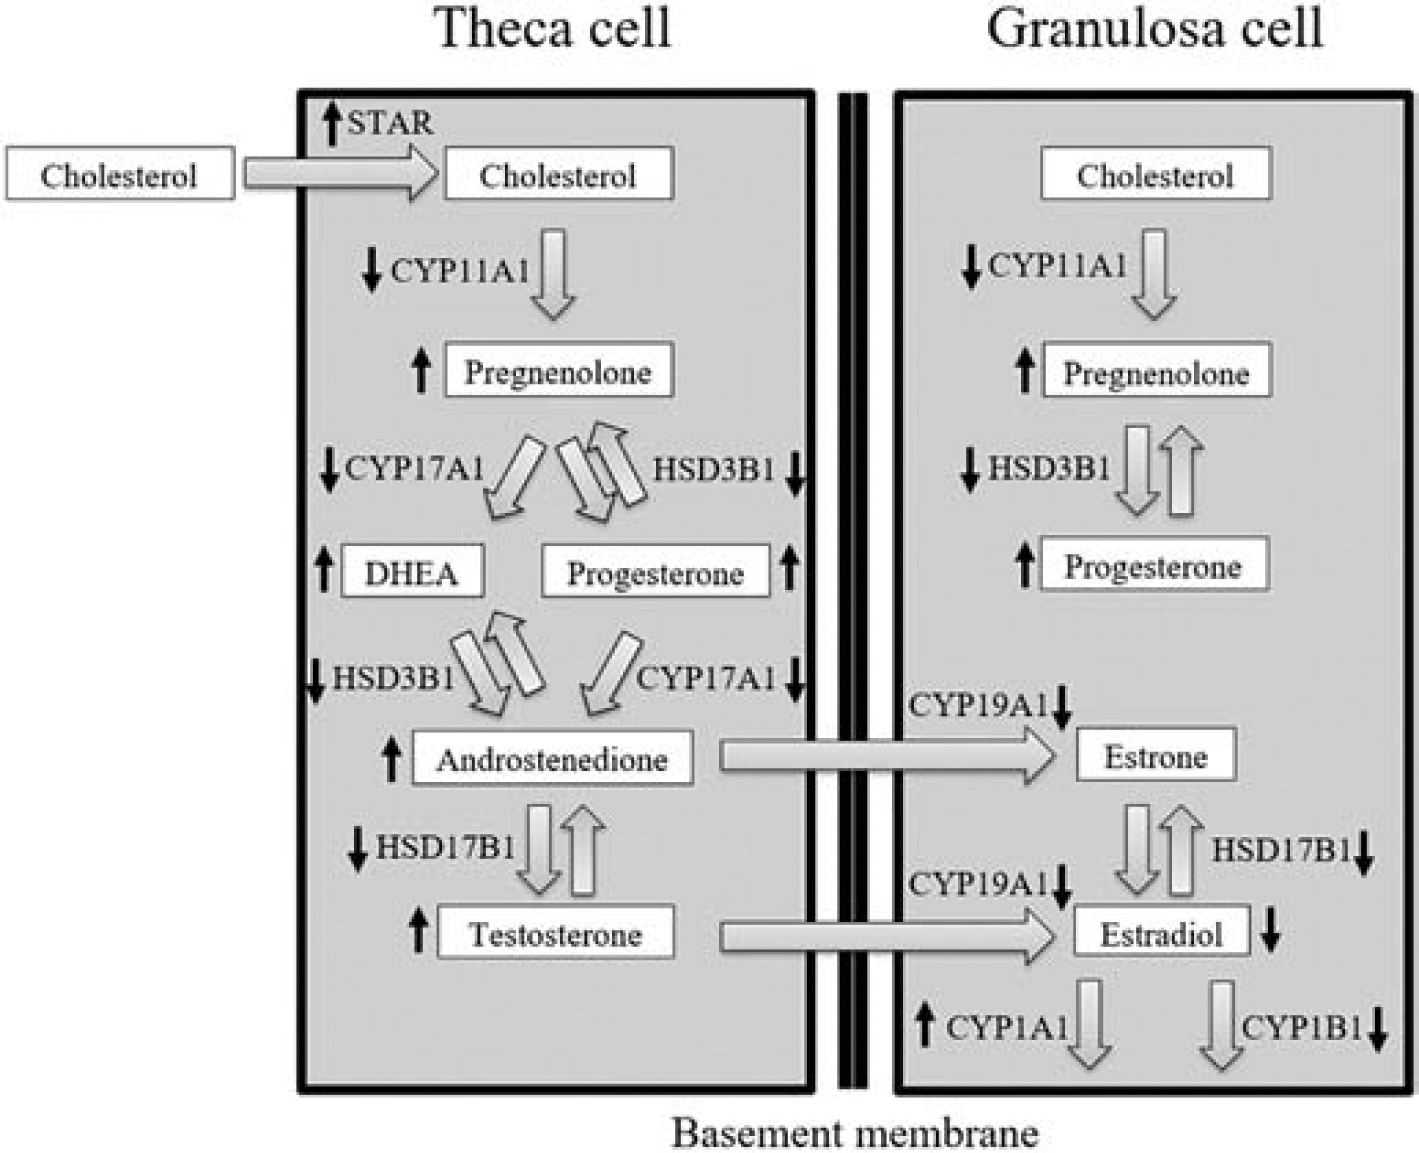
Antral follicle steroidogenesis. Steroidogenesis occurs in mature antral follicles in the ovary. The conversion from cholesterol to 17β-estradiol requires both theca and granulosa cells in the follicle. Cholesterol and downstream sex steroid hormones are written in the boxes. STAR and enzymes in the pathway are written next to the arrows between the boxes. Up or down arrows next to proteins or hormones in the pathway indicate the increases or decreases in gene expression or hormone levels after 96 hours of culture.
The overall trend of mixture-induced decreases in gene expression of the five enzymes in the synthetic pathway is similar to what we observed in our study of the parent phthalate mixture [23]. Like with the parent mixture, the most sensitive biosynthetic gene to phthalate exposure was Cyp19a1, which was decreased at the two highest doses with parent phthalate exposure and at the three highest doses with the monophthalate exposure compared to control. In general, for these five genes, the decreases in gene expression occur at the same doses or at lower doses with monophthalate exposure versus parent compound exposure. Not surprisingly, at comparable doses, the decreases in expression of each gene with monophthalate mixture exposures are from 5–50 times greater than with parent mixture exposures. A rather surprising difference is that monophthalate exposure led to an increase in Star expression, whereas parent phthalates led to a decrease in Star expression [23].
Different genes in the synthesis and degradation pathways showed different levels of sensitivity to phthalates, which means different doses could lead to different profiles of hormone levels. For hormones earlier in the pathway (progesterone, DHEA, and androstenedione), the mixture at the higher doses decreased hormonal concentrations, and surprisingly the highest levels were seen at the second to highest dose for all three hormones. These non-monotonic dose responses are likely due to the greater sensitivity at lower doses of genes later in the pathway, which results in different equilibrium levels of these hormones at each dose. Nearer the end of the pathway, the mixture increased testosterone greatly in a dose-dependent manner compared to control. All of these accumulations in hormone levels may be attributed to extremely low levels of the biosynthetic enzymes coupled with an increase in cholesterol import by Star. This is in contrast to a general decrease in hormone levels in a previous study where the parent mixture caused modest decreases in the expression of genes in the pathway [23]. The pattern for estradiol, which is at the end of the pathway, is different, for its levels decrease with increases in dose. This might be explained by the fact that unlike the other hormones in the pathway, the degradation enzymes immediately downstream of estradiol (Cyp1a1 and Cyp1b1) have a combined expression level that is relatively similar in high doses as in control. Very high levels of hormones were observed in media for some of the treatment conditions. These increases correlate with dramatic decreases in expression of genes in the biosynthetic pathway; however, accumulation of such high levels would not be likely to occur in vivo where the intermediate hormones in the pathway would be transported away through the bloodstream.
In this study, we examined the expression of a number of nuclear receptors and associated proteins that may be bind phthalates and subsequently affect the transcription of downstream targets. In general, most of these receptors decreased in expression at the highest doses, with the exception of Pparg and Car, which showed significant increases in expression at the highest doses. Pparg is known to have a relatively higher binding affinity for monophthalates than parent phthalates [36] and in this study, we observed an increase in expression of Pparg at higher doses, so we might expect increases in expression of some downstream targets. Although most genes in this study showed decreased expression at higher doses, the large increases in expression of known targets Cdkn1a and Cat may be mediated through Pparg [42, 43].
The mixture caused moderate decreases in the expression levels of Ahr, its binding partner Arnt, and its repressor Ahrr at the highest doses. Some phthalates in the mixture are known to act through AHR [35], so it is possible that there would be changes in the expression of known targets of AHR, Cyp1a1 and Cyp1b1 [44]. Although it was expected that the mixture could increase Cyp1a1 at the highest dose, the mixture also decreased Cyp1b1 at the two highest doses compared to control. These differences in expression patterns might be because these two genes are regulated differently by estradiol and the ESR1 receptor [45, 46]. At the two highest doses, the mixture caused variability in the concentration of estradiol in the media and large decreases in Esr1 expression, thus possibly contributing to the differential expression patterns. These decreases in Esr1 and estradiol could also have effects on the cell cycle because many cell cycle regulators are targets of Esr1. The decreased Esr1 expression could be partially responsible for decreased expression levels of Cyp19a1 seen in this study. Two key genes for surface receptors that are important for normal steroidogenesis are Lhcgr in theca cells and Fshr in granulosa cells [3]. The mixture caused large decreases in expression at the highest doses compared to control, which likely plays a large role in the dysregulation of the steroid synthesis pathway observed in this study.
The effects of monoester phthalates on antral follicles are relevant because oral exposure of parent phthalate compounds results in rapid first-pass metabolism to monoesters. The effects of monoester phthalates are increasingly relevant based on new evidence of the ability of the ovary to metabolize parent phthalates [47], which bypasses first-pass metabolism in the cases of intravenous and dermal exposure. Our previous study [47] showed that after 96 hours of culture, parent phthalates are converted to monoesters at rates ranging from 10–20% for the highest dose to as high as 80% for the lower doses. Therefore, the parent mixture study had approximately 10-fold lower levels of each monophthalate at comparable doses, so it makes sense that the dose-response curve is shifted by approximately one order of magnitude for many of the genes. Interestingly, when comparing these same two culture systems, a few of the genes have changes in expression in the opposite direction, such as Star and Cdkn1a, which indicates that in some cases the parent phthalates alone can affect changes in gene expression without first being converted to monophthalates.
In summary, we have shown that monoester phthalate metabolites can greatly affect follicle growth, expression of genes in key pathways for follicle health, and the production of sex steroid hormones by antral follicles. Based on these results, future studies could focus on the differential effects of individual phthalate metabolites in the mixture.
HIGHLIGHTS.
A monophthalate mixture dysregulates sex steroid synthesis in antral follicles
A monophthalate mixture dysregulates expression of sex steroid synthesis genes
A monophthalate mixture decreases antral follicle growth
A monophthalate mixture dysregulates expression of cell cycle regulators
A monophthalate mixture dysregulates apoptotic factor gene expression
ACKNOWLEDGEMENTS
The authors thank the members of Dr. Flaws’ Lab for assistance with experiments. This work was supported by National Institutes of Health grants R01 ES 028661, R56 ES 025147, and T32 ES 007326.
Footnotes
Publisher's Disclaimer: This is a PDF file of an unedited manuscript that has been accepted for publication. As a service to our customers we are providing this early version of the manuscript. The manuscript will undergo copyediting, typesetting, and review of the resulting proof before it is published in its final form. Please note that during the production process errors may be discovered which could affect the content, and all legal disclaimers that apply to the journal pertain.
Declaration of interests
The authors declare that they have no known competing financial interests or personal relationships that could have appeared to influence the work reported in this paper.
REFERENCES
- 1.Heudorf U, Mersch-Sundermann V, and Angerer J, Phthalates: toxicology and exposure. Int J Hyg Environ Health, 2007. 210(5): p. 623–34. [DOI] [PubMed] [Google Scholar]
- 2.Registry, A.f.T.S.D., Toxicological Profile for Di(2-ethylhexyl)phthalate (DEHP). 2002. [PubMed]
- 3.Hannon PR and Flaws JA, The effects of phthalates on the ovary. Front Endocrinol (Lausanne), 2015. 6: p. 8. [DOI] [PMC free article] [PubMed] [Google Scholar]
- 4.Kay VR, Chambers C, and Foster WG, Reproductive and developmental effects of phthalate diesters in females. Crit Rev Toxicol, 2013. 43(3): p. 200–19. [DOI] [PMC free article] [PubMed] [Google Scholar]
- 5.Calafat AM, et al. , Exposure to di-(2-ethylhexyl) phthalate among premature neonates in a neonatal intensive care unit. Pediatrics, 2004. 113(5): p. e429–34. [DOI] [PubMed] [Google Scholar]
- 6.Hauser R, et al. , Medications as a source of human exposure to phthalates. Environ Health Perspect, 2004. 112(6): p. 751–3. [DOI] [PMC free article] [PubMed] [Google Scholar]
- 7.Hines EP, et al. , Concentrations of phthalate metabolites in milk, urine, saliva, and Serum of lactating North Carolina women. Environ Health Perspect, 2009. 117(1): p. 86–92. [DOI] [PMC free article] [PubMed] [Google Scholar]
- 8.Du YY, et al. , Follicular fluid and urinary concentrations of phthalate metabolites among infertile women and associations with in vitro fertilization parameters. Reprod Toxicol, 2016. 61: p. 142–50. [DOI] [PubMed] [Google Scholar]
- 9.Krotz SP, et al. , Phthalates and bisphenol do not accumulate in human follicular fluid. J Assist Reprod Genet, 2012. 29(8): p. 773–7. [DOI] [PMC free article] [PubMed] [Google Scholar]
- 10.Kato K, et al. , Mono(2-ethyl-5-hydroxyhexyl) phthalate and mono-(2-ethyl-5-oxohexyl) phthalate as biomarkers for human exposure assessment to di-(2-ethylhexyl) phthalate. Environ Health Perspect, 2004. 112(3): p. 327–30. [DOI] [PMC free article] [PubMed] [Google Scholar]
- 11.Hogberg J, et al. , Phthalate diesters and their metabolites in human breast milk, blood or serum, and urine as biomarkers of exposure in vulnerable populations. Environ Health Perspect, 2008. 116(3): p. 334–9. [DOI] [PMC free article] [PubMed] [Google Scholar]
- 12.Hannon PR, et al. , Mono(2-ethylhexyl) phthalate accelerates early folliculogenesis and inhibits steroidogenesis in cultured mouse whole ovaries and antral follicles. Biol Reprod, 2015. 92(5): p. 120. [DOI] [PMC free article] [PubMed] [Google Scholar]
- 13.Davis BJ, et al. , Mono-(2-ethylhexyl) phthalate suppresses estradiol production independent of FSH-cAMP stimulation in rat granulosa cells. Toxicol Appl Pharmacol, 1994. 128(2): p. 224–8. [DOI] [PubMed] [Google Scholar]
- 14.Hannon PR, et al. , Di(2-ethylhexyl) phthalate inhibits antral follicle growth, induces atresia, and inhibits steroid hormone production in cultured mouse antral follicles. Toxicol Appl Pharmacol, 2015. 284(1): p. 42–53. [DOI] [PMC free article] [PubMed] [Google Scholar]
- 15.Lovekamp TN and Davis BJ, Mono-(2-ethylhexyl) phthalate suppresses aromatase transcript levels and estradiol production in cultured rat granulosa cells. Toxicol Appl Pharmacol, 2001. 172(3): p. 217–24. [DOI] [PubMed] [Google Scholar]
- 16.Lovekamp-Swan T and Davis BJ, Mechanisms of phthalate ester toxicity in the female reproductive system. Environ Health Perspect, 2003. 111(2): p. 139–45. [DOI] [PMC free article] [PubMed] [Google Scholar]
- 17.Wang W, et al. , Mono-(2-ethylhexyl) phthalate induces oxidative stress and inhibits growth of mouse ovarian antral follicles. Biol Reprod, 2012. 87(6): p. 152. [DOI] [PMC free article] [PubMed] [Google Scholar]
- 18.Meeker JD, et al. , Urinary phthalate metabolites in relation to preterm birth in Mexico city. Environ Health Perspect, 2009. 117(10): p. 1587–92. [DOI] [PMC free article] [PubMed] [Google Scholar]
- 19.Toft G, et al. , Association between pregnancy loss and urinary phthalate levels around the time of conception. Environ Health Perspect, 2012. 120(3): p. 458–63. [DOI] [PMC free article] [PubMed] [Google Scholar]
- 20.Ferguson KK, et al. , Variability in urinary phthalate metabolite levels across pregnancy and sensitive windows of exposure for the risk of preterm birth. Environ Int, 2014. 70: p. 118–24. [DOI] [PMC free article] [PubMed] [Google Scholar]
- 21.Johansson HK, et al. , Perinatal exposure to mixtures of endocrine disrupting chemicals reduces female rat follicle reserves and accelerates reproductive aging. Reprod Toxicol, 2016. 61: p. 186–94. [DOI] [PubMed] [Google Scholar]
- 22.Zhou C, Gao L, and Flaws JA, Prenatal exposure to an environmentally relevant phthalate mixture disrupts reproduction in F1 female mice. Toxicol Appl Pharmacol, 2017. 318: p. 49–57. [DOI] [PMC free article] [PubMed] [Google Scholar]
- 23.Zhou C and Flaws JA, Effects of an Environmentally Relevant Phthalate Mixture on Cultured Mouse Antral Follicles. Toxicol Sci, 2017. 156(1): p. 217–229. [DOI] [PMC free article] [PubMed] [Google Scholar]
- 24.Gupta RK, et al. , Di-(2-ethylhexyl) phthalate and mono-(2-ethylhexyl) phthalate inhibit growth and reduce estradiol levels of antral follicles in vitro. Toxicol Appl Pharmacol, 2010. 242(2): p. 224–30. [DOI] [PMC free article] [PubMed] [Google Scholar]
- 25.Lai FN, et al. , Di (2-ethylhexyl) phthalate impairs steroidogenesis in ovarian follicular cells of prepuberal mice. Arch Toxicol, 2017. 91(3): p. 1279–1292. [DOI] [PubMed] [Google Scholar]
- 26.Ge W, et al. , Establishment and depletion of the ovarian reserve: physiology and impact of environmental chemicals. Cell Mol Life Sci, 2019. 76(9): p. 1729–1746. [DOI] [PMC free article] [PubMed] [Google Scholar]
- 27.Yazdy MM, et al. , A possible approach to improving the reproducibility of urinary concentrations of phthalate metabolites and phenols during pregnancy. J Expo Sci Environ Epidemiol, 2018. 28(5): p. 448–460. [DOI] [PMC free article] [PubMed] [Google Scholar]
- 28.Koch HM and Calafat AM, Human body burdens of chemicals used in plastic manufacture. Philos Trans R Soc Lond B Biol Sci, 2009. 364(1526): p. 2063–78. [DOI] [PMC free article] [PubMed] [Google Scholar]
- 29.Craig ZR, et al. , Di-n-butyl phthalate disrupts the expression of genes involved in cell cycle and apoptotic pathways in mouse ovarian antral follicles. Biol Reprod, 2013. 88(1): p. 23. [DOI] [PMC free article] [PubMed] [Google Scholar]
- 30.Gupta RK, et al. , Methoxychlor inhibits growth and induces atresia of antral follicles through an oxidative stress pathway. Toxicol Sci, 2006. 93(2): p. 382–9. [DOI] [PubMed] [Google Scholar]
- 31.Miller KP, et al. , Methoxychlor directly affects ovarian antral follicle growth and atresia through Bcl-2- and Bax-mediated pathways. Toxicol Sci, 2005. 88(1): p. 213–21. [DOI] [PubMed] [Google Scholar]
- 32.Pfaffl MW, A new mathematical model for relative quantification in real-time RT-PCR. Nucleic Acids Res, 2001. 29(9): p. e45. [DOI] [PMC free article] [PubMed] [Google Scholar]
- 33.Wang W, et al. , Di (2-ethylhexyl) phthalate inhibits growth of mouse ovarian antral follicles through an oxidative stress pathway. Toxicol Appl Pharmacol, 2012. 258(2): p. 288–95. [DOI] [PMC free article] [PubMed] [Google Scholar]
- 34.DeKeyser JG, et al. , Di(2-ethylhexyl) phthalate is a highly potent agonist for the human constitutive androstane receptor splice variant CAR2. Mol Pharmacol, 2009. 75(5): p. 1005–13. [DOI] [PMC free article] [PubMed] [Google Scholar]
- 35.Kruger T, Long M, and Bonefeld-Jorgensen EC, Plastic components affect the activation of the aryl hydrocarbon and the androgen receptor. Toxicology, 2008. 246(2–3): p. 112–23. [DOI] [PubMed] [Google Scholar]
- 36.Lampen A, Zimnik S, and Nau H, Teratogenic phthalate esters and metabolites activate the nuclear receptors PPARs and induce differentiation of F9 cells. Toxicol Appl Pharmacol, 2003. 188(1): p. 14–23. [DOI] [PubMed] [Google Scholar]
- 37.Quirk SM, et al. , Ovarian follicular growth and atresia: the relationship between cell proliferation and survival. J Anim Sci, 2004. 82 E-Suppl: p. E40–52. [DOI] [PubMed] [Google Scholar]
- 38.Liu JC, et al. , Identification of oxidative stress-related Xdh gene as a di(2-ethylhexyl)phthalate (DEHP) target and the use of melatonin to alleviate the DEHP-induced impairments in newborn mouse ovaries. J Pineal Res, 2019. 67(1): p. e12577. [DOI] [PubMed] [Google Scholar]
- 39.Rohrdanz E, et al. , The influence of oxidative stress on catalase and MnSOD gene transcription in astrocytes. Brain Res, 2001. 900(1): p. 128–36. [DOI] [PubMed] [Google Scholar]
- 40.Tonelli C, Chio IIC, and Tuveson DA, Transcriptional Regulation by Nrf2. Antioxid Redox Signal, 2018. 29(17): p. 1727–1745. [DOI] [PMC free article] [PubMed] [Google Scholar]
- 41.Harvey CJ, et al. , Nrf2-regulated glutathione recycling independent of biosynthesis is critical for cell survival during oxidative stress. Free Radic Biol Med, 2009. 46(4): p. 443–53. [DOI] [PMC free article] [PubMed] [Google Scholar]
- 42.Kaur S, et al. , Peroxisome Proliferator Activated Receptor Gamma Sensitizes Non-small Cell Lung Carcinoma to Gamma Irradiation Induced Apoptosis. Front Genet, 2019. 10: p. 554. [DOI] [PMC free article] [PubMed] [Google Scholar]
- 43.Okuno Y, et al. , Human catalase gene is regulated by peroxisome proliferator activated receptor-gamma through a response element distinct from that of mouse. Endocr J, 2010. 57(4): p. 303–9. [DOI] [PubMed] [Google Scholar]
- 44.Go RE, Hwang KA, and Choi KC, Cytochrome P450 1 family and cancers. J Steroid Biochem Mol Biol, 2015. 147: p. 24–30. [DOI] [PubMed] [Google Scholar]
- 45.Tsuchiya Y, et al. , Human CYP1B1 is regulated by estradiol via estrogen receptor. Cancer Res, 2004. 64(9): p. 3119–25. [DOI] [PubMed] [Google Scholar]
- 46.Dunlap TL, et al. , Red Clover Aryl Hydrocarbon Receptor (AhR) and Estrogen Receptor (ER) Agonists Enhance Genotoxic Estrogen Metabolism. Chem Res Toxicol, 2017. 30(11): p. 2084–2092. [DOI] [PMC free article] [PubMed] [Google Scholar]
- 47.Warner GR, et al. , Ovarian Metabolism of an Environmentally Relevant Phthalate Mixture. Toxicol Sci, 2019. 169(1): p. 246–259. [DOI] [PMC free article] [PubMed] [Google Scholar]