Abstract
Health risks induced by PM2.5 have become one of the major concerns among living populations, especially in regions facing serious pollution such as China and India. Furthermore, the composition of PM2.5 is complex and it also varies with time and locations. To facilitate our understanding of PM2.5-induced toxicity, a predictive modeling framework was developed in the present study. The core of this study was 1) to construct a virtual carbon nanoparticle library based on the experimental data to simulate the PM2.5 structures; 2) to quantify the nanoparticle structures by novel nanodescriptors; and 3) to perform computational modeling for critical toxicity endpoints. The virtual carbon nanoparticle library was developed to represent the nanostructures of 20 carbon nanoparticles, which were synthesized to simulate PM2.5 structures and tested for potential health risks. Based on the calculated nanodescriptors from virtual carbon nanoparticles, quantitative nanostructure-activity relationship (QNAR) models were developed to predict cytotoxicity and four different inflammatory responses induced by model PM2.5. The high predictability (R2 > 0.65 for leave-one-out validations) of the resulted consensus models indicated that this approach could be a universal tool to predict and analyze the potential toxicity of model PM2.5, ultimately understanding and evaluating the ambient PM2.5-induced toxicity.
Keywords: PM2.5-induced toxicity, virtual carbon nanoparticle library, nanodescriptors, machine learning
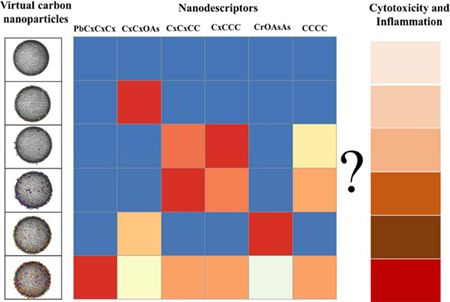
Graphical Abstract
1. Introduction
Ambient fine particulate matter (PM) with aerodynamic diameters less than 2.5 μm (PM2.5) poses a great threat to human health, especially in developing countries (Kim et al., 2015; Pui et al., 2014). Exposure to PM2.5 air pollution causes critical adverse health outcomes including ischemic heart disease, strokes, chronic obstructive pulmonary disease, respiratory infections, and even lung cancer (He et al., 2017; S. et al., 2016). According to a study by the Global Burden of Disease (GBD) in 2016, the exposure to PM2.5 was the 6th leading contributor to early deaths globally, which resulted in approximately 4.1 million global deaths in 2016 (Apte et al., 2018). There is an urgent need to identify key toxic components in PM2.5 and understand the associated toxicity mechanisms. However, PM2.5 is a complex mixture consisting of different components, including hundreds of organic, inorganic and biological pollutants (Szigeti et al., 2016). Furthermore, the components of PM2.5 are both time-and region-dependent (Dominici et al., 2007), making the experimental mechanism study extremely difficult. In a recent study, we reported a reductionism approach by synthesizing a model PM2.5 library containing 20 carbon nanoparticles, which absorbed representative toxic pollutants including Cr (VI), Pb2+, As (III) and/or Benzo[a]pyrene (BaP) at all possible combinations and at environmental concentrations (Jia et al., 2019; Pan et al., 2019). The model PM2.5 library was then tested in different assays to elucidate their toxic and inflammatory effects and was shown to be representative of PM2.5-induced toxicity. However, considering the complex PM2.5 composition, the exhaustive synthesis and experimental testing to fully simulate the biological response, such as toxicity of PM2.5 are not possible.
Due to the cost in both resources and time involved in experimental toxicity testing, there has been a considerable increase of the interest into alternative computational methods (Cai et al., 2018; Fourches et al., 2010). In previous studies, researchers have been devoted to building quantitative structure-activity relationship (QSAR) models for small sets of nanoparticles (Tantra et al., 2015; Winkler, 2016). However, most of the resulted models are not applicable to predict new nanoparticles. Two major issues limited the applicability of the resulted models: 1) the lack of enough high quality nano-bioactivity/toxicity data and 2) no computational approaches to precisely quantify nanostructure diversity. Theoretical descriptors calculated from small organic/inorganic molecules coated on the surface of nanoparticles, were proven to be useful in predicting certain bioactivities/properties of nanoparticles (Li et al., 2015; Liu et al., 2017; Zhang et al., 2016). However, the effects of the nanoparticle structures, such as core materials, particle size, and surface ligand density/distribution, were not considered. The structure information also contributed to the nano-bioactivity/toxicity (Jiang et al., 2015) and should be included in the modeling process. On the other hand, the use of experimental values as descriptors prevents the predictions of new nanoparticles before chemical synthesis (Bigdeli et al., 2016; Walkey et al., 2014). Recently, we reported a series of studies to develop computational models for nanoparticles using virtual nanoparticle library and novel nanodescriptors based on surface chemistry simulations (Wang et al., 2019, 2017; Yan et al., 2019). In this study, this modeling strategy was applied to model the PM2.5 library and the resulted models were used to evaluate PM2.5 toxicity. Using various artificial intelligence approaches, quantitative nanostructure-activity relationship (QNAR) models were developed for the model PM2.5-induced toxicity. The predicted toxicity showed high correlations to experimental results, indicating the applicability of this universal predictive modeling approach to predict and analyze the potential toxicity of model PM2.5.
2. Materials and methods
2.1. Preparation and characterization of PM2.5 samples and model PM2.5 library
Components of PM2.5 contained silica, carbon, organic and inorganic compounds, and even biological pollutants. The whole PM2.5 particle was separated into water-soluble and water-insoluble components when the particle was partially dissolved in biological medium. Previous studies have shown that carbon particles, which were formed from PM2.5 particles, represented the insoluble components of PM2.5 (Cheng et al., 2010; Fawole et al., 2016). In our previous studies, it was shown that the cytotoxicity and inflammation can be caused by insoluble parts of PM2.5 (Jia et al., 2019; Pan et al., 2019). Therefore, a model PM2.5 particle library was synthesized to mimic the insoluble PM2.5 particles that absorbed pollutants. The model PM2.5 particle can also be used to explore the toxicity mechanism induced by PM2.5 particles. The detailed procedure of model PM2.5 library syntheses has been reported in our previous studies (Jia et al., 2019; Pan et al., 2019). In brief, carbon nanoparticles (Beijing DK Nano technology Co., LTD, China) with toxic pollutants were used to simulate the insoluble part of PM2.5 samples. The PM2.5 samples (PM2.5-JN) were collected from the city of Jinan, China, which were daily sampled by a high volume ambient particulate sampler (Tianhong Instruments, TH-150CIII, Wuhan, China) at a air flow rate of 100 L/min. The 20 carbon nanoparticles were synthesized by different combinations of four toxic pollutants (i.e., Cr2O72−, Pb2+, As2O3 and BaP), which were some of the most toxic components of PM2.5 particles. Inductively coupled plasma mass spectrometry (ICP-MS, Agolent 7700, Santa Clara CA, USA) was used to analyze the mass of Cr and Pb on PM2.5-JN and model PM2.5 particles, while atomic fluorescence spectrometer (AFS-933, Beijing, China) and liquid chromatography-mass spectrometry (LCMS-2010EV, Kyoto, Japan) were respectively used to detect the mass of As and BaP/PAHs (polycyclic aromatic hydrocarbons). The loadings of these pollutants on model PM2.5 particles were carefully controlled to simulate their actual environmental concentrations of PM2.5-JN, i.e. Cr (VI): 0.14%, Pb2+: 0.55%, As(III): 0.071% and PAHs: 0.11%. After sonication, the PM2.5-JN was resuspended as nano-sized particles, the TEM (transmission electron microscopy; JEM-1011, JEOL, Tokyo, Japan) morphology analysis of PM2.5-JN and model PM2.5 particles indicated similar sizes with diameters of around 40 nm. A laser particle size analyzer (Malvern Nano ZS, Malvern, UK) was used to measure the hydrodynamic diameters and zeta potentials of PM2.5-JN and model PM2.5 particles (75 μg ml−1) in ultrapure water (18.2 MΩ) or minimum essential medium (MEM) (Genom, Hangzhou, China) supplemented with 10% fetal bovine serum. The hydrodynamic diameters and zeta potentials of 20 model PM2.5 particles were similar with those of PM2.5-JN, detailed information can be seen in the supplementary material (Table S1).
2.2. Inflammatory response datasets
The inflammatory response datasets were obtained from one of our recent studies (Pan et al., 2019). This dataset contained 20 carbon nanoparticles tested for four different inflammatory responses in 16HBE cells, which were evaluated by transcription (mRNA) levels and protein levels of interleukin-6 (IL-6) and interleukin-8 (IL-8) genes. Quantitative real-time polymerase chain reaction (qRT-PCR) was carried out to determine the relative mRNA levels of IL-6 and IL-8 genes. The IL-6 and IL-8 protein levels in cell culture supernatants were quantified by commercially available human uncoated ELISA kits. The output values are the relative transcription levels/expression levels (pg ml−1) of IL-6, IL-8 genes/proteins in 16HBE cells after incubating cells with various particles (75 μg ml−1) for 48 hours. The activities of these 20 carbon nanoparticles ranged from 1.00 to 13.76 (IL-6 genes), 13.36 to 52.59 pg ml−1 (IL-6 proteins), 0.79 to 9.42 (IL-8 genes) and 33.94 to 383.00 pg ml−1 (IL-8 proteins) in these four assays. A higher value indicated a higher inflammatory response induced by model PM2.5 particles.
2.3. Cytotoxicity assessment
In order to explore the cytotoxicity induced by the model PM2.5 particles, a series of gradient concentration of particles, were added to 16HBE cells to yield various dose-response (cell viability) curves. At first, 16HBE cells were cultured in MEM (Genom, Hangzhou, China) supplemented with 10% fetal bovine serum (Sijiqing, Hangzhou, China), 1% penicillin-streptomycin antibiotics (Sigma-Aldrich, St. Lous, Mo) at 37 °C with 5% CO2. Cells in the logarithmic phase were collected and seeded in 96-well plates with the density of 9000 cells per well. After 24 hours incubation, cells were exposed to cell culture medium containing model PM2.5 particles at different concentrations, i.e. 12.5, 25, 50, 100, 200 and 400 μg ml−1 for 48 hours. Cell viability was determined using a CellTiter-Lumi Luminescent Cell Viability Assay Kit according to the manufacture’s protocol (Beytotime Institute of Biotechnology, Shanghai, China).
2.4. Construction of virtual carbon nanoparticle library
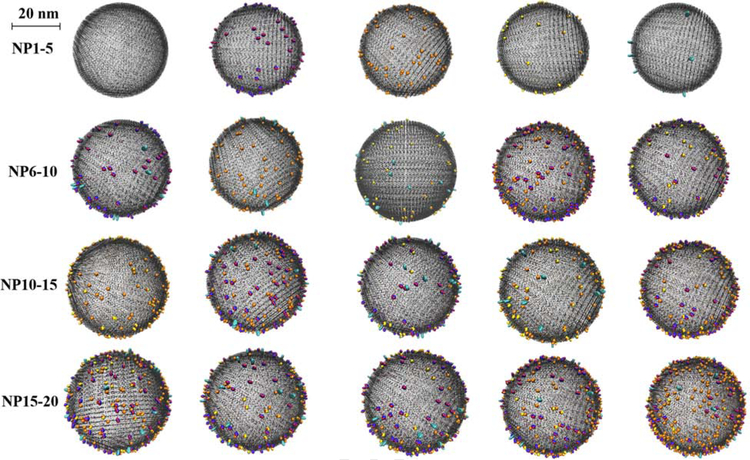
The virtual carbon nanoparticles were generated using an in-house program (coded in python 3.5), which was developed to generate virtual gold nanoparticles (GNPs) in our previous publications (Wang et al., 2019, 2017; Yan et al., 2019). Briefly, carbon atoms were first put together to form a sphere core based on the particle size information for each carbon nanoparticle. Then the associated surface pollution components (BaP, Cr2O72−, As2O3 and Pb2+) with component density information, were randomly placed on the core surface. The constructed virtual carbon nanoparticles were saved as Protein Data Bank (PDB) files. The PDB files were imported into visual molecular dynamics (VMD) for visualization (Humphrey et al., 1996), in which the core was set as lines drawing method and the atoms of surface components were set as vdw drawing method (Fig. 1).
Fig. 1.
The virtual carbon nanoparticle library. The core of the nanoparticle is represented in black and Cr, O, Pb, As and C atoms are represented in blue, red, orange, yellow and cyan.
2.5. Nanodescriptors generation
Nanodescriptors were calculated based on the virtual carbon nanoparticles, which were generated in the above step. First, all atoms of the virtual carbon nanoparticles were classified in six categories: Cx (Carbon atoms of the core), C (Carbon atoms of BaP), O (Oxygen atoms), Cr (Chromium atoms), As (Arsenic atoms), Pb (Lead atoms). Here, in order to explore whether the effects of carbon atoms came from core or BaP, two different symbols (e.g., Cx and C) were assigned to carbon atoms. Then, based on Delaunay tessellation, every four nearest neighboring atoms (e.g., CxCxCxCx and PbPbCC) that can form a tetrahedron were identified from the virtual nanoparticle structure. Based on our definition of atom types, there were total of 126 nanodescriptors without taking into account of their atom order (e.g., PbPbCC was considered to be same as CCPbPb) that were defined for all virtual carbon nanoparticles. The value of each nanodescriptor was calculated as the sum of electronegativity values of the four atoms within the tetrahedron. For example, the value of the PbPbCC nanodescriptor was the sum of two lead atom electronegativity values and two carbon atom electronegativity values. Here, based on the periodic table of electronegativity by Pauling scale, various values were assigned to Cx (2.55), C (2.55), O (3.44), Cr (1.66), As (2.18) and Pb (2.33), respectively. Accordingly, the value of a nanodescriptor for each virtual carbon nanoparticle was calculated as the value of each tetrahedron electronegativity multiplied by its occurrences in the virtual carbon nanostructure, the results of calculated nanodescriptors for all carbon nanoparticles were shown in the supplementary material (Table S2).
2.6. Development of QNAR models
The QNAR models were developed using two different machine learning algorithms: k-nearest neighbor (kNN) and random forest (RF). The kNN method uses weighted average of nearest neighbors as its prediction and employs variable selection procedure to define neighbors (Zheng and Tropsha, 2000). It was developed using in-house program implementation, also available at chembench.mml.unc.edu (Walker et al., 2010). RF predictor consists of many decision trees and produces a prediction that combine the outputs from individual trees (Breiman, 2001). The RF algorithm provided as a standard statistics package in R version 3.1.1, was used in this study (Dalgaard, 2008). An extra consensus QNAR model was then generated by averaging predictions of the two individual models, which have been reported in our previous studies (Kim et al., 2016; Wang et al., 2015).
Since the dataset used in this study was small, all models were validated using a leave-one-out (LOO) validation procedure. Briefly, a single nanoparticle was selected from the original dataset for prediction and the remaining 19 nanoparticles as the training set. The QNAR models were developed using the training set and the resulted models were used to predict the excluded nanoparticle. The whole procedure was repeated 20 times till every nanoparticle in the dataset was used for prediction purpose one time.
3. Results and discussion
3.1. Cytotoxicity responses of the model PM2.5 particle library
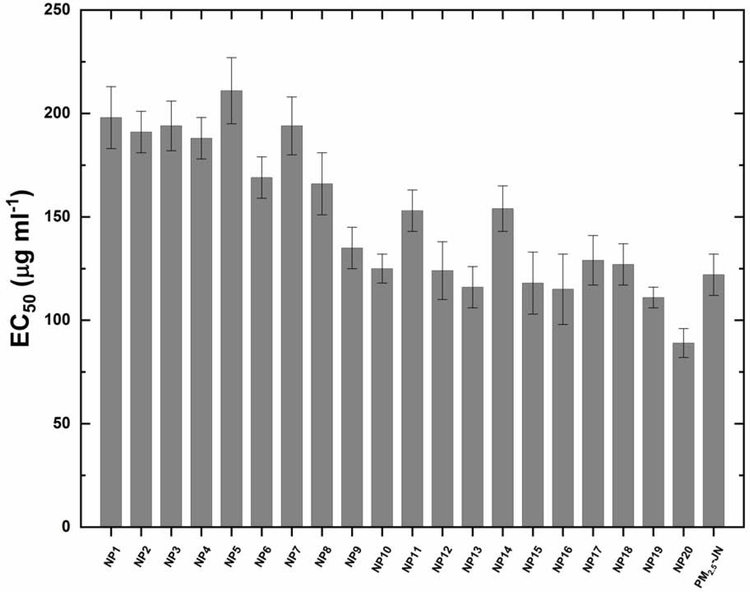
The EC50 value referred to the concentration of a model PM2.5 particle that induced half cell death. These EC50 values of the model PM2.5 particles and PM2.5-JN to 16HBE cells, were calculated from dose-response curves. These curves plotted the relationships between various concentrations of model PM2.5 particles added and its cytotoxicity. It can be seen that almost all the EC50 values were at the same order of magnitude, i.e. ~100 μg ml−1 to 200 μg ml−1 (Fig. 2). Meanwhile, the cytotoxicity of model PM2.5 particles was affected by the amount of pollutants loaded, while NP 20 containing all four toxic pollutants showed highest cytotoxicity with a lowest EC50 value of 89 μg ml−1. Similar to cytotoxicity, the inflammatory responses induced by NP 20 were also the highest, i.e. 13.76, 52.59 pg ml−1, 9.42 and 383 pg ml−1 in the four inflammatory response sets. The PM2.5 sample was also tested using the same protocol and obtained comparable toxicity results, indicating the suitability of model PM2.5 particles to simulate the actual PM2.5 in toxicity testing and evaluations (Pan et al., 2019). In several previous studies, the insoluble components of the PM2.5 particles were also proven to be the cause of the cytotoxicity and inflammatory responses. For example, the municipal solid waste incineration consisting of higher contents of heavy metals induced cell injuries, as indicated by the viability, ROS generation and DNA damage (Shang et al., 2019). The levels of IL-12 p70 and TNF-α, which indicated the inflammatory responses, after exposure to insoluble PM2.5 were significant higher than that in water-soluble PM2.5 and fat-soluble PM2.5 (Zhu et al., 2019).
Fig. 2.
Dose-dependent effects of model PM2.5 particles and PM2.5-JN (PM2.5 particles collected from the city of Jinan, China) induced cytotoxicity. 16HBE cells were exposed to model PM2.5 particles for 48 hours at various concentrations. EC50 values were calculated using SigmaPlot software (Systat Software Inc., San Jose, USA). Data were shown as mean ± s.d. (n = 3).
3.2. Nanostructure diversity analysis
On the basis of the calculated nanodescriptors of the virtual carbon nanoparticles, the structural diversity of the 20 model nanoparticles can be analyzed, which was caused by the different coating of pollution components on the nanoparticle surface. The chemical spaces of the 20 NPs were identified by performing a principal component analysis (PCA) using the 126 calculated nanodescriptors, as described above. The top three principal components can be used to represent the distribution of these NPs, which accounted for 64% of the variance of all descriptors. (Fig. 3). It can be seen that the 20 model PM2.5 nanoparticles were structurally different due to various surface components and components density. Furthermore, there was one clear structural outlier (NP 20). NP 20 was considered as an outlier due to its high content of Pb2+, which resulted in high values of all Pb-related descriptors, such as PbPbCxCx and PbPbCxO. Therefore, the high values of these descriptors, which were different compared to the other 19 nanoparticles, made NP 20 a structure outlier in the current dataset.
Fig. 3.
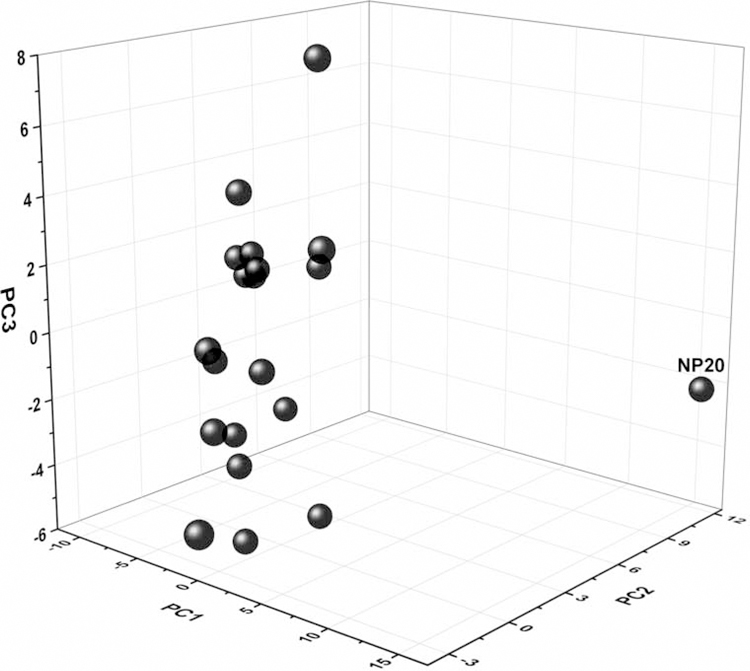
Principal component analysis (PCA) of 20 virtual carbon nanoparticles.
3.3. Predictive QNAR models for inflammatory responses and cytotoxicity
Two individual models were developed using kNN and RF for each modeling set and an extra consensus model was made by averaging the predictions from these two models. The performance of the models was represented by the LOO validation results (Table 1). For all four inflammatory response datasets and one cytotoxicity dataset, both kNN and RF models had correlation coefficients (R2) over 0.5. The mean absolute error (MAE) values of kNN (RF) models were 1.24 (1.50), 3.35 (4.39), 1.03 (0.93), 40.53 (41.51) and 13.79 (12.68) in five datasets, respectively (Table 1). The kNN model had a superior result for the IL-6 (protein) set while the RF model showed better predictability for the IL-8 (mRNA) set. As for the IL-6 (mRNA), IL-8 (protein) and EC50 sets, the kNN and RF models had equivalent predictive performance. Furthermore, the consensus models were normally superior to individual models not only because the consensus predictions were close to the top performance of individual models but also without making arbitrary model selections.
Table 1.
Correlation coefficients (R2) and mean absolute error (MAE) of kNN, RF and consensus modeling results in the five sets.
| Inflammatory response | kNN | RF | Consensus |
|---|---|---|---|
| IL-6 (mRNA) | 0.71 (1.24)a | 0.69 (1.50) | 0.73 (1.24) |
| IL-6 (protein) | 0.70 (3.35) | 0.58 (4.39) | 0.69 (3.52) |
| IL-8 (mRNA) | 0.67 (1.03) | 0.76 (0.93) | 0.76 (0.91) |
| IL-8 (protein) | 0.63 (40.53) | 0.62 (41.51) | 0.65 (38.59) |
| EC50 | 0.73 (13.79) | 0.77 (12.68) | 0.76 (13.01) |
Values in brackets are MAE of the modeling results.
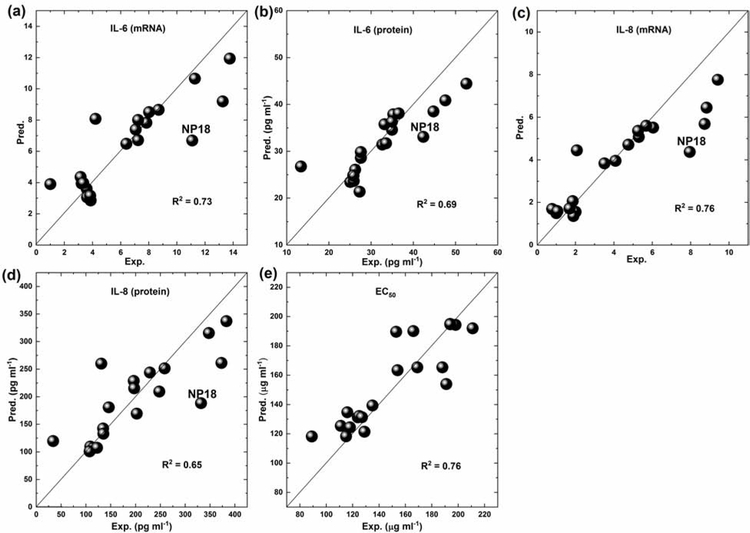
Compared to individual models, the consensus model was more stable and reliable when predicting new compounds or nanomaterials based on our previous study (Solimeo et al., 2012). The correlations between experimental and predicted values of consensus models for the whole model PM2.5 set can be viewed (Fig. 4). Although most carbon nanoparticles were correctly predicted, few predictive outliers can be noticed. For example, NP 18 was predicted as an outlier in the four datasets, which induced high inflammatory responses with the values of 11.09, 42.37 pg ml−1, 7.95 and 332 pg ml−1 (Table S1). Its structure nearest neighbor NP 17 induced relatively lower inflammatory responses with the values of 4.21, 27.59 pg ml−1, 2.07 and 131.06 pg ml−1 (Table S1). The structural difference between NP 17 and NP 18 was mainly due to the small different amounts of Pb2+, i.e. 0.44% for NP 18 and 0.28% for NP17 (Table S1). Although NP 17 and NP 18 can be distinguished by the calculated nanodescriptors (Fig. 3), the two model PM2.5 particles were still predicted as nearest neighbors due to their structural similarity. This issue was mainly due to the lack of enough model PM2.5 particles that consisted of gradually changed Pb2+ on the surface. Our modeling results indicated that Pb2+ was the most important structural feature to affect the model PM2.5 inflammatory responses (see the next section for details) and more model PM2.5 particles with Pb2+ variety should be tested in the future.
Fig. 4.
Experimental (Exp.) vs Predicted (Pred.) diagram for developed consensus models using leave-one-out (LOO) validation in (a) IL-6 (mRNA) (b) IL-6 (protein) (c) IL-8 (mRNA) (d) IL-8 (protein) (e) EC50 sets. Correlation coefficients (R2) from consensus modeling results are also shown.
3.4. Mechanism analysis of model PM2.5-induced inflammatory responses and cytotoxicity
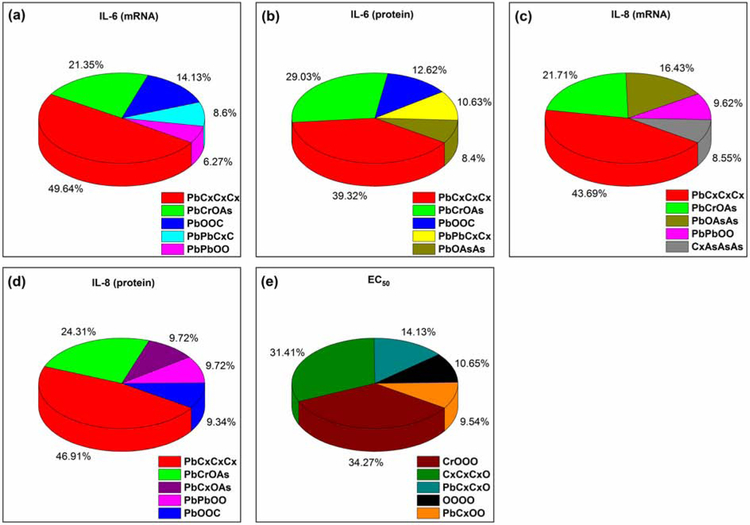
The entire model PM2.5 library and PM2.5 had similar physicochemical properties, such as hydrodynamic sizes and electrodynamic/electrostatic properties (zeta potential) in water and cell culture medium (Pan et al., 2019). Furthermore, the toxicity of carbon nanoparticles was proportional to the number of pollutants loaded. For example, the inflammatory response values of NP 20 were close to the data obtained from actual PM2.5 sample (Table S1). Therefore, the model PM2.5 particle library and the resulted computational models can be used to explore the key pollution components of PM2.5 and reveal the underlying mechanisms of PM2.5-induced toxicity. The analysis of the resulted QNAR models allowed us to identify structural features responsible for model PM2.5-induced inflammatory responses and cytotoxicity, which can be used to illustrate potential mechanisms of PM2.5-induced toxicity. The top five ranking nanodescriptors were obtained from the results of all accepted kNN models (Fig. 5). The high frequency of a descriptor in the resulted model indicated its critical contribution to the associated toxicity. It can be seen that the calculated nanodescriptor PbCxCxCx was ranked the highest for all the four inflammatory response modeling sets, indicating the Pb2+ contributed significantly to model PM2.5-induced inflammatory responses, which was consistent to our hypothesis in previous experiments (Pan et al., 2019). As for the EC50 modeling set, the calculated nanodescriptor CrOOO was ranked the highest, which indicated that Cr(VI) contributed significantly to model PM2.5-induced cytotoxicity to 16HBE cells. In one of our previous studies, we identified that co-existence of Cr(VI) and Pb2+ components contributed to the model PM2.5-induced cytotoxicity in A549 cells (Jia et al., 2019). It indicated that different toxic components of PM2.5 could induce different potential toxicity. For example, the researchers found that the genotoxic effect was related to the PAHs content while the extent of the oxidative damage may be related to the concentration of the metals, such as pro-oxidant transition metals, Ni and Zn.
Fig. 5.
Contributions of top five important nanodescriptors from kNN modeling results in (a) IL-6 (mRNA) (b) IL-6 (protein) (c) IL-8 (mRNA) (d) IL-8 (protein) (e) EC50 sets.
3.5. Pitfalls and perspectives
The applicability of QNAR strategy was previously limited to the nanomaterial modeling studies. The virtual nanoparticle library was presented in our recent studies for GNPs and new nanodescriptors were developed as universal tool to quantitatively represent nanostructures (Wang et al., 2017; Yan et al., 2019). In this study, these new modeling approaches were first used to model PM2.5 toxicity and showed promising results. However, compared to the modeling studies of various toxicity endpoints of small molecules (Kim et al., 2016; Russo et al., 2019; Solimeo et al., 2012; Zhang et al., 2014), the resulted QNAR models in this study still suffered from limited training data. Some predictive errors (e.g., NP 18) still existed due to the lacking of similar nanoparticles in the current dataset. In the future, more model PM2.5 particles should be synthesized and tested against the same assays to broaden the applicability of the current model. For example, model PM2.5 particles that consist of 1) various numbers of Pb2+ on the surface; 2) more toxic pollutants (e.g., Al3+ and Cd2+) on the surface; and 3) silica nano cores to mimic PM2.5 in the dust should be synthesized and tested.
4. Conclusion
Our studies have shown that the reductionism hypothesis and model PM2.5 library approach help identify the key toxic components of PM2.5 and pave an avenue toward further evaluation of the potential mechanisms of PM2.5-induced toxicity. To overcome the limitation of resources for exhaustive experimentation, the combination of virtual carbon nanoparticles library and various machine learning approaches can develop a unique framework to predict model PM2.5-induced toxicity based on high quality data from model PM2.5 library. The novel method developed in this study serves as a useful tool for elucidating the PM2.5-induced toxicity mechanisms by identifying the relationships between surface pollution components of model PM2.5 and the resulting inflammatory responses/cytotoxicity. Predictive ability of all models was assessed by R2 and MAE using LOO validation, the relatively higher R2 values and lower MAE values indicated high predictability of the resulted models. Based on the success of this research, we foresee an increasing trend of computational modeling driven by machine learning approaches and virtual structure simulations to complement traditional trial-and-error experimental studies.
Supplementary Material
Highlights.
Virtual carbon nanoparticles were constructed based on experimental data.
Novel nanodescriptors were generated for computational modeling.
Pb- and Cr- related nano surface structures were mainly responsible for toxicity.
Acknowledgements
H. Z. was partially supported by the National Institute of Environmental Health Sciences (grant number R15ES023148), the Colgate-Palmolive Grant for Alternative Research, and the Johns Hopkins Center for Alternatives to Animal Testing (CAAT) grant. This work was also supported by the National Key R&D Program of China (2016YFA0203103), the National Natural Science Foundation of China (91543204 and 91643204), and the Strategic Priority Research Program of the Chinese Academy of Sciences (XDB14030401).
Footnotes
Publisher's Disclaimer: This is a PDF file of an unedited manuscript that has been accepted for publication. As a service to our customers we are providing this early version of the manuscript. The manuscript will undergo copyediting, typesetting, and review of the resulting proof before it is published in its final form. Please note that during the production process errors may be discovered which could affect the content, and all legal disclaimers that apply to the journal pertain.
ASSOCIATED CONTENTS
Supporting information
Chemical compositions, physicochemical properties, inflammatory response values (Table S1) of 20 model PM2.5 particles and PM2.5-JN, the descriptor matrix (Table S2) calculated for all model PM2.5 particles.
The authors declare no competing financial interest.
References
- Apte JS, Brauer M, Cohen AJ, Ezzati M, Pope CA, 2018. Ambient PM2.5 Reduces Global and Regional Life Expectancy. Environ. Sci. Technol. Lett 5, 546–551. 10.1021/acs.estlett.8b00360 [DOI] [Google Scholar]
- Bigdeli A, Palchetti S, Pozzi D, Hormozi-Nezhad MR, Baldelli Bombelli F, Caracciolo G, Mahmoudi M, 2016. Exploring Cellular Interactions of Liposomes Using Protein Corona Fingerprints and Physicochemical Properties. ACS Nano 10, 3723–3737. 10.1021/acsnano.6b00261 [DOI] [PubMed] [Google Scholar]
- Breiman L, 2001. Random forests. Mach. Learn 45, 5–32. 10.1023/A:1010933404324 [DOI] [Google Scholar]
- Cai P, Zhang X, Wang M, Wu YL, Chen X, 2018. Combinatorial Nano-Bio Interfaces. ACS Nano 12, 5078–5084. 10.1021/acsnano.8b03285 [DOI] [PubMed] [Google Scholar]
- Cheng Y, Lee SC, Ho KF, Chow JC, Watson JG, Louie PKK, Cao JJ, Hai X, 2010. Chemically-speciated on-road PM2.5 motor vehicle emission factors in Hong Kong. Sci. Total Environ 408, 1621–1627. 10.1016/j.scitotenv.2009.11.061 [DOI] [PubMed] [Google Scholar]
- Dalgaard P, 2008. Introductory Statistics with R. Statistics (Ber) 15, 380 10.1007/978-0-387-79054-1 [DOI] [Google Scholar]
- Dominici F, Samet JM, Bell ML, Ebisu K, Zeger SL, 2007. Spatial and Temporal Variation in PM 2.5 Chemical Composition in the United States for Health Effects Studies. Environ. Health Perspect 115, 989–995. 10.1289/ehp.9621 [DOI] [PMC free article] [PubMed] [Google Scholar]
- Fawole OG, Cai XM, Mackenzie AR, 2016. Gas flaring and resultant air pollution: A review focusing on black carbon. Environ. Pollut 216, 182–197. 10.1016/j.envpol.2016.05.075 [DOI] [PubMed] [Google Scholar]
- Fourches D, Pu D, Tassa C, Weissleder R, Shaw SY, Mumper RJ, Tropsha A, 2010. Quantitative nanostructure-Activity relationship modeling. ACS Nano 4, 5703–5712. 10.1021/nn1013484 [DOI] [PMC free article] [PubMed] [Google Scholar]
- He M, Ichinose T, Yoshida S, Ito T, He C, Yoshida Y, Arashidani K, Takano H, Sun G, Shibamoto T, 2017. PM2.5-induced lung inflammation in mice: Differences of inflammatory response in macrophages and type II alveolar cells. J. Appl. Toxicol 37, 1203–1218. 10.1002/jat.3482 [DOI] [PubMed] [Google Scholar]
- Humphrey W, Dalke A, Schulten K, 1996. VMD: Visual molecular dynamics. J. Mol. Graph 14, 33–38. 10.1016/0263-7855(96)00018-5 [DOI] [PubMed] [Google Scholar]
- Jia J, Yuan X, Peng X, Yan B, 2019. Cr(VI)/Pb2+ are responsible for PM2.5-induced cytotoxicity in A549 cells while pulmonary surfactant alleviates such toxicity. Ecotoxicol. Environ. Saf 172, 152–158. 10.1016/j.ecoenv.2019.01.073 [DOI] [PubMed] [Google Scholar]
- Jia Y-Y, Wang Q, Liu T, 2017. Toxicity Research of PM2.5 Compositions In Vitro. Int. J. Environ. Res. Public Health 14 10.3390/ijerph14030232 [DOI] [PMC free article] [PubMed] [Google Scholar]
- Jiang Y, Huo S, Mizuhara T, Das R, Lee YW, Hou S, Moyano DF, Duncan B, Liang XJ, Rotello VM, 2015. The Interplay of Size and Surface Functionality on the Cellular Uptake of Sub-10 nm Gold Nanoparticles. ACS Nano 9, 9986–9993. 10.1021/acsnano.5b03521 [DOI] [PMC free article] [PubMed] [Google Scholar]
- Kim KH, Kabir E, Kabir S, 2015. A review on the human health impact of airborne particulate matter. Environ. Int 74, 136–143. 10.1016/j.envint.2014.10.005 [DOI] [PubMed] [Google Scholar]
- Kim MT, Huang R, Sedykh A, Wang W, Xia M, Zhu H, 2016. Mechanism profiling of hepatotoxicity caused by oxidative stress using antioxidant response element reporter gene assay models and big data. Environ. Health Perspect 124, 634–641. 10.1289/ehp.1509763 [DOI] [PMC free article] [PubMed] [Google Scholar]
- Li S, Zhai S, Liu Y, Zhou H, Wu J, Jiao Q, Zhang B, Zhu H, Yan B, 2015. Experimental modulation and computational model of nano-hydrophobicity. Biomaterials 52, 312–317. 10.1016/j.biomaterials.2015.02.043 [DOI] [PMC free article] [PubMed] [Google Scholar]
- Liu Y, Su G, Wang F, Jia J, Li S, Zhao L, Shi Y, Cai Y, Zhu H, Zhao B, Jiang G, Zhou H, Yan B, 2017. Elucidation of the Molecular Determinants for Optimal Perfluorooctanesulfonate Adsorption Using a Combinatorial Nanoparticle Library Approach. Environ. Sci. Technol 51, 7120–7127. 10.1021/acs.est.7b01635 [DOI] [PMC free article] [PubMed] [Google Scholar]
- Pan X, Yuan X, Li X, Gao S, Sun H, Zhou H, Hou L, Peng X, Jiang Y, Yan B, 2019. Induction of Inflammatory Responses in Human Bronchial Epithelial Cells by Pb 2+ -Containing Model PM 2.5 Particles via Downregulation of a Novel Long Noncoding RNA lnc-PCK1–2:1. Environ. Sci. Technol 53, 4566–4578. 10.1021/acs.est.8b06916 [DOI] [PubMed] [Google Scholar]
- Pui DYH, Chen SC, Zuo Z, 2014. PM2.5 in China: Measurements, sources, visibility and health effects, and mitigation. Particuology 13, 1–26. 10.1016/j.partic.2013.11.001 [DOI] [Google Scholar]
- Russo DP, Strickland J, Karmaus AL, Wang W, Shende S, Hartung T, Aleksunes LM, Zhu H, 2019. Nonanimal models for acute toxicity evaluations: Applying data-driven profiling and read-across. Environ. Health Perspect 127, 3614 10.1289/EHP3614 [DOI] [PMC free article] [PubMed] [Google Scholar]
- S., F., D., G., F., L., F., Z., X., W., 2016. The health effects of ambient PM2.5 and potential mechanisms. Ecotoxicol. Environ. Saf 128, 67–74. 10.1016/j.ecoenv.2016.01.030 [DOI] [PubMed] [Google Scholar]
- Shang Y, Wu M, Zhou J, Zhang X, Zhong Y, An J, Qian G, 2019. Cytotoxicity comparison between fine particles emitted from the combustion of municipal solid waste and biomass. J. Hazard. Mater 367, 316–324. 10.1016/j.jhazmat.2018.12.065 [DOI] [PubMed] [Google Scholar]
- Solimeo R, Zhang J, Kim M, Sedykh A, Zhu H, 2012. Predicting chemical ocular toxicity using a combinatorial QSAR approach. Chem. Res. Toxicol 25, 2763–2769. 10.1021/tx300393v [DOI] [PMC free article] [PubMed] [Google Scholar]
- Szigeti T, Dunster C, Cattaneo A, Cavallo D, Spinazzè A, Saraga DE, Sakellaris IA, de Kluizenaar Y, Cornelissen EJM, Hänninen O, Peltonen M, Calzolai G, Lucarelli F, Mandin C, Bartzis JG, Záray G, Kelly FJ, 2016. Oxidative potential and chemical composition of PM2.5in office buildings across Europe-The OFFICAIR study. Environ. Int 92–93, 324–333. 10.1016/j.envint.2016.04.015 [DOI] [PubMed] [Google Scholar]
- Tantra R, Oksel C, Puzyn T, Wang J, Robinson KN, Wang XZ, Ma CY, Wilkins T, 2015. Nano(Q)SAR: Challenges, pitfalls and perspectives. Nanotoxicology 9, 636–642. 10.3109/17435390.2014.952698 [DOI] [PubMed] [Google Scholar]
- Walker T, Grulke CM, Pozefsky D, Tropsha A, 2010. Chembench: A cheminformatics workbench. Bioinformatics 26, 3000–3001. 10.1093/bioinformatics/btq556 [DOI] [PMC free article] [PubMed] [Google Scholar]
- Walkey CD, Olsen JB, Song F, Liu R, Guo H, Olsen DWH, Cohen Y, Emili A, Chan WCW, 2014. Protein corona fingerprinting predicts the cellular interaction of gold and silver nanoparticles. ACS Nano 8, 2439–2455. 10.1021/nn406018q [DOI] [PubMed] [Google Scholar]
- Wang W, Kim MT, Sedykh A, Zhu H, 2015. Developing Enhanced Blood-Brain Barrier Permeability Models: Integrating External Bio-Assay Data in QSAR Modeling. Pharm. Res 32, 3055–3065. 10.1007/s11095-015-1687-1 [DOI] [PMC free article] [PubMed] [Google Scholar]
- Wang W, Sedykh A, Sun H, Zhao L, Russo DP, Zhou H, Yan B, Zhu H, 2017. Predicting Nano-Bio Interactions by Integrating Nanoparticle Libraries and Quantitative Nanostructure Activity Relationship Modeling. ACS Nano 11, 12641–12649. 10.1021/acsnano.7b07093 [DOI] [PMC free article] [PubMed] [Google Scholar]
- Wang W, Yan X, Zhao L, Russo DP, Wang S, Liu Y, Sedykh A, Zhao X, Yan B, Zhu H, 2019. Universal nanohydrophobicity predictions using virtual nanoparticle library. J. Cheminform 11, 6 10.1186/s13321-019-0329-8 [DOI] [PMC free article] [PubMed] [Google Scholar]
- Winkler DA, 2016. Recent advances, and unresolved issues, in the application of computational modelling to the prediction of the biological effects of nanomaterials. Toxicol. Appl. Pharmacol 299, 96–100. 10.1016/j.taap.2015.12.016 [DOI] [PubMed] [Google Scholar]
- Yan X, Sedykh A, Wang W, Zhao X, Yan B, Zhu H, 2019. In silico profiling nanoparticles: predictive nanomodeling using universal nanodescriptors and various machine learning approaches. Nanoscale 11, 8352–8362. 10.1039/C9NR00844F [DOI] [PubMed] [Google Scholar]
- Zhang J, Hsieh JH, Zhu H, 2014. Profiling animal toxicants by automatically mining public bioassay data: A big data approach for computational toxicology. PLoS One 9 10.1371/journal.pone.0099863 [DOI] [PMC free article] [PubMed] [Google Scholar]
- Zhang Y, Wang Y, Liu A, Xu SL, Zhao B, Zhang Y, Zou H, Wang W, Zhu H, Yan B, 2016. Modulation of Carbon Nanotubes’ Perturbation to the Metabolic Activity of CYP3A4 in the Liver. Adv. Funct. Mater 26, 841–850. 10.1002/adfm.201504182 [DOI] [Google Scholar]
- Zheng W, Tropsha a, 2000. Novel variable selection quantitative structure--property relationship approach based on the k-nearest-neighbor principle. J. Chem. Inf. Comput. Sci 40, 185–94. 10.1021/ci980033m [DOI] [PubMed] [Google Scholar]
- Zhu J, Zhao Y, Gao Y, Li C, Zhou L, Qi W, Zhang Y, Ye L, 2019. Effects of different components of pm2.5on the expression levels of nf-κb family gene mrna and inflammatory molecules in human macrophage. Int. J. Environ. Res. Public Health 16 10.3390/ijerph16081408 [DOI] [PMC free article] [PubMed] [Google Scholar]
Associated Data
This section collects any data citations, data availability statements, or supplementary materials included in this article.


