Abstract
Most infants with cystic fibrosis (CF) have pancreatic exocrine insufficiency that results in nutrient malabsorption and requires oral pancreatic enzyme replacement. Newborn screening for CF has enabled earlier diagnosis, nutritional intervention, and enzyme replacement for these infants, allowing most infants with CF to achieve their weight goals by 12 months of age1. Nevertheless, most infants with CF continue to have poor linear growth during their first year of life1. Although this early linear growth failure is associated with worse long-term respiratory function and survival2,3, the determinants of stature in infants with CF have not been defined. Several characteristics of the CF gastrointestinal (GI) tract, including inflammation, maldigestion and malabsorption, could promote intestinal dysbiosis4,5. As GI microbiome activities are known to affect endocrine functions6,7, the intestinal microbiome of infants with CF might also impact growth. We identified an early, progressive fecal dysbiosis that distinguished infants with CF and low length from infants with CF and normal length. This dysbiosis included altered abundances of taxa that perform functions important for GI health, nutrient harvest, and growth hormone signaling, including decreased Bacteroidetes and increased Proteobacteria. Thus, the GI microbiota represent a potential therapeutic target to correct linear growth defects among infants with CF.
CF is caused by mutations in the CF transmembrane conductance regulator (CFTR), resulting in altered fluid and ion transport across epithelial cell membranes in multiple organs8. GI complications, including nutrient malabsorption, steatorrhea, GI obstruction, and inadequate weight and body length, are among the earliest manifestations of CF and can be life-threatening9–11. These symptoms result from exocrine pancreatic insufficiency (PI), a complication affecting roughly 85% of infants with CF that is only partially compensated by pancreatic enzyme replacement therapy. However, while early, insufficient weight gain is often attributed to nutrient malabsorption or increased metabolic demands, length for age varies among children with similar levels of CFTR dysfunction and PI, even among those with normal weight1, suggesting that unknown factors contribute to linear growth failure.
Observations from clinical studies1 and animal models12 suggest that one of the mechanisms of CF-related short stature involves CFTR-dependent growth hormone deficiencies unrelated to nutrition. In a prospective multicenter study of infants with CF (BONUS, for the Baby Observational and Nutritional Study), the study population achieved normal mean weight for age at 12 months with nutritional supplementation compared with World Health Organization (WHO) growth curves for healthy infants (mean z score difference −0.04, 95% CI −0.17 to 0.09). In contrast, the infants with CF did not achieve normal mean length at 12 months by WHO standards (mean z score difference, −0.56, 95% CI −0.70 to −0.42), indicating short CF stature despite aggressive nutritional intervention 1. Moreover, weight and length z scores negatively correlated with calories consumed, arguing against inadequate caloric intake as the cause of growth failure. Infants with low length had significantly lower serum levels of insulin-like growth factor 1 (IGF-1) than those with normal length1, similar to observations from CF animal models12.
Body length is a key determinant of lung growth; early short stature in CF is associated with subsequent growth failure, poor respiratory outcomes, and decreased survival2,3. Therefore, improving or restoring normal linear growth among infants with CF is an important goal that could improve long-term outcomes. While medications that improve CFTR function (modulators) have recently been introduced, they are initiated after infancy and have not normalized growth for all children with CF in the US12, underscoring the importance of additional strategies to combat early CF growth failure.
Several studies4,5,13,14 have reported a fecal dysbiosis among young children with CF that correlated with fecal measures of inflammation and fat. In addition to having altered nutrient content from malabsorption, the CF GI tract is characterized by impaired transit times, abnormal mucus and pH, and inflammation9–11, all of which could affect GI microbiome composition and function. Healthy GI microbiota perform functions important for growth, including nutrient harvest and production of substrates that regulate host metabolism. GI microbial metabolites also control bone and body growth by modulating growth hormones, including IGF-16. Therefore, GI microbiota could influence early CF nutritional outcomes and, in turn, overall long-term health. To investigate this possibility, we compared the fecal microbiota of infants with CF with normal and low lengths to determine the relationship between CF fecal dysbiosis and linear growth.
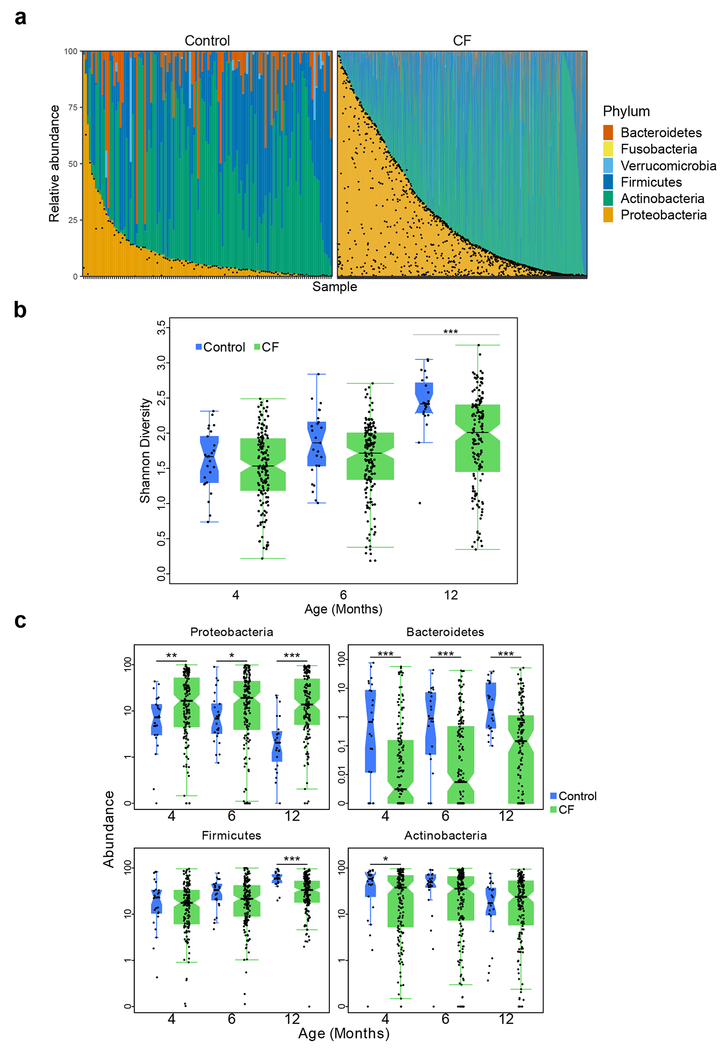
To perform this analysis, prospectively collected fecal samples from 207 infants with CF1 from the BONUS study were analyzed by sequencing (Table 1, Supplementary Tables 1–2). To provide context for understanding the relationship between age, fecal taxonomic differences, and growth among infants with CF, we first compared the fecal microbiota of BONUS infants to those of age-matched healthy infants (controls) (Table 1, Supplementary Table 3). We performed shotgun metagenomic sequencing for all samples and used metagenomic phylogenetic analysis15 to define their taxonomic compositions. Tests of association between microbial (species) beta diversity and collected clinical data were conducted using permutational multivariate analysis of variance (PERMANOVA) with a Bray distance measure, with a null hypothesis of 0% variability. Inter-participant differences explained a large amount (46%) of microbial taxonomic variation in the study population (p < 0.001), followed by age (1.7%, p < 0.001). Having CF explained 1.5, 1.8 and 5.2% of taxonomic variation at months 4, 6 and 12, respectively (Supplementary Table 4). This effect size of disease relative to inter-subject variability is similar to those identified in other pediatric fecal microbiome studies of, for example, inflammatory bowel disease and diabetes16,17. A greater effect of CF was seen in comparing phylum-level microbiota of all study samples, and in particular the overall distribution of Proteobacteria, predominantly Escherichia coli (Fig. 1a). At the earliest time points, the composition of the fecal microbiota in most participants was dominated by high relative abundance of only a few species, mainly Bifidobacterium longum, B. breve and E. coli (Extended Data Fig. 1), a finding similar to that of a recent study of healthy infants16. Alpha diversity, which was relatively low at 4 months in most participants, increased over the first year of life in all infants as expected18,19; however, the increase for infants with CF was significantly slower compared to controls (Fig. 1b).
Table 1.
Summary demographic, nutritional and clinical characteristics of participating healthy infants (controls) and infants with CF.
| Characteristic | Controls1 | Infants with CF |
|---|---|---|
| Demographic and diagnostic | ||
| Participants | 25 | 207 |
| Female (Male) | NR | 99 (108) |
| Pancreatic insufficient (sufficient) | NA | 188 (19) |
| CFTR mutations | ||
| F508del homozygous | NA | 117 |
| F508del heterozygous | NA | 76 |
| Other | NA | 13 |
| Unknown | NA | 1 |
| Nutritional2 | ||
| Any breastmilk at M043 (M12) | 174 (2) | 665 (23) |
| Any formula at M04 (M12) | 16 (5) | 123 (112) |
| Any table food at M04 (M12) | NR | 52 (151) |
| Treatments | ||
| Received antibiotics at or before M06 (M12) | 6 (9) | 98 (120) |
| Received acid suppression | ||
| PPI6 only | 0 | 31 |
| H2 blockers only | 5 | 59 |
| PPI and H2 blockers | 0 | 46 |
NA: not applicable. NR: not received.
Not mutually exclusive categories.
M04, month 4. M12, month 12.
Number of control samples with metagenomic data at M04: 25, at M12: 23.
Number of samples from children with CF with metagenomic data at M04: 156, at M12: 152.
Proton pump inhibitors.
Figure 1. Fecal microbial composition is altered in infants with CF compared to controls.
a, The microbiota of all samples at the phylum level among control infants (left) and infants with CF (right). Samples are ordered within each cohort according to the relative abundance of Proteobacteria (and then Actinobacteria for samples where relative abundance of Proteobacteria was negligible). Black dots indicate the relative abundance of E. coli in each sample. b, Boxplot of Shannon Index, with individual data, indicating slower increases in fecal microbiota diversity for infants with CF compared to controls, with significant differences at month 12. Number of samples (N), one per patient at months 4, 6 and 12: 156, 169 and 152 for infants with CF and 25, 25, and 23 for controls. c, Boxplots of Proteobacteria, Bacteroidetes, Firmicutes and Actinobacteria relative abundances at months 4, 6 and 12 for infants with CF and controls. Boxplot hinges indicate the first and third quartile, and whiskers indicate 1.5 times the IQR above and below. Indentations in each box indicate approximately the 95% confidence intervals about the median. Box width is proportional to the square root of N. One-sided Wilcoxon rank-sum test, * p < 0.05, ** p < 0.01, ***p < 0.001.
By month 4, CF infant fecal microbiota exhibited notable taxonomic differences from those of controls that were consistent with previously published studies of young children with CF4,5,13,14, most markedly in the relative abundances of Proteobacteria and Bacteroidetes. These differences were maintained or increased over time (Fig. 1c, Extended Data Figs. 2–4). Mean relative abundance of Proteobacteria over the first year declined in controls by 11.2% (p < 0.001, t-test) but did not change significantly among infants with CF (Fig. 1c). While in infants with CF the mean abundance of Proteobacteria species excluding E. coli decreased by 6.7% (p < 0.001, t-test), the abundance of E. coli increased by 6.8% (p < 0.01, t-test) (Extended Data Fig. 3). In contrast to Proteobacteria, Bacteroidetes relative abundance was significantly lower in infants with CF compared to controls at all time points (p < 0.001, t-test) (Fig. 1c). While the few studies published on the effects of gastric acid suppressors (H2 blockers and proton pump inhibitors) on the infant fecal microbiome suggest that the relative abundance of Proteobacteria, including E. coli, increases with these treatments20,21, Proteobacteria abundances remained high (and Bacteroidetes lower) in month 12 CF samples when we excluded samples from infants prescribed gastric acid suppressors (p < 0.001, one-sided Wilcoxon rank-sum test). The relative abundance of Firmicutes increased while Actinobacteria decreased in controls over the first year, as described in other healthy infant studies22; both trends were relatively attenuated in CF samples (Fig. 1c, Extended Data Fig. 4).
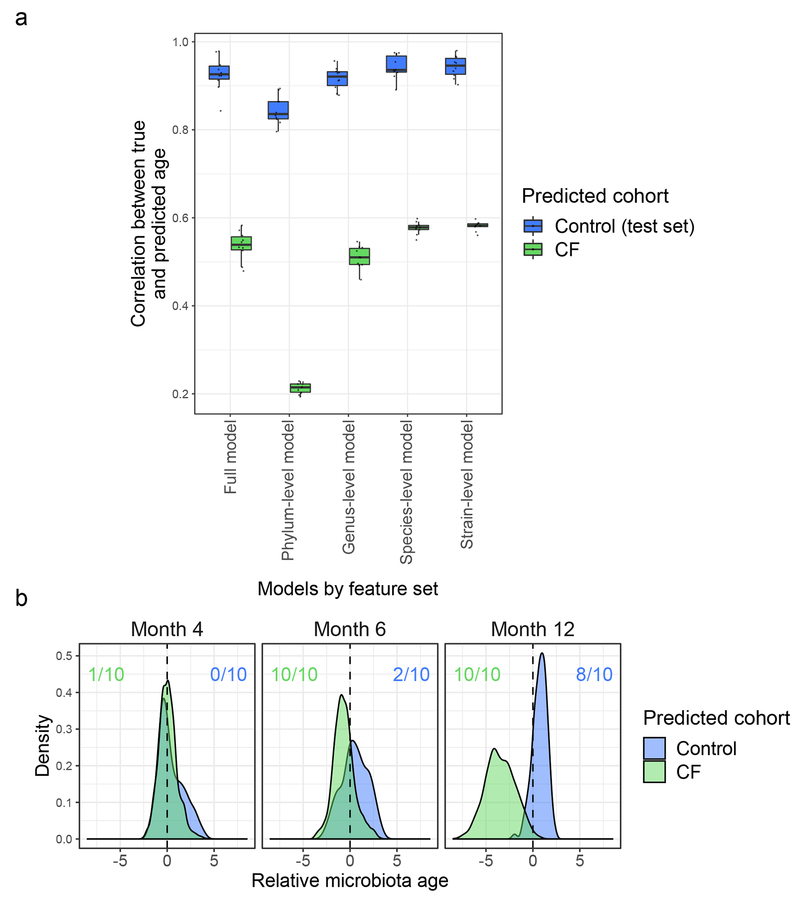
These comparisons suggested delayed maturation of CF fecal microbiota relative to controls, which we quantified with a microbiota age analysis22. Microbiota age comparisons go beyond comparisons at individual time points, which can only indirectly suggest differential development. Instead, this technique directly queries whether microbiota development appears similar in trajectory but with a lag in one cohort by considering temporal dynamics during model fitting. Again, before investigating relationships between microbiota development and growth in the infants with CF, we first applied this analysis to compare infants with and without CF. Random forest models were trained on a subset of the control samples to predict host ages based on respective fecal microbiome taxonomic profiles. The predictive power of each model was then assessed on the remaining control samples, demonstrating high correlations between true and predicted age (0.843 <= r <= 0.937 for full model replicates, Fig. 2a) across different randomly chosen training subsets and different feature sets. In contrast, when applying these control-trained models to CF samples, predicted and true host ages correlated relatively poorly (0.479 <= r <= 0.583 for full model replicates, Fig. 2a). Differences in CF and control fecal microbiota development were further quantified by comparison of their calculated relative microbiota ages. Specifically, we defined the “relative microbiota age” of a sample to be the difference between a sample’s true age and the age predicted by our microbiota age models. We then used our models trained on controls to predict the relative microbiota age of CF samples, thereby comparing them to the observed pattern of microbiota development in controls to determine whether the microbiota of CF samples appeared to be younger than their true age, which would suggest delayed development. To strengthen this comparison, we similarly examined whether control microbiota appeared older than their true age based on microbiota development patterns observed in infants with CF by predicting the microbiota age of control samples using microbiota age models trained on CF samples. CF relative microbiota age tended to be negative (significant negative shift at months 6 and 12 across all replicate models, q < 0.01, Wilcoxon signed-rank test, Fig. 2b), while control relative microbiota age tended to be positive (significant positive shift at month 12 in 8/10 replicate models, q < 0.01, Wilcoxon signed-rank test, Fig. 2b). Interestingly, most of the informative taxa for our models belonged to the phylum Firmicutes (Supplementary Table 5), similar to Subramanian et al.22, and the results of microbiota age analysis were similar when using sparse models, as well as when controlling for acid suppressors (Extended Data Fig. 5). These results indicate that infant CF fecal microbiota maturation is delayed compared to normal infants.
Figure 2. Development of the fecal microbiome in infants with CF is delayed compared to controls.
a, Performance of microbiota age models. Each box summarizes the Pearson correlations (y-axis) between true and predicted microbiota age across replicate models trained on subsets of control samples. The control correlations were calculated from subsets of withheld testing samples and the CF correlations were calculated using these control-trained models on all CF samples. Models differ by the feature set used for prediction as indicated on the x-axis: all MetaPhlAn taxonomic features, phylum-level features, genus-level features, species-level features, or strain-level features (n = 10 replicate models for each feature set). Boxplot hinges indicate the first and third quartile, and whiskers indicate 1.5 times the IQR above and below. b, Development of fecal microbiota among infants with CF is significantly delayed relative to controls. Shown are the distributions of “relative microbiota age” (x-axis), following the approach in Subramanian et al.22 for each subject group (CF or controls) as the normalized error in a sample’s predicted microbiota age when using a computational model constructed for the other group (e.g., negative relative microbiota age indicates delayed development compared to the group used to construct the model). Y-axis, density of samples that mapped to a given relative microbiota age at the indicated timepoints. Colored ratios summarize the fraction of replicate full-feature models that produced a distribution of relative microbiota ages that was significantly negatively (green for CF samples relative to control models) or positively (blue for control samples relative to CF models) different from zero (q < 0.01, one-sided Wilcoxon signed-rank test).
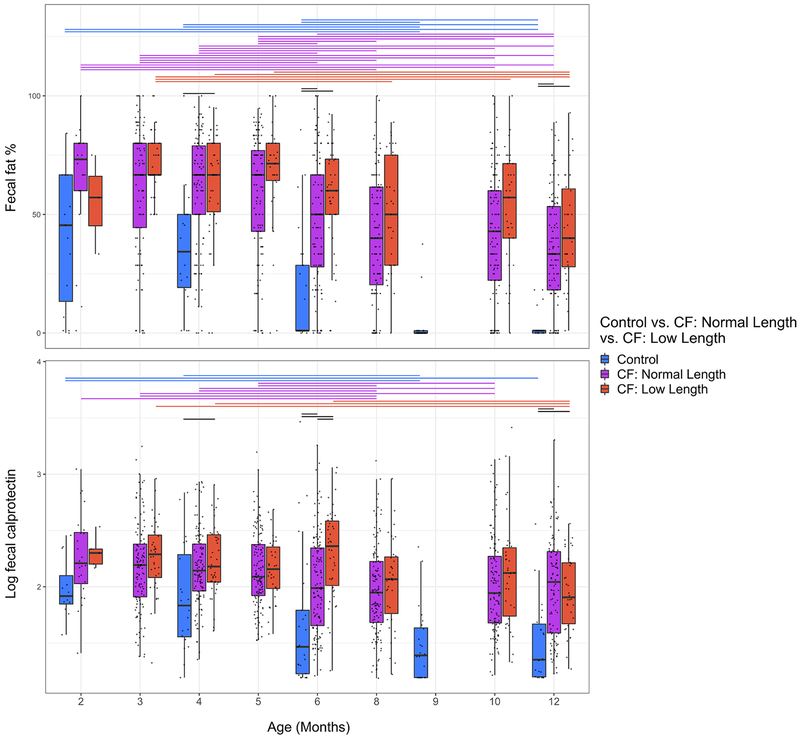
We previously demonstrated that an older cohort of children with CF had fecal dysbioses characterized by high relative abundance of Proteobacteria, including E. coli, that was associated with fecal measures of both malabsorbed fat and inflammation (calprotectin)4. The dynamics of these associations during the first year of life, and their relationships with diet, were analyzed using multivariate mixed-effect linear modeling while controlling for diet. Diet has been shown to have a major impact on infant gut microbiome development. Among factors investigated, cessation of breast-feeding is known to be the primary driver of maturation to adult-like composition18; therefore, the model dietary categorization included the presence or absence of breast milk (Supplementary Tables 2–4 and 6). Relative abundance of Enterobacteriaceae was associated (q < 0.004) with fecal fat, which was significantly higher in infants with CF compared to controls (Extended Data Fig. 6). However, while calprotectin was also higher in infants with CF compared with controls (Extended Data Fig. 6), we identified no significant relationship between fecal taxonomy and calprotectin. These results support a model in which malabsorbed nutrients such as fat, but not intestinal inflammation, drive infant CF fecal dysbiosis.
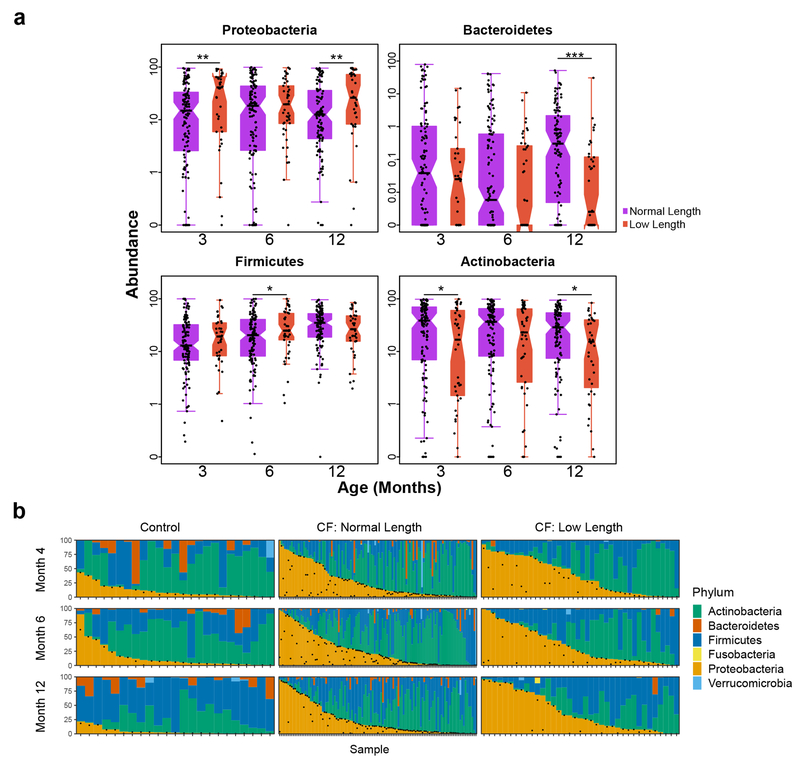
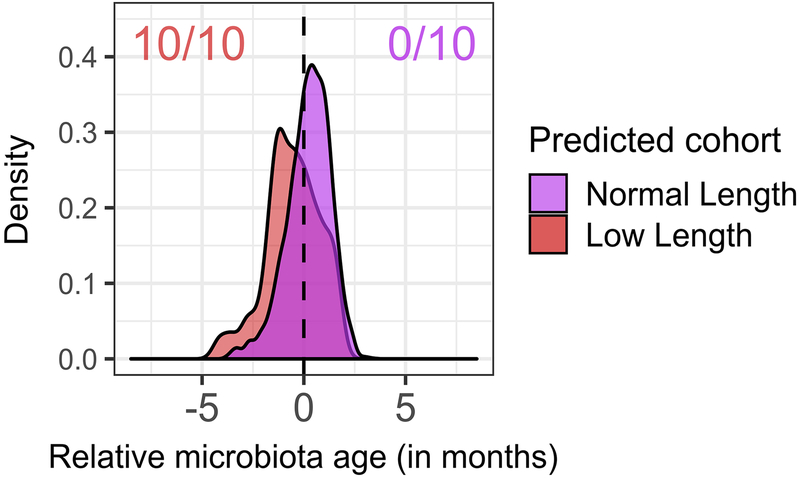
With this context, we then compared the fecal microbiota of infants with and without low length. Many taxa differentially abundant in CF fecal samples have metabolic activities that could impact linear growth. Therefore, we tested for a relationship between the magnitude of taxonomic dysbiosis and body length among infants with CF using multivariate mixed-effect linear modeling. For this analysis we controlled for diet, low weight and antibiotics. Although infants in our CF cohort had, on average, normal weights1, we excluded infants with low weight (n=25) in this analysis to further minimize any contribution of nutritional failure to low length1,23,24. Additionally, antibiotic use has been shown to affect the composition of the fecal microbiome25; treatment with these drugs was associated with a decrease in Proteobacteria (q < 0.01) and an increase in Firmicutes (q < 0.04) in our CF cohort. Infants with CF were categorized as having low or normal length or weight (Supplementary Table 1) as described previously1. For all samples over all time points, compared with normal-length infants with CF, those with low length had low relative fecal abundances of Bacteroidetes and high abundances of Proteobacteria (q < 0.02, Supplementary Table 6), and these differences were significant in pairwise comparisons at month 12 (p < 0.001 and p < 0.04, one-sided Wilcoxon rank-sum test, for Bacteroidetes and Proteobacteria, respectively, Fig. 3a), a pattern similar to that observed when comparing infants with CF and controls (Fig. 1c, Fig. 3b). Comparing the phylum-level fecal microbiota of these three infant groups illustrated that the dysbiosis was most pronounced among those with CF and low length (Fig. 3a,b, Extended Data Fig. 4) independent of diet or antibiotics (Supplementary Table 6), including not only reciprocal changes in abundances of Proteobacteria and Bacteroidetes, but also Actinobacteria and Firmicutes. Moreover, when a microbiota age analysis was applied to compare normal and low length infants with CF, we again found differences in microbiota development (Extended Data Fig. 7). Specifically, model predictions suggested significant delays in microbiota development among low length infants with CF compared to those with normal length at month 12 (significant negative shifts in low length relative microbiota age for all replicate models, q < 0.01, Wilcoxon signed-rank test). Therefore, low length was associated with delayed fecal microbiota development among infants with CF.
Figure 3. Low length infants with CF have more extreme dysbiosis than normal length infants with CF.
a, Boxplots of Proteobacteria, Bacteroidetes, Firmicutes and Actinobacteria relative fecal abundances at 3, 6 and 12 months for normal length compared to low length infants with CF. The number of samples (N) at month 3, 6 and 12 is 120, 124 and 113 for normal length and 38, 45, and 39 for low length infants. Hinges indicate the first and third quartile, and whiskers 1.5 times the IQR above and below. Indentations in each box indicate approximately the 95% confidence intervals about the median. Box width is proportional to the square root of N. One-sided Wilcoxon rank-sum test, * p < 0.05, ** p < 0.01, ***p < 0.001. b, Dynamics of the fecal microbiota of controls (left) and normal length (middle) and low length (right) infants with CF during the first year of life. Bars represent the relative abundances of bacterial phyla. Samples are ordered within each panel according to the relative abundance of Proteobacteria (and then Actinobacteria once the relative abundance of Proteobacteria is negligible). Vertically-aligned samples are not guaranteed to be from the same subject. Black dots indicate the relative abundance of E. coli in each sample.
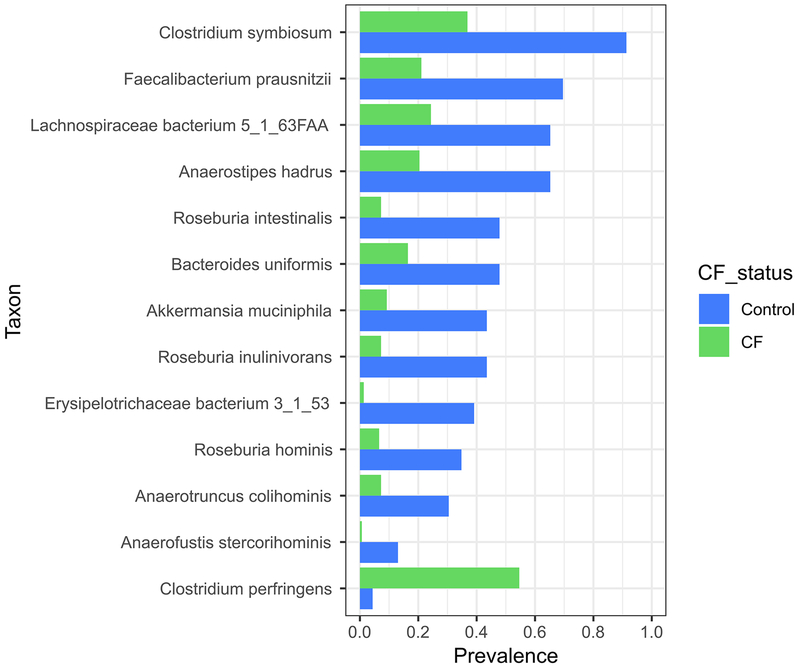
We found previously that the fecal microbiota of children with CF had altered capacities for synthesizing and degrading two short-chain fatty acids (SCFA), butyrate and propionate5. SCFA have been shown to modulate bone and body growth6,7, indicating that fecal dysbiosis could contribute to inadequate length achievement by altering their production. Unfortunately, meaningful measurements of SCFA were not possible for this study, since SCFA are volatile and require specialized sample storage conditions26, and fecal SCFA levels do not accurately reflect luminal levels due to rapid uptake by the host27–29. Therefore, to test this model, we compared the presence and abundance of taxa known or predicted to produce butyrate and propionate (Supplementary Table 7) among different groups of study participants. At month 12, of the 28 SCFA-producing species commonly found in our dataset (i.e., present in >10% samples), 20 were less prevalent in samples from infants with CF compared to controls, and of the 13 SCFA-producing species that exhibited a statistically significant difference in prevalence between CF and controls (q < 0.05; chi-squared test), 12 were significantly less prevalent in CF compared to controls (Extended Data Fig. 8). These results suggest that SCFA production by intestinal microbiota of infants with CF may be diminished compared with infants without CF, in agreement with recent findings from both metabolomic and proteomic studies suggesting lower intestinal levels of butyrate and propionate in children with CF compared to healthy controls30,31.
Our findings are consistent with the concept that the infant CF fecal dysbiosis is selected by altered nutrient content within the GI lumen. In support of this model, prior studies of patients with surgically-induced fat malabsorption and of animals fed high-fat diets demonstrated fecal enrichments of Proteobacteria and depletion of Bacteroidetes, as found here32,33. In addition, we recently showed that E. coli isolated from the fecal samples of older children with CF exhibit growth advantages in glycerol34, which forms the backbone of many dietary phospholipids abundant in the CF GI tract due to PI and malabsorption. These effects occurred despite treatment with oral pancreatic enzyme supplementations (which include lipase)1. Therefore, our results indicate that malabsorption is a recalcitrant risk factor for fecal dysbiosis and, as an apparent consequence, impaired growth, in early CF childhood. Low length among infants with CF was found previously1 to correlate with lower serum levels of IGF-family growth factors that, in a gnotobiotic mouse model, were shown to be modulated by the GI microbiota through SCFA production6,7. Therefore, fecal dysbiosis among infants with CF could affect length achievement by altering endocrine function. Unfortunately, too few study participants had paired fecal and serum samples collected in this study to test this model. Future functional metagenomic or metabolomic investigations of animal or human may identify the functions of the GI microbiota that might modulate hormone signaling and growth.
It is also possible that CFTR dysfunction directly impacts growth through non-microbial mechanisms. However, studies of early CF nutrition and growth demonstrated a wide variety of outcomes among children with the same CFTR mutation1, regardless of CFTR modulator therapy12, indicating an important role for non-CFTR influences such as the GI microbiota, which are amenable to manipulation. Therefore, therapies that either address the early fecal dysbiosis exhibited here in infants with CF, or that replenish SCFA or modulate their production (such as with prebiotics, as supported by a recent study35), could improve early growth, GI function, and long-term CF outcomes of many types. GI dysbioses can also worsen fat malabsorption and inflammation by disrupting bile acid production, contributing to growth failure36. This study identified a relationship between fecal microbiota and low length in infants with CF that suggests mechanistic hypotheses that can be tested in animal models and future interventional studies, and that could inform more effective strategies to improve the growth, and consequent long-term outcomes, in infants with CF.
Methods
CF cohort.
Fecal samples were collected from 207 of the 231 infants who participated in the Baby Observational and Nutritional Study (BONUS), a longitudinal, observational cohort study that was conducted during regularly scheduled CF clinic visits in the first year of life at 28 US Cystic Fibrosis Foundation-accredited Care Centers in the CF Foundation Therapeutic Development Network. The primary goal of BONUS was to examine incremental weight gain, linear growth and clinical features in the first year of life among infants with CF who underwent newborn screening (NBS). Detailed study design and methods, including descriptions of consent for the samples obtained and institutional review board approvals, have been previously published1. Fecal samples were collected at 3, 4, 5, 6, 8, 10 and 12 months of age (1157 total samples). Stool was uniformly collected in study-provided sterile collection cups at home within one day of each clinic visit and kept at 2-8°C until frozen at −70°C in clinic. Metadata considered in this study is detailed in Supplementary Table 1, with categories assigned to infants for analyses in Supplementary Table 2. For diet, each sample is scored as Y (yes) or N (no) for breast milk, formula and table food, Y if the participant was given that food source at any time during the month of the sample. Reporting food source intake in this binary format allowed for comparison with the control cohort, as metadata for the two cohorts was collected independently and was not equivalent. Moreover, the conclusions of Bäckhed et al.18 indicate that considering presence or absence of breast milk in the diet is a particularly conservative, evidence-based way to evaluate the effect of this diet on fecal microbiota. For antibiotic use, each sample is scored as Y or N for current or prior antibiotics, Y if the participant was given any oral or intravenous antimicrobial medications at any time during the month of the sample or during prior months.
Control cohort.
Fecal samples were collected from 25 healthy infants as part of a prospective, single center, observational cohort study to follow healthy infants not affected with CF for the first year of life. Written informed consent was obtained from all participating parents or guardians, and institutional review board approval was provided by the University of Buffalo. Fecal samples were collected at 2, 4, 6, 9 and 12 months of age (122 total samples); therefore, age matching for the two cohorts was possible for 4, 6, and 12-month time points. Stool was collected in study-provided sterile containers at home and kept at −20°C until delivered to the clinic. Although this storage protocol differs from that of the CF cohort, there is extensive literature demonstrating that storage at 4°C versus −20°C during the time period of this study generates very similar taxonomic profiles of fecal samples37–39. Control metadata was limited to that collected as part of the observational cohort study and included length and weight metrics, diet, antibiotic use, fecal calprotectin and fecal fat content (Supplementary Table 3). Diet and antibiotic use are scored similarly to the CF cohort.
Fecal DNA extraction and metagenomic sequencing.
The conduct of this ancillary study was judged to be exempt from review as human subjects research by the University of Washington institutional board. DNA extraction from fecal samples has been described previously4,40. The resulting DNA samples were stored at −80°C until sequenced. For each sample, a random-fragment library was constructed using the Nextera library protocol (Illumina, Inc.) with dual indexing and sequenced on the HiSeq 2500 platform to produce 96-bp paired-end reads. Sequencing generated an average of 29.6 million reads per sample, 97% of samples with >10 million reads. Initial FASTQ files were filtered prior to subsequent analysis. Human DNA sequence was identified and removed using KneadData 0.35 (http://huttenhower.sph.harvard.edu/kneaddata) with the Hg-19 human reference genome. Reads were filtered and trimmed for quality using Trimmomatic 0.33 (http://www.usadellab.org/cms/index.php?page=trimmomatic). Duplicate reads were removed using EstimateLibraryComplexity, part of the Picard Tools package (https://broadinstitute.github.io/picard/), and the Sequniq 0.1 Python package (https://github.com/standage/sequniq). All software packages were run using default settings.
Taxonomic profiling.
Taxonomic classification and relative species abundance of bacteria were obtained using MetaPhlAn215, which uses a database of clade-specific markers to quantify microbiota constituents at the species and higher taxonomic levels15. Species with maximum abundance of less than 0.01% across all samples were removed to minimize sampling noise. Taxonomic proportions were rescaled to sum to unity. MetaPhlAn2 was run using default settings.
Statistics.
Statistical analysis was conducted in R (v3.5.1) (https://www.R-project.org). Results were considered significant at a p value of <0.05 unless otherwise indicated. Multivariate hypotheses of the association of clinical metadata and taxonomic profiles were tested using permutational multivariate analysis of variance (PERMANOVA) implemented by adonis (105 permutations; Bray distance) in vegan v2.5-3 (https://CRAN.R-project.org/package=vegan). Multidimensional scaling (principal coordinate analysis) of taxonomic profiles using a Bray distance was performed with mmds in bios2mds v1.2.2 (https://CRAN.R-project.org/package=bios2mds ) and taxonomic factors (shown as arrows) were fitted onto an ordination using envfit in vegan. To investigate early shifts in microbial alpha diversity, we tested Shannon’s diversity index of taxonomic profiles using the function “diversity” in vegan. Hypothesis testing was conducted using either a one-sided Wilcoxon rank-sum or a t-test as indicated. P values were corrected for multiple testing using a Benjamini-Hochberg adjustment. To identify significant associations between covariates and taxa we used MaAsLin41 to model the arcsine square root transformed relative abundance using a mixed-effect linear model. In the models, participant was used as a random effect and the binary (presence/absence) variables associated with food source (breast milk and formula supplement), weight (low weight or normal weight) or antibiotic treatment (prior to and including time points) contributed as fixed effects. The continuous variables of percent fecal fat and measured calprotectin were also considered as fixed effects. Adjusted p values using Benjamini-Hochberg FDR were reported as q values and were considered significant for q < 0.05.
Microbiota age analysis.
Microbiota age was determined using an approach similar to Subramanian et al.22. To train a model, control samples were randomly subsampled to achieve the same number of samples (23) per time point. These samples were then randomly split into a training set and testing set (for model evaluation) using a 70%-30% split while guaranteeing that time points were equally represented in the training and testing sets, resulting in 80 total training samples and 35 total testing samples with 16 training samples per time point and 7 testing samples per time point within those training and testing sets. Regularized Random Forests42,43 were then fit to the training set (R package “RRF”, ntree = 10,000, all other parameters set to the default). To assess whether model performance was noticeably affected by choice of training and testing samples, this process was performed 10 times to produce 10 replicate models each trained and evaluated on different randomly selected training and testing sets. This process, including training 10 replicate models, was repeated for different feature sets including all MetaPhlAn215 taxonomic abundances (full model) or using all abundances for a specific taxonomic level (phylum-level, genus-level, species-level, and strain-level models). Models fit to CF data were trained and evaluated in a similar manner. Due to the small number of CF samples available at month 2, the number of training and testing samples were similar per time point (20 training samples, 9 testing samples per time point) though total number of training and testing samples was larger because more time points were available for CF infants (160 training samples and 72 testing samples). Acid suppression medication-controlled microbiota age models were fit using only samples from infants that were not on acid suppressors, which meant that each control model replicate was trained using 14 samples per time point (70 total) and each CF model replicate was trained using 19 samples per time point (152 total). Normal and low length CF microbiota age models were fit ignoring month 2 due to the small number of samples and the sufficient number of overlapping time points when not comparing to controls. This meant that each replicate normal length CF microbiota age model was trained using a total of 490 training samples (70 per time point) and 210 testing samples (30 per time point). Similarly, each replicate low length CF microbiota age model was trained using a total of 154 training samples (22 per time point) and 63 testing samples (9 per time point).
Model performance was evaluated based on the Pearson correlation between model predictions for sample microbiota age and the true age of the sample. Correlations were calculated separately for each replicate model using either the testing set associated with the replicate or the full set of CF samples. Relative microbiota age was calculated by comparing predicted microbiota age to a spline fit to the associated model. For each replicate model, a spline was fit using model predictions on the associated testing set as a function of the true age of the test samples (R function “smooth.spline”, df = 3, all other parameters set to the default). A sample’s relative microbiota age was then defined as a model’s prediction of the sample’s microbiota age minus the value of the model’s associated spline at the true age of the sample. Each sample had 10 estimates of its relative microbiota age, one from each replicate model trained on the opposite cohort. Significance of negative or positive shifts in relative microbiota age at each time point was calculated using the Wilcoxon signed-rank test with the null hypothesis that the median relative microbiota age was 0 for each cohort at each time point.
Informative model features were identified using the random forest importance score based on the average (across all trees in the forest) decrease in the residual sum of squares in the regression when splitting on a feature. The most informative taxa for a given cohort (controls, controls excluding samples on acid suppressors, CF infants, CF infants excluding samples on acid suppressors) and a given feature set (species-level, genus-level, all taxa) were defined here as the taxa with the top ten highest mean importance scores across all replicate models trained on that cohort. Following Subramanian et al.22, we further examined the performances of microbiota age analysis using sparse models that are restricted to these most informative taxa for each feature set. Due to overlap in informative taxa between models trained on different cohorts, these sparse models used 23, 20, and 24 unique informative taxa for species-level, genus-level, and all taxa models respectively. Sparse models were trained and evaluated as above.
Fecal fat assay.
The fecal fat content of each sample was measured using the acid steatocrit method as described previously4,44. Acid steatocrit has been shown to correlate significantly with both acid excretion and fecal fat concentration in comparisons with 72-hour fecal fat measures in children with CF, with sensitivity and specificity for fat malabsorption of 90% and 100%, respectively45. Briefly, 0.5 g stool was mixed with vortexing with 1 ml of deionized water for 30 sec and homogenized for three minutes using a mini-beadbeater-8 (Biospec). To the homogenate 333 μl of 5 N perchloric acid was added, and the mixture was vortexed for 30 sec. The tube was then centrifuged at 13,000 rpm for 15 min. After centrifugation, three layers were distinguished: a solid layer at the base of the tube, a middle aqueous layer, and an upper lipid layer. The relative heights of the fat and solid layers in the tube were used to calculate the percentage fat content of the stool as follows: (Height of fat layer/(Height of solid + fat layers)) x 100.
Reporting summary.
Further information on research design is available in the Life Sciences Reporting Summary linked to this paper.
Data Availability
All metagenomic DNA sequence data required to assess the conclusion of this research are available without restriction from the Sequence Read Archive (SRA) at the National Center for Biotechnology Information under BioProject accession PRJNA510445.
Extended Data
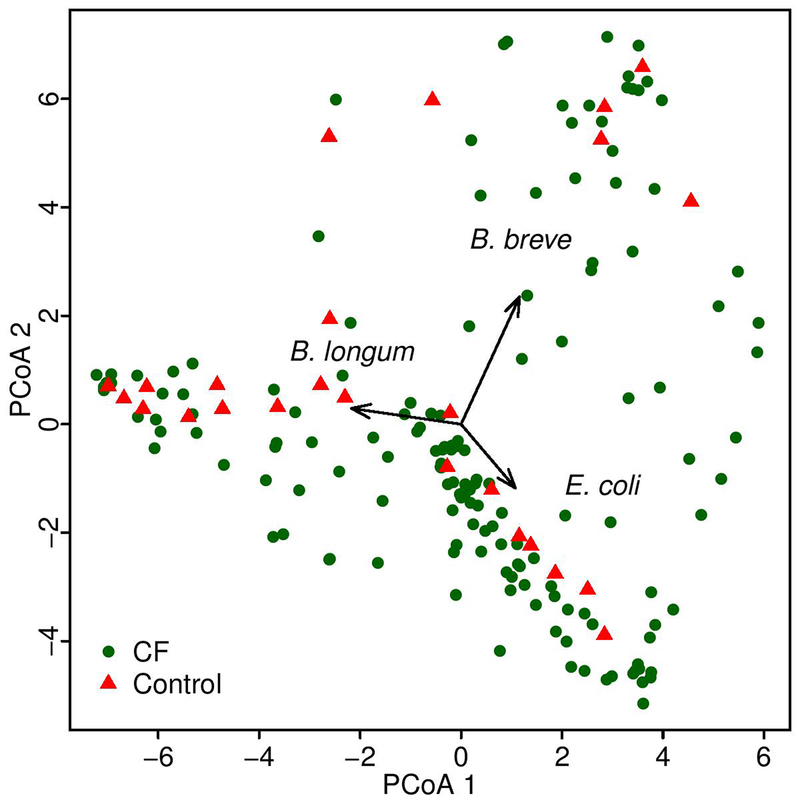
Extended Data Fig. 1. Principal coordinates analysis of the fecal microbiota of infants with CF and controls at month 4.
The structure of the fecal microbiomes of infants in this study at month 4 seen in a multidimensional scaling plot is dominated by the large abundances of Bifidobacterium longum, B. breve and E. coli. One samples is represented for each of 109 infants with CF and 25 controls. Each colored dot represents the microbiota of a different study sample, as indicated.
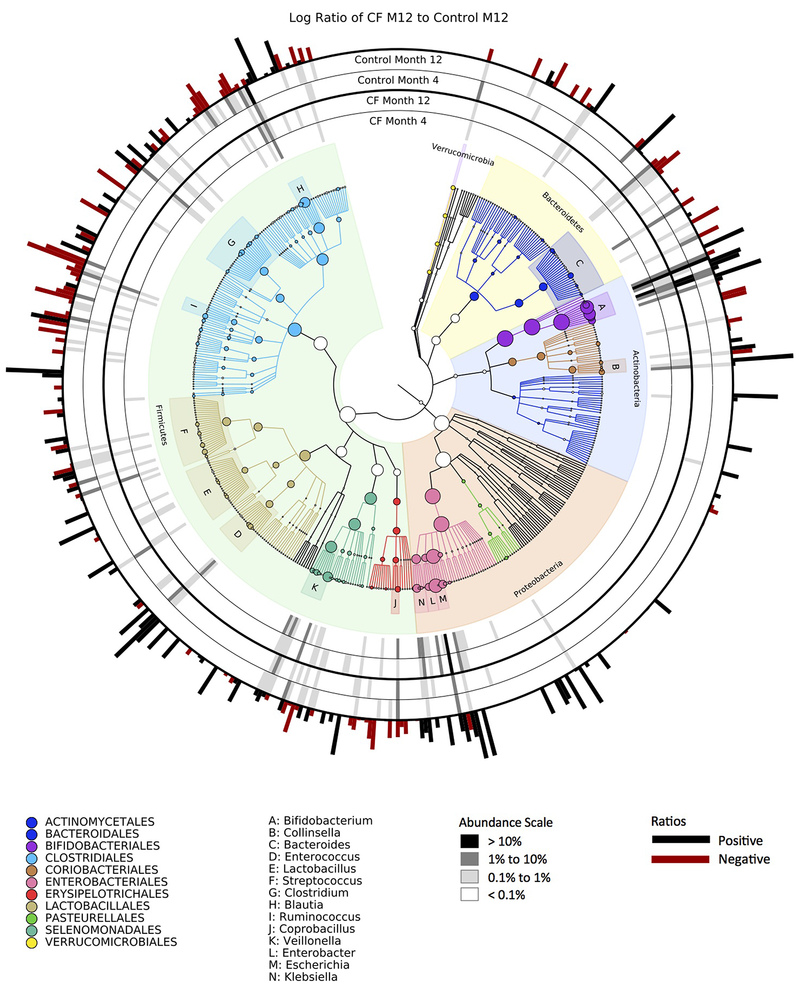
Extended Data Fig. 2. Phylogenetic plot comparing average microbiota at multiple taxonomic levels at months 4 and 12 for infants with CF and controls.
As indicated in the legend at lower right, greyscale bars indicate relative abundance; red vs. black bars on the outside of the circular graph indicate whether taxa were enriched in infants with CF (black) or controls (red) samples at month 12.
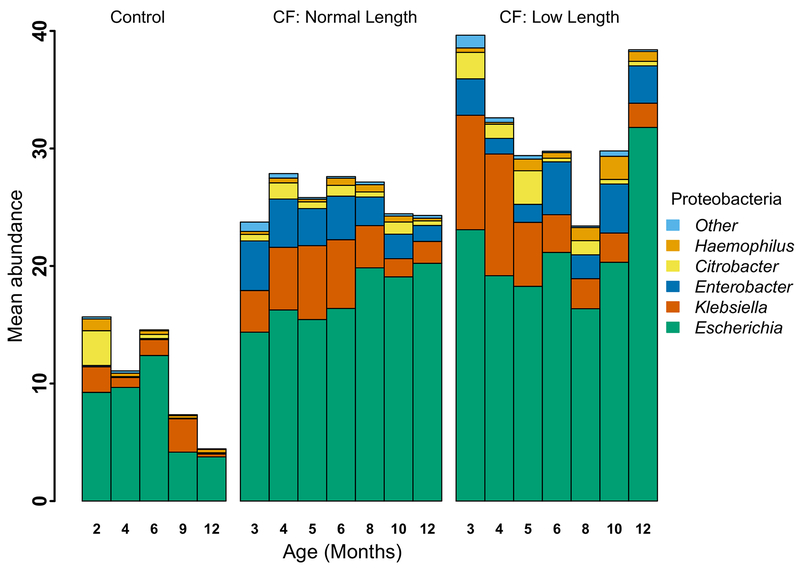
Extended Data Fig. 3. Mean percent relative abundance of genera in Phylum Proteobacteria in fecal samples from infants with CF with normal length, infants with CF with low length and controls.
Proteobacteria remained relatively high in infants with CF, and especially those with low length, due primarily to replacement with E. coli. In addition, abundances of Klebsiella and Enterobacter remained relatively high. Bar height represents mean percent relative abundance of Proteobacteria at each timepoint, and the mean relative abundance contribution for selected genera are indicated within each bar.
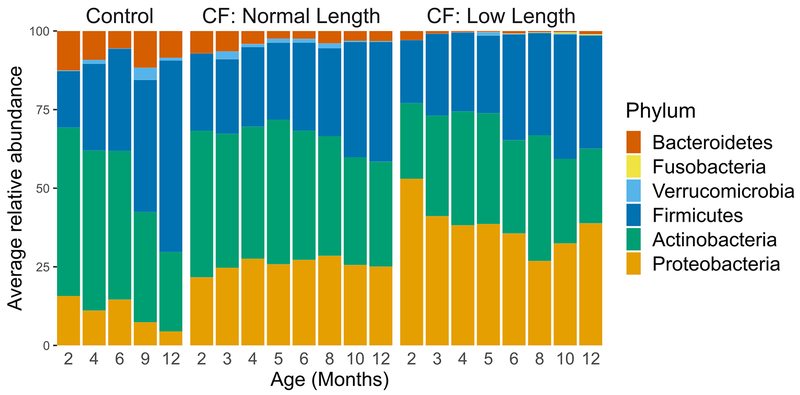
Extended Data Fig. 4. Average percent relative abundance of different bacterial phyla in fecal samples from infants with CF with normal length, infants with CF with low length and controls.
Phylum-level average microbiota at each collection time point of the control infants (left), compared to normal length infants with CF (middle), and low length infants with CF (right).
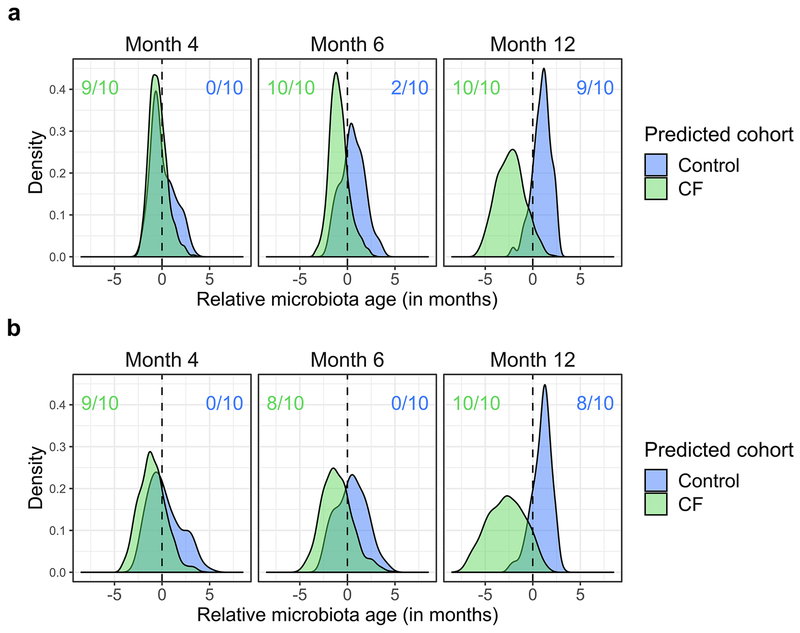
Extended Data Fig. 5. Fecal microbiota development is significantly delayed in infants with CF relative to controls when omitting infants prescribed any acid suppressors and when models are trained on a sparse set of taxonomic features.
a, infants prescribed any acid suppressors, including proton pump inhibitors and/or H2 blockers were omitted. b, models trained on a sparse set of taxonomic features. Shown are the distributions of “relative microbiota age” (x-axis), following the approach in Subramanian et al.21 for each subject group (CF or controls) using abundances at all taxonomic levels as the normalized error in a sample’s predicted microbiota age when using a computational model constructed for the other group (e.g., negative relative microbiota age indicates delayed development compared to the group used to construct the model). Y-axis, density of samples that mapped to a given relative microbiota age at the indicated timepoints. Colored ratios summarize the fraction of replicate full-feature models that produced a distribution of relative microbiota ages that was significantly negatively (green for CF samples relative to control models) or positively (blue for control samples relative to CF models) different from zero (q < 0.01, one-sided Wilcoxon signed-rank test).
Extended Data Fig. 6. Levels of fecal fat percentage and fecal calprotectin during the first year of life.
Lines above the boxes represent significant differences (q <= 0.01, two-sided Wilcoxon rank-sum test) between time points within a cohort (colored lines) or between cohorts at the same time point (black lines). Boxplot hinges indicate the first and third quartile, and whiskers indicate 1.5 times the IQR above and below.
Extended Data Fig. 7. Fecal microbiota development is significantly delayed in infants with CF with low length relative to infants with CF with normal length at month 12.
Shown are the distributions of “relative microbiota age” (x-axis), following the approach in Subramanian et al.21 for each subject group (CF low length or CF normal length) as described in Figure 2. Colored ratios summarize the fraction of replicate full-feature models that produced a distribution of relative microbiota ages that was significantly negatively (red for CF low length samples relative to CF normal length models) or positively (purple for CF normal length samples relative to CF low length models) different from zero (q < 0.01, one-sided Wilcoxon signed-rank test).
Extended Data Fig. 8. Prevalence of selected butyrate-producing species with significantly different prevalence between infants with CF compared to controls at month 12.
N = 23 controls, 152 CF, q < 0.05, chi-squared test.
Supplementary Material
Acknowledgments
This project was supported by grants from the NIH (R01DK095869, K24HL141669, 5P30DK089507) and the Cystic Fibrosis Foundation (SINGH15R0). E. Borenstein is a Faculty Fellow of the Edmond J. Safra Center for Bioinformatics at Tel Aviv University. We gratefully acknowledge the contributions of the principal investigators (including D. Borowitz, B. Ramsey, and D. Gelfond), study site coordinators and participants of the BONUS and Healthy Infants Studies.
Footnotes
Competing interests
The authors declare no competing interests.
References
- 1.Leung DH et al. Effects of Diagnosis by Newborn Screening for Cystic Fibrosis on Weight and Length in the First Year of Life. JAMA Pediatr 171, 546–554, doi: 10.1001/jamapediatrics.2017.0206 (2017). [DOI] [PMC free article] [PubMed] [Google Scholar]
- 2.Konstan MW et al. Growth and nutritional indexes in early life predict pulmonary function in cystic fibrosis. J Pediatr 142, 624–630, doi: 10.1067/mpd.2003.152 (2003). [DOI] [PubMed] [Google Scholar]
- 3.Yen EH, Quinton H & Borowitz D Better nutritional status in early childhood is associated with improved clinical outcomes and survival in patients with cystic fibrosis. J Pediatr 162, 530–535 e531, doi: 10.1016/j.jpeds.2012.08.040 (2013). [DOI] [PubMed] [Google Scholar]
- 4.Hoffman LR et al. Escherichia coli dysbiosis correlates with gastrointestinal dysfunction in children with cystic fibrosis. Clin Infect Dis 58, 396–399, doi: 10.1093/cid/cit715 (2014). [DOI] [PMC free article] [PubMed] [Google Scholar]
- 5.Manor O et al. Metagenomic evidence for taxonomic dysbiosis and functional imbalance in the gastrointestinal tracts of children with cystic fibrosis. Sci Rep 6, 22493, doi: 10.1038/srep22493 (2016). [DOI] [PMC free article] [PubMed] [Google Scholar]
- 6.Yan J & Charles JF Gut Microbiota and IGF-1. Calcif Tissue Int 102, 406–414, doi: 10.1007/s00223-018-0395-3 (2018). [DOI] [PMC free article] [PubMed] [Google Scholar]
- 7.Yan J et al. Gut microbiota induce IGF-1 and promote bone formation and growth. Proc Natl Acad Sci U S A 113, E7554–E7563, doi: 10.1073/pnas.1607235113 (2016). [DOI] [PMC free article] [PubMed] [Google Scholar]
- 8.Elborn JS Cystic fibrosis. Lancet 388, 2519–2531, doi: 10.1016/S0140-6736(16)00576-6 (2016). [DOI] [PubMed] [Google Scholar]
- 9.Borowitz D & Gelfond D Intestinal complications of cystic fibrosis. Curr Opin Pulm Med 19, 676–680, doi: 10.1097/MCP.0b013e3283659ef2 (2013). [DOI] [PubMed] [Google Scholar]
- 10.De Lisle RC & Borowitz D The cystic fibrosis intestine. Cold Spring Harb Perspect Med 3, a009753, doi: 10.1101/cshperspect.a009753 (2013). [DOI] [PMC free article] [PubMed] [Google Scholar]
- 11.Gelfond D & Borowitz D Gastrointestinal complications of cystic fibrosis. Clin Gastroenterol Hepatol 11, 333–342; quiz e330-331, doi: 10.1016/j.cgh.2012.11.006 (2013). [DOI] [PubMed] [Google Scholar]
- 12.Stalvey MS et al. Growth in Prepubertal Children With Cystic Fibrosis Treated With Ivacaftor. Pediatrics 139, doi: 10.1542/peds.2016-2522 (2017). [DOI] [PMC free article] [PubMed] [Google Scholar]
- 13.Nielsen S et al. Disrupted progression of the intestinal microbiota with age in children with cystic fibrosis. Sci Rep 6, 24857, doi: 10.1038/srep24857 (2016). [DOI] [PMC free article] [PubMed] [Google Scholar]
- 14.Ooi CY et al. Impact of CFTR modulation with Ivacaftor on Gut Microbiota and Intestinal Inflammation. Sci Rep 8, 17834, doi: 10.1038/s41598-018-36364-6 (2018). [DOI] [PMC free article] [PubMed] [Google Scholar]
- 15.Segata N et al. Metagenomic microbial community profiling using unique clade-specific marker genes. Nat Methods 9, 811–814, doi: 10.1038/nmeth.2066 (2012). [DOI] [PMC free article] [PubMed] [Google Scholar]
- 16.Vatanen T et al. The human gut microbiome in early-onset type 1 diabetes from the TEDDY study. Nature 562, 589–594, doi: 10.1038/s41586-018-0620-2 (2018). [DOI] [PMC free article] [PubMed] [Google Scholar]
- 17.Schirmer M et al. Compositional and Temporal Changes in the Gut Microbiome of Pediatric Ulcerative Colitis Patients Are Linked to Disease Course. Cell Host Microbe 24, 600–610 e604, doi: 10.1016/j.chom.2018.09.009 (2018). [DOI] [PMC free article] [PubMed] [Google Scholar]
- 18.Backhed F et al. Dynamics and Stabilization of the Human Gut Microbiome during the First Year of Life. Cell Host Microbe 17, 690–703, doi: 10.1016/j.chom.2015.04.004 (2015). [DOI] [PubMed] [Google Scholar]
- 19.Pannaraj PS et al. Association Between Breast Milk Bacterial Communities and Establishment and Development of the Infant Gut Microbiome. JAMA Pediatr 171, 647–654, doi: 10.1001/jamapediatrics.2017.0378 (2017). [DOI] [PMC free article] [PubMed] [Google Scholar]
- 20.Gupta RW et al. Histamine-2 receptor blockers alter the fecal microbiota in premature infants. J Pediatr Gastroenterol Nutr 56, 397–400, doi: 10.1097/MPG.0b013e318282a8c2 (2013). [DOI] [PubMed] [Google Scholar]
- 21.Imhann F et al. Proton pump inhibitors affect the gut microbiome. Gut 65, 740–748, doi: 10.1136/gutjnl-2015-310376 (2016). [DOI] [PMC free article] [PubMed] [Google Scholar]
- 22.Subramanian S et al. Persistent gut microbiota immaturity in malnourished Bangladeshi children. Nature 510, 417–421, doi: 10.1038/nature13421 (2014). [DOI] [PMC free article] [PubMed] [Google Scholar]
- 23.Wilson DC & Pencharz PB Nutrition and cystic fibrosis. Nutrition 14, 792–795 (1998). [DOI] [PubMed] [Google Scholar]
- 24.Matel JL & Milla CE Nutrition in cystic fibrosis. Semin Respir Crit Care Med 30, 579–586, doi: 10.1055/s-0029-1238916 (2009). [DOI] [PubMed] [Google Scholar]
- 25.Langdon A, Crook N & Dantas G The effects of antibiotics on the microbiome throughout development and alternative approaches for therapeutic modulation. Genome Med 8, 39, doi: 10.1186/s13073-016-0294-z (2016). [DOI] [PMC free article] [PubMed] [Google Scholar]
- 26.Treem WR, Ahsan N, Shoup M & Hyams JS Fecal short-chain fatty acids in children with inflammatory bowel disease. J Pediatr Gastroenterol Nutr 18, 159–164 (1994). [DOI] [PubMed] [Google Scholar]
- 27.Owira PM & Winter TA Colonic energy salvage in chronic pancreatic exocrine insufficiency. JPEN J Parenter Enteral Nutr 32, 63–71, doi: 10.1177/014860710803200163 (2008). [DOI] [PubMed] [Google Scholar]
- 28.Vogt JA & Wolever TM Fecal acetate is inversely related to acetate absorption from the human rectum and distal colon. J Nutr 133, 3145–3148, doi: 10.1093/jn/133.10.3145 (2003). [DOI] [PubMed] [Google Scholar]
- 29.Boets E et al. Quantification of in Vivo Colonic Short Chain Fatty Acid Production from Inulin. Nutrients 7, 8916–8929, doi: 10.3390/nu7115440 (2015). [DOI] [PMC free article] [PubMed] [Google Scholar]
- 30.Vernocchi P et al. Gut microbiota signatures in cystic fibrosis: Loss of host CFTR function drives the microbiota enterophenotype. PLoS One 13, e0208171, doi: 10.1371/journal.pone.0208171 (2018). [DOI] [PMC free article] [PubMed] [Google Scholar]
- 31.Debyser G et al. Faecal proteomics: A tool to investigate dysbiosis and inflammation in patients with cystic fibrosis. J Cyst Fibros 15, 242–250, doi: 10.1016/j.jcf.2015.08.003 (2016). [DOI] [PubMed] [Google Scholar]
- 32.Hildebrandt MA et al. High-fat diet determines the composition of the murine gut microbiome independently of obesity. Gastroenterology 137, 1716–1724 e1711–1712, doi: 10.1053/j.gastro.2009.08.042 (2009). [DOI] [PMC free article] [PubMed] [Google Scholar]
- 33.Huang Y, Guo F, Li Y, Wang J & Li J Fecal microbiota signatures of adult patients with different types of short bowel syndrome. J Gastroenterol Hepatol 32, 1949–1957, doi: 10.1111/jgh.13806 (2017). [DOI] [PubMed] [Google Scholar]
- 34.Matamouros S et al. Adaptation of commensal proliferating Escherichia coli to the intestinal tract of young children with cystic fibrosis. Proc Natl Acad Sci U S A 115, 1605–1610, doi: 10.1073/pnas.1714373115 (2018). [DOI] [PMC free article] [PubMed] [Google Scholar]
- 35.Wang Y et al. Opportunistic bacteria confer the ability to ferment prebiotic starch in the adult cystic fibrosis gut. Gut Microbes, 1–15, doi: 10.1080/19490976.2018.1534512 (2018). [DOI] [PMC free article] [PubMed] [Google Scholar]
- 36.Piper HG Intestinal microbiota in short bowel syndrome. Semin Pediatr Surg 27, 223–228, doi: 10.1053/j.sempedsurg.2018.07.007 (2018). [DOI] [PubMed] [Google Scholar]
Methods-only References
- 37.Bassis CM et al. Comparison of stool versus rectal swab samples and storage conditions on bacterial community profiles. BMC Microbiol 17, 78, doi: 10.1186/s12866-017-0983-9 (2017). [DOI] [PMC free article] [PubMed] [Google Scholar]
- 38.Tedjo DI et al. The effect of sampling and storage on the fecal microbiota composition in healthy and diseased subjects. PLoS One 10, e0126685, doi: 10.1371/journal.pone.0126685 (2015). [DOI] [PMC free article] [PubMed] [Google Scholar]
- 39.Choo JM, Leong LE & Rogers GB Sample storage conditions significantly influence faecal microbiome profiles. Sci Rep 5, 16350, doi: 10.1038/srep16350 (2015). [DOI] [PMC free article] [PubMed] [Google Scholar]
- 40.Yu Z & Morrison M Improved extraction of PCR-quality community DNA from digesta and fecal samples. Biotechniques 36, 808–812, doi: 10.2144/04365ST04 (2004). [DOI] [PubMed] [Google Scholar]
- 41.Morgan XC et al. Dysfunction of the intestinal microbiome in inflammatory bowel disease and treatment. Genome Biol 13, R79, doi: 10.1186/gb-2012-13-9-r79 (2012). [DOI] [PMC free article] [PubMed] [Google Scholar]
- 42.Breiman L Random forests. Machine Learning 45, 5–32 (2001). [Google Scholar]
- 43.Deng H & Runger G Gene selection with guided regularized random forest. Pattern Recognition 46, 3483–3489 (2013). [Google Scholar]
- 44.Tran M et al. The acid steatocrit: a much improved method. J Pediatr Gastroenterol Nutr 19, 299–303 (1994). [DOI] [PubMed] [Google Scholar]
- 45.Van den Neucker A et al. Clinical use of acid steatocrit. Acta Paediatr 86, 466–469 (1997). [DOI] [PubMed] [Google Scholar]
Associated Data
This section collects any data citations, data availability statements, or supplementary materials included in this article.
Supplementary Materials
Data Availability Statement
All metagenomic DNA sequence data required to assess the conclusion of this research are available without restriction from the Sequence Read Archive (SRA) at the National Center for Biotechnology Information under BioProject accession PRJNA510445.


