Abstract
In subjects with orofacial clefts, there is an unresolved controversy on the effect of congenital maxillary growth deficiency vs. the effect of surgical intervention on the outcome of treatment. Intrinsic growth impairment in subjects with orofacial clefts can be studied by comparing facial morphology of subjects with untreated cleft and unaffected individuals of the same ethnic background. Bilateral cleft lip and palate is the most severe and least prevalent form of the orofacial cleft. The aim of this study was to compare facial morphology in subjects with unrepaired complete bilateral clefts and unaffected controls using geometric morphometrics. Lateral cephalograms of 39 Indonesian subjects with unrepaired bilateral complete cleft lip and alveolus (mean age: 24 years), or unrepaired bilateral complete cleft lip, alveolus, and palate (mean age: 20.6 years) and 50 age and ethnically matched controls without a cleft (25 males, 25 females, mean age: 21.2 years) were digitized and traced and shape variability was explored using principal component analysis, while differences between groups and genders were evaluated with canonical variate analysis. Individuals with clefts had a more pronounced premaxilla than controls. Principal component analysis showed that facial variation in subjects with clefts occurred in the anteroposterior direction, whereas in controls it was mostly in the vertical direction. Regression analysis with group, sex, and age as covariates and principal components from 1 to 6 as dependent variables demonstrated a very limited effect of the covariates on the facial shape variability (only 11.6% of the variability was explained by the model). Differences between cleft and non‐cleft subjects in the direction of facial variability suggest that individuals with bilateral clefts can have an intrinsic growth impairment affecting facial morphology later in life.
Keywords: bilateral cleft lip and palate, bilateral cleft lip, facial morphology, geometric morphometrics, maxillary growth, unrepaired clefts
Facial variation in subjects with clefts occurred in the antero‐posterior direction, whereas in controls it was mostly in the vertical direction. This suggests that individuals with bilateral clefts can have an intrinsic growth impairment affecting facial morphology later in life.
Introduction
In subjects with orofacial clefts (OFC) there is an unresolved controversy on the effect of congenital maxillary growth deficiency vs. the contribution of surgical interventions to such maxillary growth deficiency. Studies on maxillofacial growth performed to date have usually used lateral radiographs of the head (cephalograms), which were analyzed with various cephalometric methods. In subjects with unoperated unilateral cleft lip and palate, cephalometric investigations produced controversial results showing that the maxilla could be smaller (Capelozza et al. 1993; Liao & Mars, 2005), comparable (Shetye & Evans, 2006; Diah et al. 2007) or larger (Ortiz‐Monasterio et al. 1974) than in non‐cleft controls. The data for unoperated bilateral clefts are even scarcer and comprise mostly case reports (Will, 2000).
These conflicting findings may depend on the error of the method, different ages of assessment (for example, evaluation at post‐adolescence vs. adulthood) or the use of samples of mixed ethnic background. It is also possible that these ambiguities were associated with limitations of conventional cephalometric analysis, which is clinically still widely used to analyze maxillofacial growth, although the disadvantages were already pointed out by Moyers & Bookstein (1979). To overcome these limitations, geometric morphometrics (GM) is the method of choice for analysis of craniofacial shape. GM offers a precise and accurate description of the shape; it enables rigorous statistical analyses and greatly facilitates the visualization, interpretation and communication of results (Zelditch et al. 2012). Therefore, the general aim of this study was to compare facial morphology in subjects with bilateral cleft lip and alveolus/palate and unaffected controls using GM methods. The research hypothesis (HR) tested in this study was that the patterns of craniofacial shape variations in subjects with bilateral cleft lip and alveolus/palate and unaffected controls are comparable.
Materials and methods
Ethical permission for this study was obtained from the Bioethics Committee of the University of Indonesia (reference number: 1/EthEx/FKGUI/II/2015).
Facial morphology of 39 non‐syndromic subjects with unrepaired bilateral complete cleft lip and alveolus (BCLA, 19 males, six females, mean age 24 years, SD 10.2, range 14–47 years) or unrepaired bilateral complete cleft lip, alveolus, and palate (BCLP, seven males, seven females, mean age 20.6 years, SD 8.9, range 14–45 years) were compared with 50 Indonesian subjects without a cleft (NORM, 25 males, 25 females, mean age 21.2 years, SD 3.2, range 15–31 years) of the same ethnic background.
The BCLP sample was collected between 1986 and 1997 in the province of Nusa Tenggara, Indonesia, as part of a larger study as described earlier (Latief et al. 2010) in a cooperation between the University of Brawijaya, Faculty of Medicine (Malang, Indonesia), Universitas Indonesia, Faculty of Dentistry (Jakarta, Indonesia), University Medical Center Leiden, Department of Oral and Maxillofacial Surgery (Leiden, The Netherlands) and the Radboud University Medical Center (Nijmegen, The Netherlands). Only pretreatment lateral cephalograms of individuals of 14 years and older with bilateral complete clefts were included for further analysis. The control group comprised age‐matched non‐cleft adults coming from the same ethnic group as the cleft affected patients – Proto Malayid.
Facial morphology was evaluated on lateral cephalograms. Because the visualization of soft tissue contours was difficult due to the sub‐optimal quality of some radiographs, the analysis of the facial morphology was limited to hard tissues. Moreover, the magnification factor was not known for each radiograph. As a result, the actual size of the craniofacial region could not be established for each subject.
The geometry of the cranial base, the maxillary complex, the mandible, and the anterior dentition was captured using 18 anatomical landmarks (Fig. 1). The choice of landmarks was deemed sufficient to represent key anatomical structures of the facial skeleton. Moreover, similar landmarks were used in a publication employing geometric morphometrics to study cleft patients (Bartzela et al. 2011).
Figure 1.
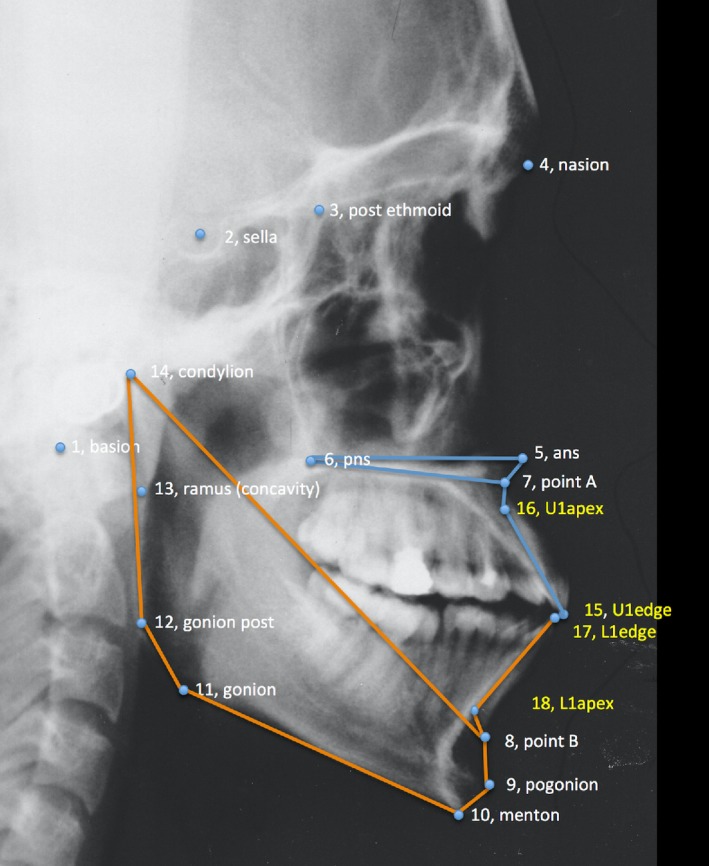
Landmarks identified on each cephalogram.
The lateral radiographs were scanned at 300 dpi resolution. The landmarks were digitized by one investigator (P.F.) on the scan of each radiograph with the tpsDig2 program, version 2.18 (http://life.bio.sunysb.edu/morph/). Two‐dimensional landmark coordinates were extracted and exported in TPS format to be used in analyses with the morphoj program, version 1.06d (Klingenberg, 2011). To assess the effect of the measurement error, 28 subjects (14 with a cleft and 14 non‐cleft controls) were re‐digitized after more than 2 weeks by the same observer.
Method error assessment
Error of the method was assessed with analysis of variance (Procrustes anova) on 28 re‐digitized cephalograms. The following effects were included: group (i.e. BCLA, BCLP or NORM), sex, and duplicate measurements on shape variation. In general, in Procrustes anova the total variance in shape is decomposed into main (here: individuals), other main (here: group and sex), and error (here: duplicate measurement error) components with computed ratios between these components corrected by the appropriate number of degrees of freedom allowed to generate the test statistics (Viscosi & Cardini, 2011).
Statistical analysis
The comparisons of facial morphology were performed with geometric morphometrics (GM) methods. The GM analyses were carried out on shape variables obtained with generalized Procrustes analysis, which is based on minimizing the square distances between corresponding points and scaling all point configurations to a common size (Halazonetis, 2004).
Two areas were analyzed in the study: shape variability within the sample/groups and intergroup differences. Shape variability was explored using principal component analysis (PCA) (Jolliffe, 2002). The principal components (PCs) were evaluated to define the morphological changes that differentiated the sample. The effect of group, age, and sex on the shape was evaluated with multivariate regression analysis, where Procrustes shape coordinates were dependent variables and the group, age, and sex were covariates. The differences between the BCLA, BCLP, and NORM groups for males and females were evaluated using canonical variate analysis (CVA), a method used to find the shape features that best distinguish among multiple groups of specimens. CVA allows estimation of the degree at which specimens may be effectively sorted as members of a priori groups, which implies both differences in the mean shape and some degree of non‐overlap in the distributions of traits (Zelditch et al. 2012). The Procrustes and Mahalanobis distances between group means were established with the CVA. Sexual dimorphism in the BCLA, BCLP, and NORM groups was evaluated with discriminant function analysis (DA), which is equivalent to CVA but is used for comparisons only between two groups. Analogous to CVA, in DA the Procrustes and Mahalanobis distances between genders were calculated.
All GM analyses and statistical tests were performed in morphoj and past v.3 software. Permutation tests (100 000 permutation runs) with a significance level of 0.05 were used to establish intergroup differences in facial shapes. The visualization of facial shape changes was achieved by the construction of wireframes, i.e. sets of lines connecting landmarks.
Results
Method error
In the re‐digitized subsample, we found that the measurement error was relatively small – it explained 5.82% of the total variation (Table 1).
Table 1.
Procrustes anova for sources of shape variation in a subsample of re‐digitized 28 subjects [9 with BCLA, 5 with BCLP, and 14 without clefts (NORM)].
| Shape variation | ||||||
|---|---|---|---|---|---|---|
| Effect | Explained SS | SS | MS | df | F | P |
| Group | 8.63% | 0.027916 | 0.000436 | 64 | 1.27 | 0.080 |
| Sex | 4.03% | 0.013026 | 0.000407 | 32 | 1.19 | 0.221 |
| Individual | 81.38% | 0.263234 | 0.000343 | 768 | 15.73 | < 0.001 |
| Measurement error | 5.82% | 0.018829 | 0.000022 | 864 | 1.53 | 0.070 |
| Residual | 0.14% | 0.000457 | 0.000014 | 32 | ||
| Total | 100.00% | 0.323463 |
df, degrees of freedom; F, F statistics; MS, mean squares; P, P‐value; SS, sum of squares.
Shape variability
Overall shape variability in the sample is presented in Fig. 2. The pattern of scatter of individual shapes and the fact that confidence ellipses of the BCLA, BCLP, and NORM groups largely overlap one another, suggest a limited difference between the mean shapes of the groups. The PCA showed that the first six principal components (PC1–PC6), each accounting for at least 5% of variance, explained in total 67.3% of variance among individuals (Table 2). The first major axis of shape variation (PC1, 19.5% of variance) depicts shape patterns in the vertical direction along with some variation of the anteroposterior position of the maxillary complex, and PC2 (15% of variance) demonstrates mainly anteroposterior shape patterns, particularly of the size and/or position of the mandible relative to the cranial base and maxillary complex. PC3 accounts for variation in the posterior facial height and anteroposterior maxillary position, PC4 explains variation of the mandibular size and incisor relationship, PC5 explains variation of the maxillary position relative to the cranial base, and PC6 accounts for variation in the maxillary incisors relative to the cranial base.
Figure 2.
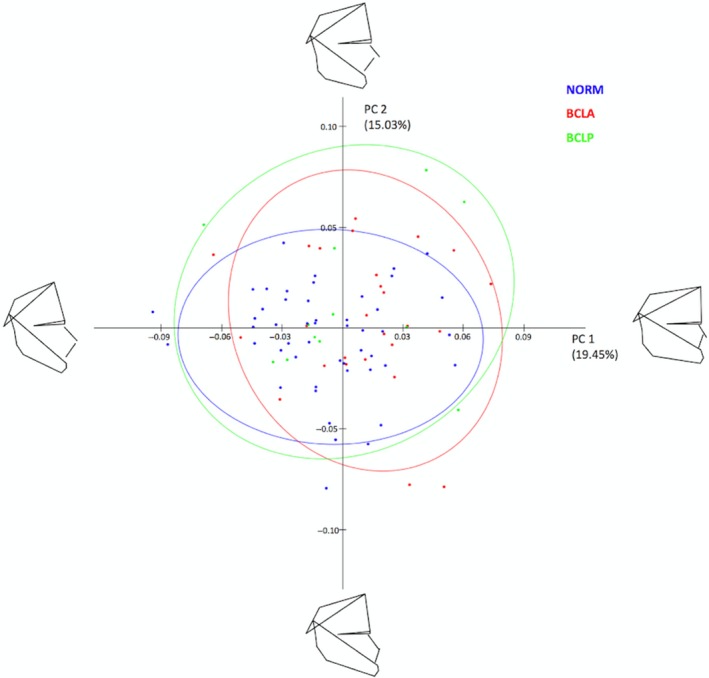
Principal component analysis of shape variables in the whole sample (subjects with and without cleft pooled together).
Table 2.
Proportion of variance in a sample comprising subjects with and without clefts described by principal components (PCs), explaining at least 5% of variance each, in shape space.
| Principal component (PC) | % Variance | Cumulative % |
|---|---|---|
| PC1 | 19.5 | 19.5 |
| PC2 | 15.0 | 34.5 |
| PC3 | 12.0 | 46.4 |
| PC4 | 9.2 | 55.6 |
| PC5 | 5.8 | 61.5 |
| PC6 | 5.8 | 67.3 |
| Remaining PCs | 32.7 | 100 |
Figure 3 presents shape variability separately in a pooled BCLA and BCLP group and in the NORM group. In comparison with non‐cleft subjects, shape variability in individuals with clefts is more pronounced in the anteroposterior than in vertical direction.
Figure 3.
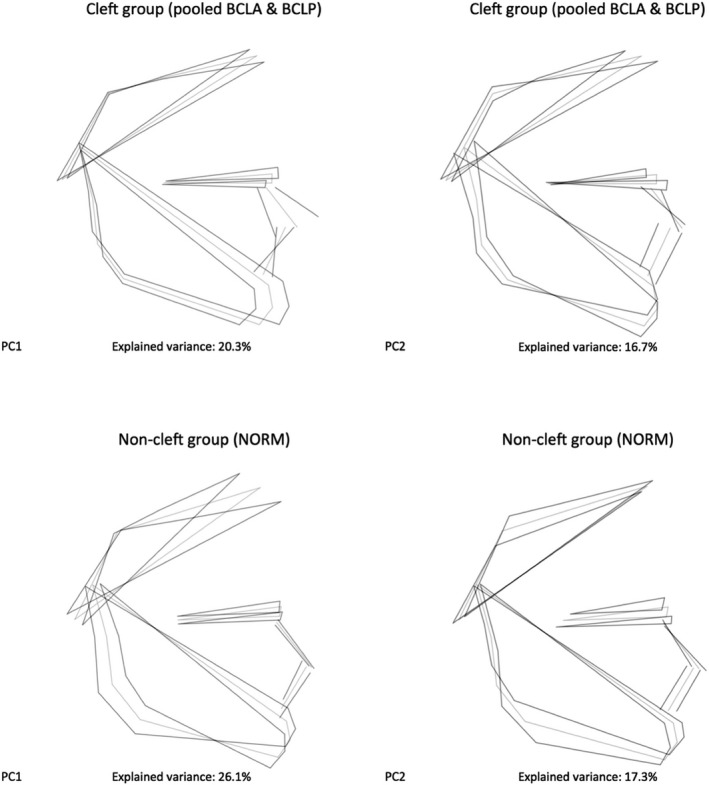
Variation in unaffected subjects (NORM) and a pooled group of subjects with bilateral cleft lip and alveolus (BCLA) and bilateral cleft lip and palate (BCLP) along the first two principal components (PC).
Age‐shape correlation
Regression analysis (Table 3) with group, sex, and age as covariates and PC1–PC6 as dependent variables (regression model with all principal components, i.e. PC1–PC32 as dependent variables, is available on request) demonstrated a very limited effect of the age on the facial shape variability. The model explained only 11.6% of the whole variability in the sample, and the age ‘weighted’ significantly less than group and sex. This indicates that a subject's age was not a predictor of the facial shape, either in males or in females, or with or without a cleft.
Table 3.
Multivariate regression analysis with group, sex, and age as covariates (independent variables) and principal components 1–6 (PC1–PC6) as dependent variables.
| Regression coefficients* for… | |||
|---|---|---|---|
| Group | Sex | Age | |
| PC1 | 4.023 | −18.996 | 1 |
| PC2 | 8.244 | −7.942 | −0.535 |
| PC3 | −10.188 | −12.439 | 0.923 |
| PC4 | 6.597 | −1.028 | 0.314 |
| PC5 | 6.017 | −4.387 | −0.195 |
| PC6 | −2.575 | 7.754 | 0.496 |
Total SS: 0.34713215; predicted SS: 0.04025944; residual SS: 0.3068727 (SS = sums of squares); % of predicted variability: 11.60%; P‐value: <0.00001 (100 000 permutation runs).
Regression coefficients were multiplied by 1000.
Sexual dimorphism
Regression analysis (Table 3) showed that the sex and group had limited, but for most PCs comparable, effects on facial shape variability. There was a statistically significant difference between males and females without a cleft (Table 4), with males having a shorter anterior facial height and flatter mandibular plane than females (Fig. 4). Among subjects with a cleft, males and females with BCLA demonstrated sexual dimorphism expressed mainly in the anteroposterior relationship of the maxilla and mandible, whereas no sexual dimorphism was found in the BCLP group (Fig. 4).
Table 4.
Sexual dimorphism in groups assessed with discriminant function analysis (DA).
| Groups | |||
|---|---|---|---|
| BCLA | BCLP | NORM | |
| Procrustes distance | 0.0468 | 0.0576 | 0.0416 |
| Mahalanobis distance | 7.9247 | 1.8461 | 3.6984 |
| T‐square | 321.2544 | 9.9397 | 170.9773 |
| P‐values for permutation tests (100 000 permutation runs) | |||
| Procrustes distance | 0.0527 | 0.2781 | < 0.0001 |
Figure 4.
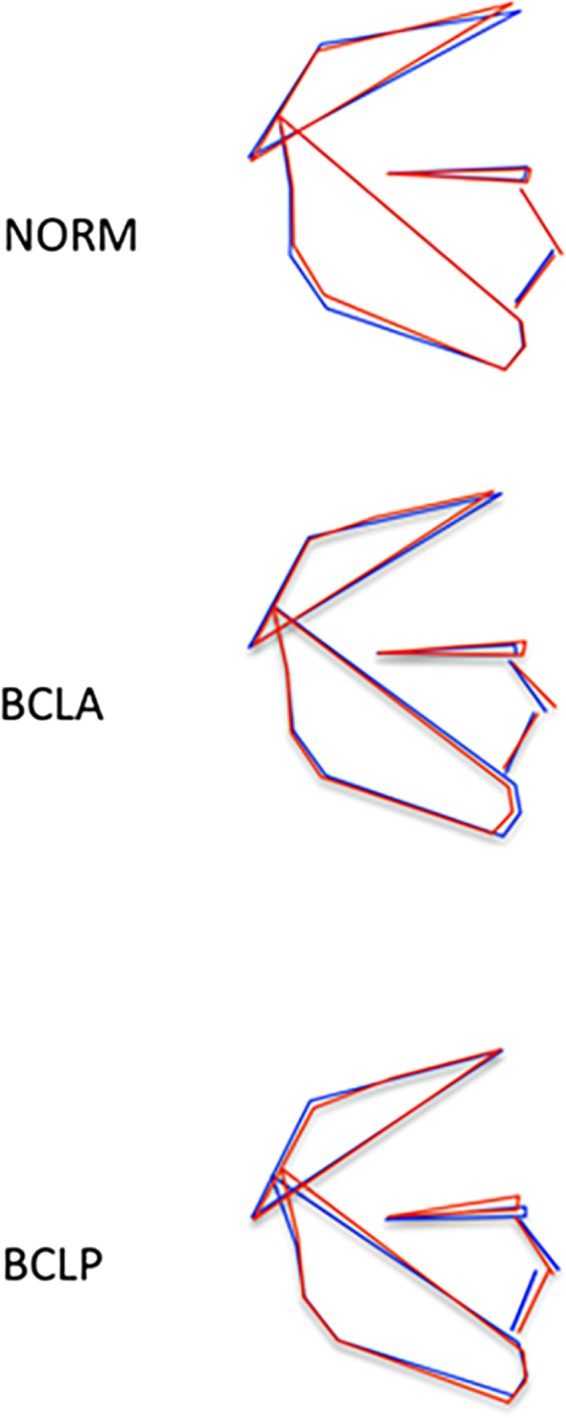
Visualization of sexual dimorphism in subjects without a cleft (NORM), with bilateral cleft lip and alveolus (BCLA), and with bilateral cleft lip and palate (BCLP) based on discriminant function analysis. Blue color: males; red color: females.
Differences between BCLA, BCLP, and NORM groups
The CVA showed differences between the mean shape configurations of each group (Table 5). Pairwise comparisons (NORM vs. BCLA, NORM vs. BCLP, and BCLA vs. BCLP) in males revealed statistically significant differences between subjects with and without a cleft; the difference between males with BCLA and BCLP was confirmed using Mahalanobis distance only (the Procrustes distance was comparable). The first canonical variate (CV1, 93.7% of variance) showed that differences were associated with maxillary shape and/or position and incisor inclination (Fig. 5a). Pairwise comparisons in females (Table 5) showed differences between all pairs, also between females with BCLA and BCLP. The CV1 (79.5% of variance) demonstrated similar differences as in males (Fig. 5b).
Table 5.
Pairwise differences between groups in facial shape configurations assessed with canonical variate analysis (CVA) separately for males and females.
| BCLA | BCLP | |
|---|---|---|
| Males | ||
| Mahalanobis distances among groups | ||
| BCLP | 4.7636 (P < 0.001) | |
| NORM | 10.1103 (P < 0.001) | 7.9239 (P < 0.001) |
| Procrustes distances among groups | ||
| BCLP | 0.0334 (P = 0.63) | |
| NORM | 0.0374 (P = 0.004) | 0.0511 (P = 0.008) |
| Females | ||
| Mahalanobis distances among groups | ||
| BCLP | 11.0002 (P = 0.0003) | |
| NORM | 12.5525 (P < 0.001) | 15.1539 (P < 0.001) |
| Procrustes distances among groups | ||
| BCLP | 0.0579 (P = 0.038) | |
| NORM | 0.0544 (P < 0.001) | 0.0444 (P = 0.043) |
P‐values from permutation tests (100 000 permutation runs) in brackets.
Figure 5.
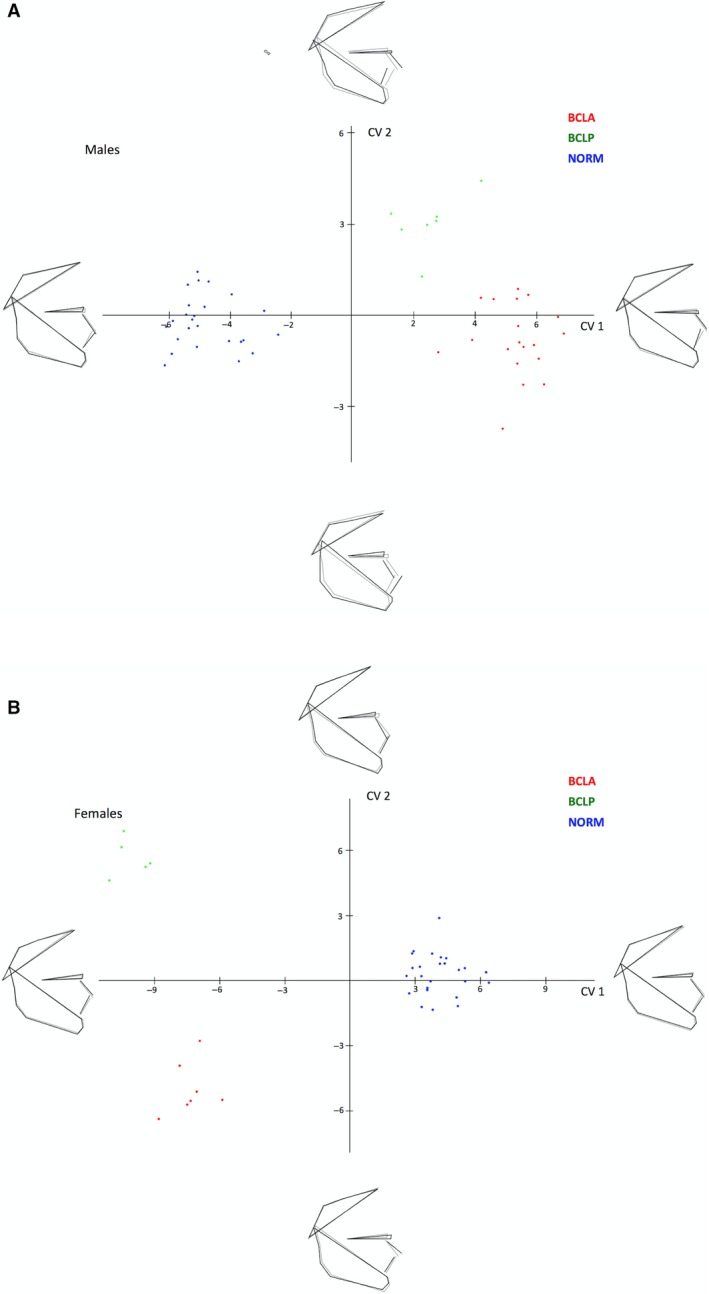
(a) Canonical variate analysis of unaffected males (NORM) and males with bilateral cleft lip and alveolus (BCLA) and bilateral cleft lip and palate (BCLP). (b) Canonical variate analysis of unaffected females (NORM) and females with bilateral cleft lip and alveolus (BCLA) and bilateral cleft lip and palate (BCLP).
Discussion
Exploration of shape variability in our sample with PCA demonstrated that shape variations were relatively similar in subjects with and without clefts. The highest variability of the facial shape concerned the vertical and anteroposterior directions, as visualized by extreme facial configurations along the PC1 and PC2 axes in Fig. 3. The remaining PCs explaining at least 5% variation each (PC3 through PC6) demonstrated that a significant component of variation was also in vertical and anteroposterior directions. Because the PCA served primarily as an exploratory analytical tool, the finer intergroup differences were studied with the CVA. We found that unaffected subjects and individuals with a cleft differed mostly with respect to the position of the (pre)maxilla, which was more protruded in the BCLA and BCLP groups than in controls (this difference was more pronounced in males than females). The differences between the BCLA and BCLP group were more subtle and concerned the maxillo‐mandibular relationship, with the maxillary complex being somewhat more protrusive in the BCLA than in the BCLP group, particularly in males.
We can compare our findings with results of other studies only regarding subjects with BCLP – samples with unrepaired BCLA have not as yet been described in the literature. In general, our results are in accordance with other studies (da Silva Filho et al. 1998; Diah et al. 2007). A common feature in these investigations was that young adults with unrepaired complete bilateral cleft lip, alveolus, and palate had a prominent premaxilla. Da Silva Filho et al. (1998) found also that the length of the maxillary apical base (distance between condylion and point A) in the complete BCLP group was comparable to the non‐cleft sample despite the extreme premaxillary prominence. This paradoxical finding – the increased prominence of the premaxilla on which point A is localized and normal condylion‐point A distance – was explained by the authors as reflecting some morphological distinctions between cleft and non‐cleft subjects. However, this contradictory finding may well indicate one of several shortcomings of cephalometric analysis, namely the dependence on reference structures. In other words, in conventional cephalometrics, the position of a facial component is relative, and differences may be due to a true change of its position or to a change of the position of the reference structure. GM bypasses this problem by using alternative shape description without reference structures. This allows for a more realistic picture of the facial configuration.
We found that a significant part of facial variation in unaffected individuals (NORM group) was associated with variability of the vertical proportions of the face. The PC1 and PC2, which explained 43.4% of variance, were associated with rotation of the mandible relative to the cranial base (PC1, 26.1% of variance) and facial heights (PC2, 17.3% of variance). This finding is in agreement with the results of other authors (Halazonetis, 2004; Bastir & Rosas, 2006; Rosas et al. 2008; Wellens et al. 2013; Polychronis & Halazonetis, 2014). Analyses of variations of facial shape in orthodontic patients from Greece (Halazonetis, 2004; Polychronis & Halazonetis, 2014) and Belgium (Wellens et al. 2013) as well as skulls of Europeans, West Africans and Asians from Japan living in the 18th and 19th centuries (Bastir & Rosas, 2006; Rosas et al. 2008) revealed that the largest variability of the craniofacial complex occurred in the vertical direction. In these studies, the values of PC1s accounting for vertical facial shape variations ranged from 19.3% (Rosas et al. 2008) to 29.7% (Wellens et al. 2013). This is congruent with our findings.
In the scientific literature, there is a debate regarding the effect of inborn growth deficiency vs. surgical iatrogenesis on facial growth in patients treated for orofacial clefts (Iwasaki et al. 2010; Ness et al. 2015; Rautio et al. 2017). A comparison of patterns of facial shape variation in subjects with an untreated cleft deformity and in patients with an operated orofacial cleft can help explain this phenomenon. In theory, if facial growth deficiency is exclusively the result of treatment of the cleft deformity, one could expect that the pattern of variations of the shape of the face in untreated clefts is comparable with the pattern of variations in subjects without an orofacial cleft. If the opposite is true, the pattern of facial shape variations in untreated and treated clefts should be different. The data for subjects with repaired unilateral cleft lip and palate (Toro‐Ibacache et al. 2014; Starbuck et al. 2015) demonstrated that facial shape variations occurred primarily in the anteroposterior direction. This is logical because many studies showed that surgical closure of the cleft resulted in inhibition of the forward growth of the maxillary complex (Nollet et al. 2008; Fudalej et al. 2010; Del Guercio et al. 2010). Because surgical repair of a bilateral cleft lip and palate also results in inhibition of the anterior growth of the maxillary complex, one can reasonably assume (though no data have been published to date) that a similar pattern of facial shape variations is also present in these subjects. We found that untreated complete bilateral cleft lip and alveolus/palate is associated with more facial shape variations in the anteroposterior direction than observed in unaffected individuals. Moreover, we demonstrated that subjects with and without a bilateral cleft could be separated most effectively with respect to facial shape variations, in males mostly in the anteroposterior direction, but in females in a combination of anteroposterior and vertical directions. These findings imply that complete BCLA and BCLP are associated with intrinsic abnormal facial growth patterns, which in some patients may have negative consequences on facial morphology, hence the outcome of therapy.
This study has several limitations – the sample size, particularly the number of subjects with BCLP, is limited. The small size could have an effect on the statistical power. Some subjects were relatively young (i.e. 14–18 years of age) at the moment of collection of cephalograms. Nevertheless, the literature on unoperated cleft uses the age 13 years to pinpoint the start of the adulthood stage (Latief et al. 2010). In our investigation, we used 2D cephalograms, although 3D imaging of OFC is currently a method of choice. The use of traditional cephalograms was dictated by unavailability of a portable 3D X‐ray machine. Also, the lack of information on magnification of facial structures on cephalograms prevented us from analyzing the size and allometry in subjects with and without bilateral cleft lip and palate.
Conclusions
In conclusion, shape variability demonstrates small differences in subjects with unrepaired complete bilateral cleft lip and alveolus (BCLA) and complete bilateral cleft lip, alveolus and palate (BCLP) and subjects without clefts (NORM). Moreover, in subjects with a cleft, variability was more pronounced in the anteroposterior direction, whereas in subjects without a cleft, variability was more pronounced in the vertical direction. Although differences were small, this study may suggest that subjects with bilateral clefts have intrinsic growth impairment that affects facial morphology later in life.
Conflict of interest
The authors state that they have no conflict of interests to declare.
References
- Bartzela TN, Katsaros C, Bronkhorst EM, et al. (2011) A two‐centre study on facial morphology in patients with complete bilateral cleft lip and palate at nine years of age. Int J Oral Maxillofac Surg 40, 782–789. [DOI] [PubMed] [Google Scholar]
- Bastir M, Rosas A (2006) Correlated variation between the lateral basicranium and the face: a geometric morphometric study in different human groups. Arch Oral Biol 51, 814–824. [DOI] [PubMed] [Google Scholar]
- Capelozza L Jr, Taniguchi SM, da Silva OG Jr (1993) Craniofacial morphology of adult unoperated complete unilateral cleft lip and palate patients. Cleft Palate Craniofac J 30, 376–381. [DOI] [PubMed] [Google Scholar]
- Del Guercio F, Meazzini MC, Garattini G, et al. (2010) A cephalometric intercentre comparison of patients with unilateral cleft lip and palate at 5 and 10 years of age. Eur J Orthod 32, 24–27. [DOI] [PubMed] [Google Scholar]
- Diah E, Lo LJ, Huang CS, et al. (2007) Maxillary growth of adult patients with unoperated cleft: answers to the debates. J Plast Reconstr Aesthet Surg 60, 407–413. [DOI] [PubMed] [Google Scholar]
- Fudalej P, Surowiec Z, Offert B, et al. (2010) Craniofacial morphology in complete unilateral cleft lip and palate patients consecutively treated with 1‐stage repair of the cleft. J Craniofac Surg 21, 1468–1473. [DOI] [PubMed] [Google Scholar]
- Halazonetis DJ (2004) Morphometrics for cephalometric diagnosis. Am J Orthod Dentofacial Orthop 125, 571–581. [DOI] [PubMed] [Google Scholar]
- Iwasaki H, Kudo M, Yamamoto Y (2010) Intrinsic effects of congenital cleft palate on craniofacial morphology and growth characteristics in puberty. J Craniofac Surg 21, 1480–1487. [DOI] [PubMed] [Google Scholar]
- Jolliffe IT (2002) Principal Component Analysis. New York: : Springer‐Verlag. [Google Scholar]
- Klingenberg CP (2011) MorphoJ: an integrated software package for geometric morphometrics. Mol Ecol Resour 11, 353–357. [DOI] [PubMed] [Google Scholar]
- Latief BS, Lekkas C, Kuijpers MA (2010) Maxillary arch width in unoperated adult bilateral cleft lip and alveolus and complete bilateral cleft lip and palate. Orthod Craniofac Res 13, 82–88. [DOI] [PubMed] [Google Scholar]
- Liao YF, Mars M (2005) Long‐term effects of clefts on craniofacial morphology in patients with unilateral cleft lip and palate. Cleft Palate Craniofac J 42, 601–609. [DOI] [PubMed] [Google Scholar]
- Moyers RE, Bookstein FL (1979) The inappropriateness of conventional cephalometrics. Am J Orthod 75, 599–617. [DOI] [PubMed] [Google Scholar]
- Ness AR, Wills AK, Waylen A, et al. (2015) Centralization of cleft care in the UK. Part 6: a tale of two studies. Orthod Craniofac Res 18(Suppl 2), 56–62. [DOI] [PMC free article] [PubMed] [Google Scholar]
- Nollet PJ, Katsaros C, Huyskens RW, et al. (2008) Cephalometric evaluation of long‐term craniofacial development in unilateral cleft lip and palate patients treated with delayed hard palate closure. Int J Oral Maxillofac Surg 37, 123–130. [DOI] [PubMed] [Google Scholar]
- Ortiz‐Monasterio F, Olmedo A, Trigos I, et al. (1974) Final results from the delayed treatment of patients with clefts of the lip and palate. Scand J Plast Reconstr Surg 8, 109–115. [DOI] [PubMed] [Google Scholar]
- Polychronis G, Halazonetis DJ (2014) Shape covariation between the craniofacial complex and first molars in humans. J Anat 225, 220–231. [DOI] [PMC free article] [PubMed] [Google Scholar]
- Rautio J, Andersen M, Bolund S, et al. (2017) Scandcleft randomised trials of primary surgery for unilateral cleft lip and palate: 2. Surgical results. J Plast Surg Hand Surg 51(1), 14–20. [DOI] [PubMed] [Google Scholar]
- Rosas A, Bastir M, Alarcón JA, et al. (2008) Thin‐plate spline analysis of the cranial base in African, Asian and European populations and its relationship with different malocclusions. Arch Oral Biol 53, 826–834. [DOI] [PubMed] [Google Scholar]
- Shetye PR, Evans CA (2006) Midfacial morphology in adult unoperated complete unilateral cleft lip and palate patients. Angle Orthod 76, 810–816. [DOI] [PubMed] [Google Scholar]
- da Silva Filho OG, Carvalho Lauris RC, Capelozza Filho L, et al. (1998) Craniofacial morphology in adult patients with unoperated complete bilateral cleft lip and palate. Cleft Palate Craniofac J 35, 111–119. [DOI] [PubMed] [Google Scholar]
- Starbuck JM, Ghoneima A, Kula K (2015) A Multivariate analysis of unilateral cleft lip and palate facial skeletal morphology. J Craniofac Surg 26, 1673–1678. [DOI] [PubMed] [Google Scholar]
- Toro‐Ibacache V, Cortés Araya J, Díaz Muñoz A, et al. (2014) Morphologic variability of nonsyndromic operated patients affected by cleft lip and palate: a geometric morphometric study. Am J Orthod Dentofacial Orthop 146, 346–354. [DOI] [PubMed] [Google Scholar]
- Viscosi V, Cardini A (2011) Leaf morphology, taxonomy and geometric morphometrics: a simplified protocol for beginners. PLoS ONE 6, e25630. [DOI] [PMC free article] [PubMed] [Google Scholar]
- Wellens HL, Kuijpers‐Jagtman AM, Halazonetis DJ (2013) Geometric morphometric analysis of craniofacial variation, ontogeny and modularity in a cross‐sectional sample of modern humans. J Anat 222, 397–409. [DOI] [PMC free article] [PubMed] [Google Scholar]
- Will LA (2000) Growth and development in patients with untreated clefts. Cleft Palate Craniofac J 37, 523–526. [DOI] [PubMed] [Google Scholar]
- Zelditch ML, Swiderski DL, Sheets HD (2012) Geometric Morphometrics for Biologists. A Primer. San Diego: Elsevier Academic Press. [Google Scholar]


