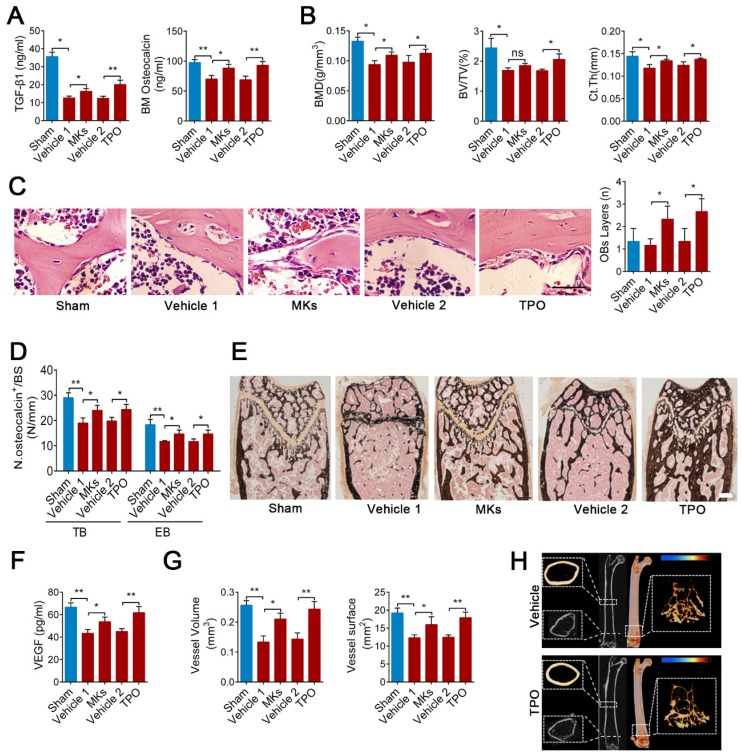
Figure 5.
MKs attenuate irradiation-induced bone loss in mice by secreting TGF-β1. (A) The concentrations of TGF-β1 and osteocalcin in the BM of sham or irradiated mice 2 months after treated with MKs or TPO, determined by ELISA (n=6 mice per group). (B) Quantitative Micro-CT analysis of the BMD, BV/TV and Ct.Th of femora from sham or irradiated mice 2 months after treated with MKs or TPO (n=6 mice per group). (C) HE staining demonstrating the layers of endosteal osteoblasts in the BM from sham or irradiated mice 2 weeks after treated with MKs or TPO (n=6 mice per group). Scale bar, 200 µm. (D) Quantification of osteocalcin+ cell numbers on surface of TB and EB from sham or irradiated mice 2 months after treated with MKs or TPO (n=6 mice per group). (E) Von Kossa staining showing the mineralization of bone matrix in sham or irradiated mice 2 months after treated with MKs or TPO (n=6 mice per group). Scale bar, 50 µm. (F) The concentration of VEGF in the BM of sham or irradiated mice 2 months after treated with MKs or TPO, determined by ELISA (n=6 mice per group). (G) Angiographic analysis of the volume and surface area of bone vessels from sham or irradiated mice 2 months after treated with MKs or TPO (n=6 mice per group). (H) Representative Micro-CT images of longitudinal section femurs, cross-sectional view of the distal femurs and reconstructed trabecular structure of the ROI (White dashed box) in TGF-β1MK∆/∆ mice with or without radioactive bone injury 2 months after treatment of TPO. Color scale bar represents bone mineral density level. (n=6 mice per group). Data are shown as mean ± SD. *P < 0.05, **P < 0.01. ns, no significant. For all panels in this figure, data are representative of three independent experiments.

