

Abstract
Perception of body weight has been recognized as an important barrier in the adoption of healthy lifestyles. Several factors affect perception of body weight, but the outcomes have been varied. This study aimed to study the perception and misperception of body weight and its association with the measured body mass index. A clinic-based cross-sectional study was done in the clinic using systematic sampling. Data were collected by using a self-administered questionnaire consisting of the sociodemographic profile, body weight perception question adopted from Weight Management Questionnaire and Youth Risk Behavior Surveillance System (YRBSS) 1991-2017. The prevalence of body weight misperception in the sample population was 58.6%. Most of the respondents were overweight (33.9%) and obese (33.9%). Respondents aged 25 years and older were 2.98 times more likely to have misperception compared with other age groups (95% CI: 1.21-3.19, P = .006). Divorced respondents were 4.70 times more likely to have body misperception compared with married respondents (95% CI 1.44-15.32, P = 0.01). This study showed that misperception of body weight could be influenced by reversible factors and measured body mass index. Hence, the rectification of these misperceptions is important in the clinical setting especially in these vulnerable groups of respondents.
Keywords: body weight perception, obesity, physical activity, body mass index (BMI), adults
Introduction
Obesity has become a growing concern in Southeast Asian countries as the prevalence of obesity has increases 10-fold in the span of 40 years; from 0.4% in the 1970s rising up to 4.7% in 2016.1 Malaysia, a developing country, is now ranked first in Southeast Asia as the country with the most overweight and obese adults. The prevalence of obesity was 17.7% as reported by the National Health and Morbidity Survey (NIHMS II), which was 3 times higher than other countries in this region.2,3
The rapid rise in obesity and overweight prevalence in Malaysia has opened a Pandora box in Malaysian health care, with the causal and complications of obesity having an impact on national health expenditures. The decrease in physical activities, overabundance of food choices, and lack of awareness about the risk of obesity are among the causes of the rising trend of obesity in this region. The upward surge of noncommunicable diseases such as diabetes, hyperlipidemia, and hypertension are the direct complications of obesity, which may cause increased morbidities among Malaysian population in the future.
Body mass index (BMI) has been widely used to document a person’s state of health, based on the calculation of weight in kilograms (kg) and height in meters (m).1 The World Health Organization (WHO) has ascribed that a person with optimum health should maintain a BMI of 18.5 to 24.9 kg/m2. Practicing a healthy lifestyle and having correct self-perception about body image condition should be the mainstay in fighting the obesity epidemic. Nonetheless it almost always hindered by the misperception of body weight among those with overweight and obesity issues. Studies in developed countries have shown that misperception of body weight was reported as high as 42%, with many obese and overweight people tended to under perceive their weight.4,5 This should be a cause of concern especially to the health policy makers, as this would affect the future public health policies in terms of health education and creating targeted public awareness of this problem.
In Malaysia, studies on body weight perception were limited to specific populations, namely adolescents and young adults,3,6 rural population,7 and women.8 There is an apparent gap in looking into urban adult population, in which we believe that they are directly affected by rapid urbanization and sedentary lifestyle. Hence, this study aimed to determine the prevalence of body weight misperceptions and its relationship to the actual BMI and its contributing factors among the adult population residing in urban and semiurban population.
Methods
Study Design
The study was a cross-sectional survey-based study conducted from December 2018 to May 2019 in Klinik Kesihatan Batu 9 Cheras, which is a government primary care clinic in Selangor, Malaysia. The clinic situated in an urban community, serving the multicultural societies in Malaysia. This study was approved by the Research and Ethical Committee of University Kebangsaan Malaysia Medical Centre and National Medical Research Registry (NMRR), with the permission from the local district Health Department. Participants were selected using systematic sampling of every 20th adult patient registered to the clinic, as to widen the coverage of patients’ recruitment into the study. The inclusion criteria for the study were Malaysians aged 18 years and older who were able to read Malay and English. Respondents who were pregnant or lactating, unable to walk, or perform regular activities, with chronic debilitating illnesses and physical disabilities were excluded from the selection. These include those who were physically unfit or weak to do physical activities and those with musculoskeletal disorder. Potential subjects were approached while waiting for their appointments, in which the nature and intent of the survey were explained to them. Those who agreed to participate and consented to the study were given the questionnaire set, having their body weight, height, and relevant clinical parameters documented. Subjects who were found obese, overweight, and underweight were referred to the medical officers of the clinic for further assessment. Sample size was calculated using the Fleiss formula for prevalence study, based on a study from Ahmad et al.7 The sample size was targeted at 421 subjects, taking into consideration the 10% nonresponse rate and hypothesis at 5% precision with 95% confidence interval. A total of 415 subjects were recruited to this study and were given the questionnaire. There were 13 nonresponders and 14 incomplete questionnaires, giving a total of 401 respondents for the final analysis.
Study Instruments
This study used a self-administered questionnaire with 2 parts: sociodemographic profile and body weight perceptions. The first part of the questionnaire recorded sociodemographic profile, namely age, gender, race, marital status, education level, and monthly household income.
Body Weight Perception and Misperception Categories
Body weight perception was assessed using Weight Management Questionnaire, Youth Risk Behavior Surveillance System (YRBSS) 1991-2017.9 Perceived body weight was assessed using a single question of how do you describe your weight? with 5 answer options; very underweight, slightly underweight, normal, slightly overweight, and very overweight. The answers were then grouped into 4 categories of underweight, normal, overweight, and obese.10
The discordance between BMI and self-reported body weight perception was analyzed as misperception and reported as
Under perception: when the perceived weight status is lower than measured weight
Correct perception: when the perceived weight status is equal to measured weight status
Over perception: when the perceived weight status is higher than measured weight status
Body Mass Index Measurement
The weight of the participant was measured using a portable digital scale. The participants were instructed to remove their shoes and bags before stepping on the scale. The weight was measured to the nearest 0.1 kg. The standing height was assessed using the maximum vertical stature. The participants were instructed to remove their shoes and then stand with their heels touching the wall surface and their feet pointing outward from the wall surface. The participants were instructed to face forward and make sure their backside touched the wall. They were also asked to take a deep breath during the measurement. The height was measured in centimeters and then converted to meters before calculating the actual BMI. The BMI was recorded as kilograms (kg) divided by square of the height (meters) with cutoff point of underweight (BMI < 18.50 kg/m2); normal weight (BMI 18.50-22.90 kg/m2); overweight (BMI 23-27.49 kg/m2), and obese (BMI ≥ 27.5 kg/m2). The BMI used for this study followed the recommended WHO BMI measurement for Asian population.1
Statistical Analysis
Data were analyzed using the IBM SPSS version 23. Descriptive analysis was used for demographic data characteristics, body weight perception, and measured BMI. Categorical variables were expressed as percentage, and numerical variables were expressed as mean and standard deviation. Cross-tabulations were developed for the actual BMI of the participants and their body weight perception. Frequency and percentage for categorical variables were calculated. Categories with a small sample size and skewed distribution were noted. All continuous variables are expressed as mean and 95% confidence interval (CI). Meaningful combinations of categories were done when indicated. Simple and multiple logistic regression analysis were carried out between the dependent and independent variables. The independent variables are body weight perception and other clinical parameters. All independent variables were simultaneously included in the regression model regardless of their statistical significance, and since this is a confirmatory analysis, no variable selection was done. A P value <.05 was considered statistically significant.
Results
Table 1 shows the sociodemographic characteristics and the BMI categorization of the 401 respondents recruited in the study. Majority of the respondents were between 25 and 54 years of age (59.1%), married (71.6%) with secondary school education (58.6%). More than three-quarters (81.8%) of the respondents earned MYR3800, which put them in low income (B40 group) of Malaysian household category (Department of Statistics, 2019). Measured BMI showed that nearly two-thirds of the respondents were above the optimum weight, with 33.9% were overweight and the other 33.9% were obese.
Table 1.
Sociodemographic Characteristics and Actual Body Mass Index (BMI) Measurement Among Respondents.
| Variables | n (%) |
|---|---|
| Age (years) | |
| ≤24 | 133 (13.2) |
| 25-54 | 77 (59.1) |
| ≥55 | 54 (27.7) |
| Gender | |
| Male | 164 (40.9) |
| Female | 237 (59.1) |
| Marital status | |
| Married | 287 (71.6) |
| Single | 96 (23.9) |
| Divorced/widowed | 18 (4.5) |
| Ethnicity | |
| Malay | 278 (69.3) |
| Chinese | 79 (19.7) |
| Indian and others | 44 (11.0) |
| Education | |
| Primary | 37 (9.2) |
| Secondary | 235 (58.6) |
| Tertiary | 129 (32.2) |
| Monthly household income (MYR) | |
| ≤3800 | 328 (81.8) |
| >3800 | 73 (18.2) |
| Actual BMI (kg/m2) | |
| Underweight (<18.5 kg/m2) | 18 (4.8) |
| Normal (18.5-23 kg/m2) | 111 (27.7) |
| Overweight (23.0-27.5 kg/m2) | 136 (33.9) |
| Obese (>27.5 kg/m2) | 136 (33.9) |
Figure 1 illustrates the comparison between actual BMI and body weight perception among respondents of the study. Nearly half (49.4%, n = 194) of the respondents perceived themselves in normal weight category, as opposed to 27.7% (n = 111) who were actually in the normal weight category. Respondents in the obese category did not perceive themselves as obese with only 9.5% of them perceiving their bodies’ condition correctly.
Figure 1.
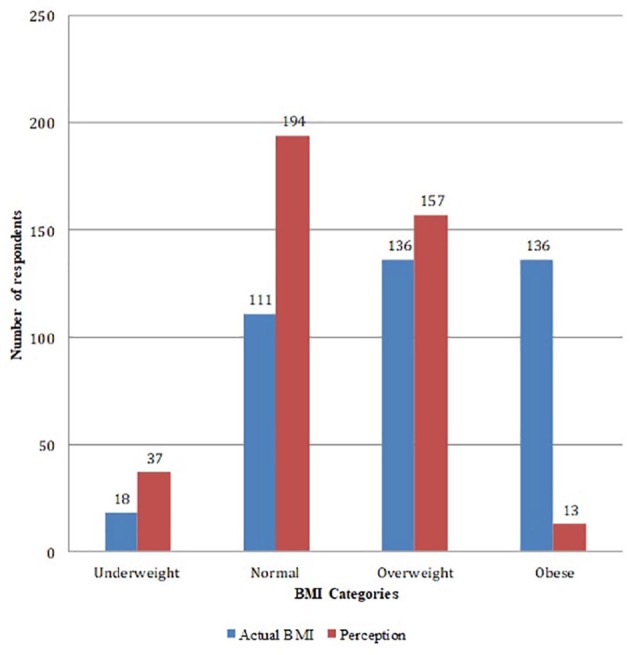
Respondents self-perceived body weight and measured body mass index (BMI): N = 401.
Table 2 analyses the body weight misperceptions. Our findings showed that those in overweight and obese categories underperceived their weight to be less than actual BMI (overweight—actual 136, underperceived 80 [58.8%] / obese—actual 136, underperceived 125 [91.9%]). None in the underweight category underperceived their bodies’ condition, whereas 33.3% thought that their bodies were heavier than the actual BMI. Respondents’ age and marital status were the factors found to be significantly associated with body weight misperception. Respondents aged 25 years and older were 2.98 times more likely to have misperception compared with other age groups (95% CI 1.21-3.19, P = .006). Divorced respondents were 4.70 times more likely to have body misperception compared with married respondents (95% CI 1.44-15.32, P = .01). Meanwhile, simple logistic regression on the measured BMI categories and body weight perceptions showed all categories had higher odds of misperceptions compared with underweight category, with the highest odd of misperception in the overweight category, whereby they were 45.97 times more likely to misperceive their body weight (95% CI 21.22-99.60, P < .001). There was no significant association noted between respondents’ gender, ethnicity, monthly income, and educational level with regard to body weight misperceptions in this study.
Table 2.
Relationship Between Actual Body Mass Index (BMI) and Misperception of the Body Weight.
| BMI Categories | Subjects (N = 401) | Underperception, n (%) | Correct Perception, n (%) | Overperception, n (%) |
|---|---|---|---|---|
| Underweight | 18 | 0 | 12 (66.7) | 6 (33.3) |
| Normal | 111 | 15 (13.5) | 89 (80.2) | 7 (6.3) |
| Overweight | 136 | 80 (58.8) | 54 (39.7) | 2 (1.5) |
| Obese | 136 | 125 (91.9) | 11 (8.1) | 0 |
| BMI Categories | Simple Logistic Regression | Multiple Logistic Regression | ||
| Crude Odds Ratio (95% CI) | P | Adjusted Odds Ratio (95% CI) | P | |
| Normal | Reference | Reference | ||
| Underweight | 2.02 (0.68-5.99) | .203 | 2.77 (0.87-2.77) | .086 |
| Overweight | 6.14 (3.44-10.97) | <.001* | 6.23 (3.32-11.67) | <.001* |
| Obese | 45.97 (21.22-99.60) | <.001* | 55.77 (24.14-128.88) | <.001* |
Statistically significant (P ≤ .05).
Discussion
The results of this study further highlight the obesity issue in Malaysia and other developing countries. Nearly two-thirds (67.8%) of our respondents were found to be overweight and obese based on the measured BMI. Majority of these respondents under perceived their weight, implicating their body image as either normal (for the overweight category) or lighter than their actual weight (for the obese category). Earlier studies on similar issue were heterogeneous in the findings, possibly influenced by geographical and socioeconomic factors. Studies in North America11 and Europe12 reported that 23% and 41.9% body image misperceptions, respectively, whereas similar studies in Asia yielded higher misperceptions prevalence. A study in China by Yan et al5 reported a misperception of 57.0%, whereas the studies done in India and Malaysia reported the prevalence of 57% and 52.2%, respectively. The higher prevalence of misperceptions among Asian countries, including this study, might be explained by several possible hypotheses. Most of the Asian countries are now using lower BMI cutoff points based on Asian population curves that might lower the actual BMI category. Nonetheless, the lack of awareness of optimum body weight and the acceptance of “rounder” and “curvier” body images might also contribute to the higher misperceptions as demonstrated in this study.
This trend is worrying as previous studies reported positive associations between overweight perception and weight control behaviors. Not only lesser attempt of losing weight was made, but the misperceivers were also found to have poorer eating habits and lesser physical activity.11 A study in Korea reported that overweight and obese women were 2.83 times and 3.39 times, respectively, more likely to try to lose weight than women who reported themselves to be underweight.13 The Malaysia School Based Nutrition Survey 2012 done among 40,112 adolescents also reported that overweight or obesity perception regardless of the objective BMI was positively associated with weight loss behavior.3 Not only that, adults who failed to recognize that they are overweight and obese tend to misperceive weight of others as well. This has been a concern among health care providers as the normalization of body images might lead to poor motivation to lose weight and eventually the risk of developing obesity related consequences such as diabetes and hypertension.
With regard to the measured BMI, two-thirds of the respondents were actually in the overweight and obese category with each category reported the prevalence of 33.9%. The figure in this study is doubled as compared with previous figures that were shown from National Health and Morbidity Survey in Malaysia, where the prevalence of obese adults in 2015 was only about 17.7%.2 The disparity was probably due to different set of participants assessed in this study compared with a much larger national data. Nonetheless, this study paints the reality of urban population in Malaysia. The high demands of life together with lack of time for physical activities now expose our community to obesity and obesity-related diseases. Over the years, various strategies had been laid out to control obesity and its related diseases. It is expected that with the increasing media and public health focus on obesity, there would be greater awareness of excess weight status and less obese people over time; however, what happened in the community was the opposite. Body weight misperception, especially underestimation of body weight, among overweight and obese have been recognized as one of the important barriers in the adoption of healthy lifestyles.
The strength of this study lies in the fact that it is a clinic-based study that involves adults from major and minor ethnicities in Malaysia that are closely matched to the Malaysian ethnic profile. This in turn, might reflect the snapshot of Malaysian current population regardless of their underlying health conditions as captured by walk-in patients attending primary care clinic. In addition, the height and weight were directly measured during the survey, hence, providing reliable BMI. This study also used Asian BMI categories cut off point which gave a better overview of Asian population BMI. This information was provided to the respondents at the site of study could potentially correct their misperceptions of body weight and create awareness and motivate them to pursue healthy weight loss behaviors. Despite that, this study is not without limitations. The findings of this study which predominantly from lower income group category has its own limitation as it cannot be extrapolated to general population. Although IPAQ is a reliable tool, it is self-reported by respondents; hence, recall bias might exist and the patient might underreport or over report their activities. This is also a cross-sectional study; therefore, causal and effect relationship cannot be ascertained. The findings of this study, however, could be the foundation for further in-depth analysis on perception of bodyweight interrelated with behavioral factors such as eating habits, knowledge, and awareness of obesity and its complication. The Asian BMI categories cut off points used in this study might be a limitation in terms of comparability with previous studies, whereby the majority of them used WHO classification. Hence, the number of overweight and obese people might be larger compared with previous studies.
Conclusion
High proportion of our population were overweight and obese and had misperceptions of their body weight with the majority underestimating their weight. This study confirmed a positive association between measured BMI and the body weight misperception. Therefore, it is important to rectify any misperceptions on body weight and create awareness of their actual body weight status in order to promote healthier lifestyles.
Acknowledgments
The authors would like to thank Dr Salmah binti Noordin (Senior Family Medicine Specialist of Batu 9 Health Clinic) for the cooperation and support throughout the study period.
Footnotes
Declaration of Conflicting Interests: The author(s) declared no potential conflicts of interest with respect to the research, authorship, and/or publication of this article.
Funding: The author(s) received no financial support for the research, authorship, and/or publication of this article.
ORCID iD: Noor Azah Abd Aziz  https://orcid.org/0000-0002-7204-6097
References
- 1. WHO Expert Consultation. Appropriate body-mass index for Asian populations and its implications for policy and intervention strategies. Lancet. 2004;363:157-163. [DOI] [PubMed] [Google Scholar]
- 2. Institute for Public Health. National health and morbidity survey 2015: non-communicable diseases, risk factors and other health problems. Volume II. http://www.moh.gov.my/moh/resources/nhmsreport2015vol2.pdf. Published 2015. Accessed February 3, 2020.
- 3. Zainuddin AA, Manickam MA, Baharudin A, et al. Self-perception of body weight status and weight control practices among adolescents in Malaysia. Asia Pac J Public Health. 2014;26(5 suppl):18S-26s. [DOI] [PubMed] [Google Scholar]
- 4. Robinson E, Oldham M. Weight status misperceptions among UK adults: the use of self-reported vs measured BMI. BMC Obes. 2016;3:21. [DOI] [PMC free article] [PubMed] [Google Scholar]
- 5. Yan H, Wu Y, Oniffrey T, et al. Body weight misperception and its association with unhealthy eating behaviors among adolescents in China. Int J Environ Res Public Health. 2018;15:E936. [DOI] [PMC free article] [PubMed] [Google Scholar]
- 6. Sidek S, Hanapiah NNA. Body image perceptions and weight loss behavior among young adults. Int J Allied Health Sci. 2018;2:426-434. [Google Scholar]
- 7. Ahmad N, Ariza Z, Nawi AM. Body weight misperception among Malaysian adults in rural area. Brunei Int Med J. 2015;11:147-154. [Google Scholar]
- 8. Tan ZY, Yim HS. Weight status, body image perception and physical activity of Malay housewives in Kampung Chengkau ulu, Negeri Sembilan. Int J Adv Sci Arts. 2010;1:11. [Google Scholar]
- 9. Centers for Disease Control and Prevention. Youth risk behavior surveillance system (YRBSS): YRBS questionnaire content—1991-2017. https://www.cdc.gov/healthyyouth/data/yrbs/pdf/2017/YRBS_questionnaire_content_1991-2017.pdf. Published August 2016. Accessed February 3, 2020.
- 10. Kim Y, Austin SB, Subramanian SV, Kawachi I. Body weight perception, disordered weight control behaviors, and depressive symptoms among Korean adults: the Korea National Health and Nutrition Examination Survey 2014. PLoS One. 2018;13:e0198841. [DOI] [PMC free article] [PubMed] [Google Scholar]
- 11. Duncan DT, Wolin KY, Scharoun-Lee M, Ding EL, Warner ET, Bennett GG. Does perception equal reality? Weight misperception in relation to weight-related attitudes and behaviors among overweight and obese US adults. Int J Behav Nutr Phys Act. 2011;8:20. [DOI] [PMC free article] [PubMed] [Google Scholar]
- 12. Monteagudo C, Dijkstra SC, Visser M. Self- perception of body weight status in older Dutch adults. J Nutr Health Aging. 2015;19:612-618. [DOI] [PubMed] [Google Scholar]
- 13. Boo S. Body mass index and weight loss in overweight and obese Korean women: the mediating role of body weight perception. Asian Nurs Res (Korean Soc Nurs Sci). 2013;7:191-197. [DOI] [PubMed] [Google Scholar]