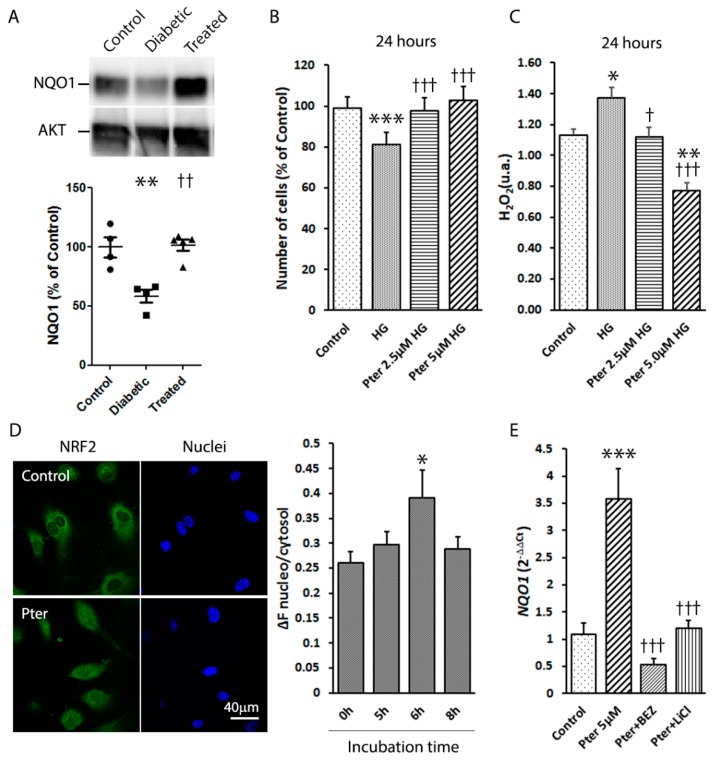
Figure 5.
Effect of pterostilbene on NRF2 activation. (A) A Western blot was used to detect the expressions of NQO1 in retinas. Data are presented as mean ± SEM (at least n = 4 in each group). A one-way ANOVA and a Newman-Keuls multiple comparison test were used. ** p < 0.01; versus the control group; †† p < 0.01 versus the diabetic group. (B) HREC were treated for 24 h with Pter (2.5 μM and 5 μM) at high (30 mM) glucose concentrations. Statistical analyses were performed by a one-way ANOVA, followed by Tukey’s test. *** p < 0.001 versus the control group. ††† p < 0.001 versus the high glucose group. (C) Hydrogen peroxide was determined in HREC medium after 24 h of incubation with Pter (2.5 μM and 5 μM) at high (30mM) glucose concentrations. An ANOVA followed by Tukey’s post hoc test, was used to assess significant differences between the experimental conditions * p < 0.05; ** p < 0.01; versus the control group. † p < 0.05; ††† p < 0.001 versus the high glucose group. (D) NRF2 translocation was detected by confocal microscopy in HREC. Cells were incubated with Pter 5 μM and fixed with 4% paraformaldehyde at 0, 5, 6 and 8 h. NRF2 was detected by immunocytochemistry and NRF2 translocation was evaluated by the ImageJ software. A representative image after 6 h of incubation with Pter. Data were analysed by a one-way ANOVA, followed by Tukey’s test. * p < 0.05 versus the control group (0 h) (E) HREC were incubated in the presence of DMSO (control), Pter 5 μM, Pter (5 uM) + BEZ235 (10 nM), and Pter (5 uM) + LiCl (20 mM) for 24 h. The RNA levels of NQO1 were determined by qRT-PCR normalised to the β-Actin mRNA levels. Data are presented as mean ± SEM (at least n = 3 in each group). Differences among groups were assessed by a one-way ANOVA, followed by Tukey’s test. *** p < 0.001 versus the control group. ††† p < 0.001 versus the Pter group.

