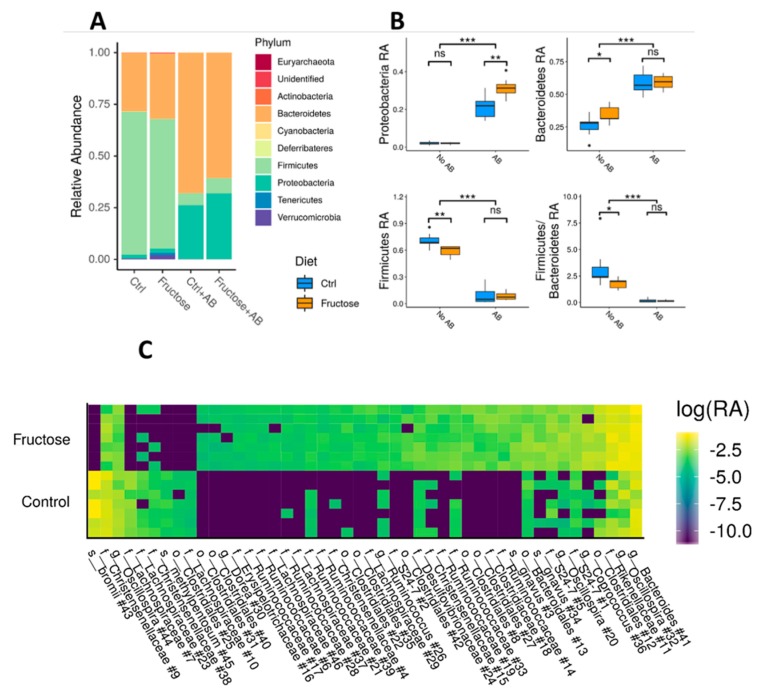
Figure 4.
Specific taxonomic differences between groups. (A) Median taxonomic relative abundance at the phylum level, by diet and antibiotics intake. (B) Boxplots of Proteobacteria, Firmicutes, Bacteroidetes, and Firmicutes/Bacteroidetes relative abundance (RA), between rats that took antibiotics and rats that did not, both for high fructose diet and controls. Asterisks indicate significant differences (Mann Whitney test: ***—p < 0.001, **—p < 0.01, *—p < 0.05, ns = not significant). (C) A heatmap representing taxa SVs that are significantly different between high fructose and control rats. Each column represents different taxa and each row a different sample. Log10 of taxa relative abundance is shown. Results are shown for significant SVs as inferred by a MaAsLin2 analysis (see methods), and the taxonomic classification of each SV is marked at the lowest level available. SVs shown are sorted by the effect size and the number of each SV, as marked in Table S1.

