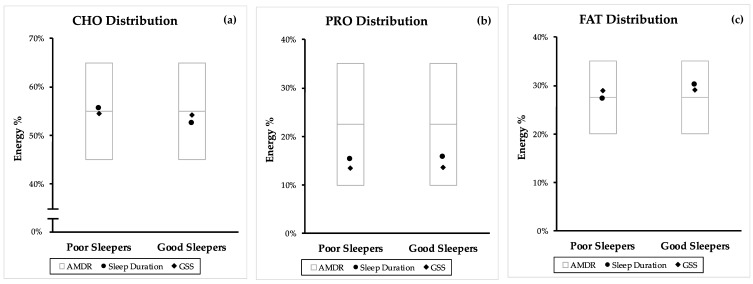
Figure A2.
Comparison of poor and good sleep quality macronutrient distribution from cross-sectional (CS) studies with the accepted macronutrient distribution range (AMDR). Macronutrient distribution are mean energy percentage values generated from sleep duration and PSQI. (a) Carbohydrate (CHO) distribution, (b) protein (PRO) distribution, and (c) fat (FAT) distribution. AMDR is presented as area within the box plot.

