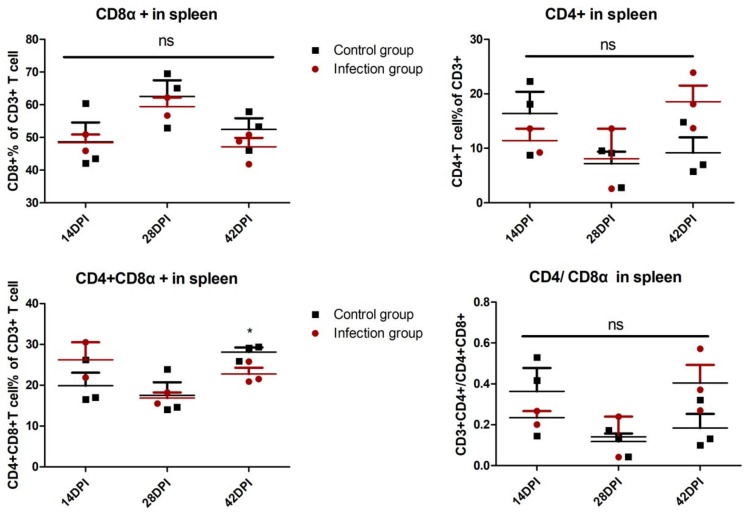
Figure 4.
Analysis of T lymphocyte percentage in spleen. Spleen single-cell suspensions derived from chickens of infected and control groups were isolated to detect the T lymphocyte percentage. Every dot stands for one chicken. The unpaired t-test was used for statistical comparison. ns p > 0.05, * p < 0.05.. Each sample collected 2 × 10⁵ cells for flow cytometric analysis.

