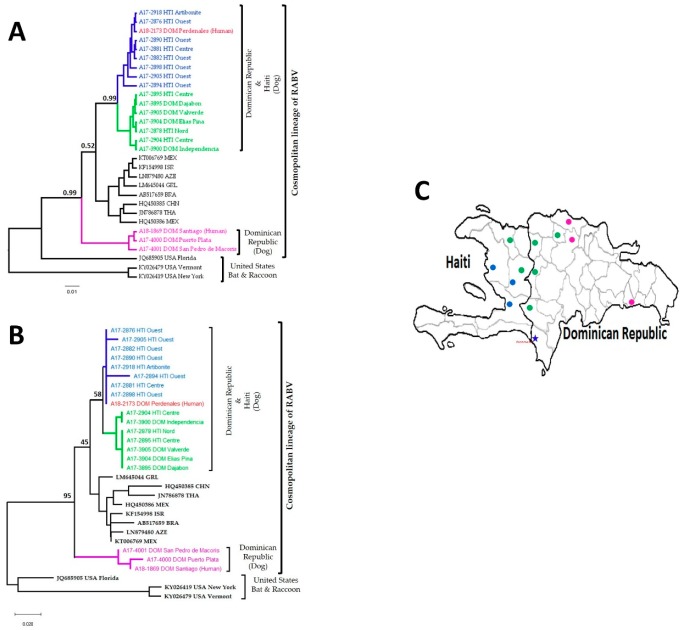
Figure 3.
Molecular phylogenetic analysis using 115 bp sequences generated from LN34 amplicons. (A) The Bayesian evolutionary analysis sampling tree (BEAST) showed that the human rabies case (A18_2173) grouped with samples from HTI. The major nodes are labelled with the posterior probabilities. * Posterior values > 0.5 are shown at each node. (B) The neighbor joining tree agreed with the BEAST tree for the major clades and showed strains with identical sequences. The selected nodes are labelled with bootstrap values. (C) The geographic location of samples from HTI and DOM. The blue star is the location where the patient was infected.

