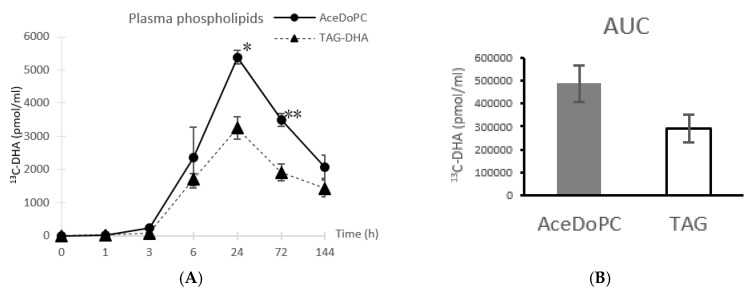
Figure 1.
13C-DHA in plasma phospholipids from AceDoPC compared to TAG-DHA after 50 mg DHA intake in both esterified forms, at different times post-intake (A). Results are expressed in pmol of 13C-DHA per mL of plasma, presented as means ± SEM from three values. (B) represents area under curves (AUC) from Figure 1A. Stars indicate significant differences within each time, according to the student t test.

