

Abstract
Aim:
This study aimed to identify the effect of the insulin-like growth factor 1 (IGF1) gene on growth, to uncover the genetic marker at the IGF1 gene, and to predict growth performance by analyzing growth models of Kejobong goats based on their genotype.
Materials and Methods:
DNA and records of body weight (BW) and body measurements (BM) of Kejobong goats were collected, the IGF1 gene was amplified from the DNA template by polymerase chain reaction (PCR); the PCR products were then sequenced to determine single nucleotide polymorphisms (SNP). Linear mixed model (LMM) was used to analyze the association between SNP and growth traits. Four non-linear growth models were analyzed using non-LMM to describe the growth model and to compare the growth within genotypes.
Results:
An SNP at intron 4 (g5752G→C) genotyped into GG and CC was significantly associated with BW and BM. Goats of genotype GG had a significantly higher BW and BM (p<0.05) than those of genotype CC. Growth analysis showed that the von Bertalanffy model was the most fit for describing BW, the Brody model for chest width and hip height, the Gompertz and Logistic models for heart girth, and the von Bertalanffy and Gompertz models for hip width.
Conclusion:
An SNP at intron 4 of the IGF1 gene was associated with the growth trait and was usable as a genetic marker candidate for improvement of growth traits of Kejobong goats while von Bertalanffy model provides proper and accurate estimates of parameters to describe the growth performance of Kejobong goats.
Keywords: genetic markers, goat, growth analysis, growth traits, insulin-like growth factor 1
Introduction
Growth traits have always attracted much interest in the production of meat animals. In Indonesia, most farmers have maintained traditional livestock farming systems and have depended on local livestock for their main source of income. The Kejobong goat is known as an indigenous Indonesian breed raised by a semi-intensive animal farming system by local farmers. This goat has been confirmed to be the progeny of a cross between Kacang and Etawah grade goats [1,2]. The Kejobong goat is known not only for its prolific traits but also for its high rate of growth, good carcass composition, and good reproductive performance [3]. Nonetheless, the genetic improvement of Kejobong goats has been slow because only a few genetic studies have been done on its growth traits.
One of the main goals with meat animals is identifying those with superior growth performance and using them in a cyclical system of animal breeding. Due to a lack of animal pedigree and production records, it is difficult to improve the performance of local breeds over a short period of time by traditional breeding programs. Recently, therefore, major breeders have focused on using DNA markers for improving breeds through marker-assisted selection (MAS) and/or marker-assisted introgression. The first step in this approach is to identify genes that determine some markers of growth performance. Growth performance is the most common trait used for evaluating the economic value of animals. Physiologically, growth is the effect of a complex process that regulates neuroendocrine pathways, among which the somatotrophic axis (growth hormone/insulin-like growth factor 1 [IGF1] axis) plays a substantial part in postnatal growth and metabolism in mammals [4]. IGF1, one of the somatotrophic axis components, encourages cell proliferation, skeletal growth, and protein synthesis as anabolic processes [5]. The IGF1 gene sequence in goats has been determined to be 6,784 bp long (D26119), located on chromosome 5 and comprising three leader exons (1w, 1, and 2) and three exons (3, 4, and 6) [6]. Consequently, the IGF1 gene is expected to be one of the candidate gene markers associated with growth traits.
The growth of animals is evaluated by aspects such as weight at maturity, growth rate, and growth acceleration, which can be illustrated with the growth model. The growth model can also describe and express the animal’s maximal genetic potential under existing environmental conditions [7]. Moreover, modeling the growth of animals can quantify the animal’s optimal growth and determine the right slaughtering time. Thus, analysis of the growth model provides worthwhile information for designing selection programs and for planning farm management strategies and decision-making on genetic selection by predicting future growth at any age [7,8].
This study aimed to identify the effect of the IGF1 gene on growth, to uncover the genetic marker at the IGF1 gene, and to predict growth performance by analyzing growth models of Kejobong goats.
Materials and Methods
Ethical approval
The protocol was based on the standard rule of animal treating as appointed in the Republic of Indonesia’s law, that is, number 41, 2014.
Sample collection and phenotypic data
A total of 35 blood samples and phenotypic data on the Kejobong goat were collected from Purbalingga District, Central Java Province, Indonesia. Samples were taken from 10 bucks and 25 does. The sampling and research locations were based on purposive sampling methods and selected based on the density of the Kejobong goat population. The animals were raised under semi-intensive management and traditional farming procedures by four local livestock-farming groups.
Body weight (BW) of the goats was taken with a hanging scale. Chest width (CW), hip height (HH), and hip width (HW) were measured with a measuring stick and heart girth (HG) with a measuring tape. BW and body measurements(BM) were taken between ages 0-15 days, 16-31 days, 32-47 days, 48-63 days, 64-79 days, 80-95 days, 96-111 days, and 112-127 days. Blood samples for DNA analysis drawn from the jugular venous with a 3 cc spuit and collected in Vacutainer blood collection tubes with an anticoagulant (EDTA).
DNA extraction, polymerase chain reaction (PCR), and sequencing
DNA was extracted with a gSYNC DNA Mini Kit (Geneaid Biotech Ltd.), according to the manufacturer’s standard protocol. IGF1 exon 4 was amplified using forward primer 5’-gctgggtgtagcagtgaaca -3’ and reverse primer 5’- gttgcttcagccgcataact -3’ [9]. PCR was carried out in a total volume of 50 µL comprising 25 µL KAPA2G Fast ReadyMix + Dye (Kapa Biosystems Ltd.), 1 µL forward primer and 1 µL reverse primer (Integrated DNA Technologies Pte. Ltd.), 20 µL double-distilled water, and 3 µL DNA template. Amplification (PCR) was carried out with the following conditions: Pre-denaturation (at 94°C for 5 min); 35 cycles of denaturation (at 94°C for 30 s), primer annealing (at 56°C for 30 s), elongation (at 72°C for 30 s), and post-elongation (at 72°C for 10 min). PCR products were then electrophoresed with 1% agarose gel at 100 V for 20 min and visualized under ultraviolet transilluminator. The amplicon was then purified and sequenced through the 1st Base DNA Sequencing Services, Singapore.
Statistical analysis
Allele frequencies were estimated by the gene-counting method, as follows:
p2+2pq+q2 = 1,
Where p is allele frequency of the first allele and q allele frequency of the second allele.
Genotype distribution was tested for determining Hardy-Weinberg Equilibrium (HWE) by Chi-square analysis, as follows:

Where χ2 is the Chi-square value; oi the observed value of genotype frequency, ei the expected value of genotype frequency, χ2 the table using 5% significance level for the HWE test.
Heterozygosity (H) was estimated, as follows:

Where H is the value of heterozygosity and pi the frequency of the ith of k alleles.
The IGF1 gene sequence was analyzed with the use of molecular evolutionary genetics analysis version 6.0 [10] to uncover polymorphisms in the animals. Clustal W was used to align the sequence [11]. The IGF1 gene sequence of Kejobong goats was also aligned with the Capra hircus IGF1 gene sequence (D26119) from GenBank [6].
The association between single nucleotide polymorphisms (SNP) and BW/BM was analyzed with the use of the linear mixed model (LMM) of statistical analysis system (SAS) version 9.3 [12]. The model used was
yijkl = µ+Gi+Fj+uk+b1ɑijkl+b2ɑ2ijkl+eijkl
Where yijkl is the observed value of a dependent variable (BW/BM); µ the overall mean of the population; Gi the fixed effect of ith genotype (i = 1 [GG], 2 [GC], 3 [CC]); Fj the fixed effect of jth farm group (j = 1, 2, 3, 4); uk the random effect of kth individual; b1 and b2 the linear and quadratic coefficients of partial regression, respectively; ɑijkl age in days of a covariate and eijkl the random residual for Yijkl. The difference in the least-square means of the genotypes was determined by the Tukey-Kramer test [13].
In this study, the following four non-linear models used for describing animal growth models were compared: Brody [14], von Bertalanffy [15], Logistic [16], and Gompertz [17] (Table-1).
Table-1.
Growth models for constructing a growth model.
| Model | Function* |
|---|---|
| Brody | y=A* (1–B exp-C*age) |
| Von Bertalanffy | y=A* (1–B exp-C*age)3 |
| Logistic | y=A/(1+B exp-C*age) |
| Gompertz | y=A*exp (–B exp-C*age) |
y=Observed body weight/body measurements, A=The estimated of mature body weight/body measurements, B=The integration constant, C=The growth rate constant, Age, the animal age in day and exp, Napier’s constant the base of the natural logarithm (2.7183)
To obtain growth model parameters, non-LMM (NLMM) analysis was performed with SAS version 9.3 [12] for estimating parameters of fixed and random effects. BW/BM as dependent variables are influenced by quantitative (age) and qualitative (group farm/type of birth and genotype) variables. Therefore, dummy variables have been created to assess the effect of qualitative variables on dependent variables and regression [18].
Under the assumption of normality of random residuals, alternative models were evaluated by the −2 log-likelihood, Akaike information criterion (AIC) [19], Bayesian information criterion (BIC) [20], and the residual variances (σ2e). AIC and BIC were calculated, as follows:


Where n is the number of observations; SSE the sum square errors, and k the number of parameters. Smaller values of AIC, BIC, or σ2e indicate the best fit of the model to the data.
Results
PCR showed that the IGF1 gene was well amplified. The amplification generates about 322 bp sequences (Figure-1). After alignment and blast checking, the sequences comprised 71 bp of partial intron 3, 182 bp of exon 4, and 69 bp of partial intron 4. The SNP was observed in the animals at intron 4 as a transversion mutation. Likewise, when the sequence was aligned with D26119 [6], SNP was identified at the same location (Figure-2) g5752G→C, a parsimonious form designated here as GG and CC genotypes (Figure-3). The estimated allele and genotype frequency of the IGF1 gene in Kejobong goats were 43% and 57% for G and C, respectively. The frequency of genotype GG and CC was 43% and 57%, respectively, while that of genotype GC was not observed in this study. The genotype distribution of Kejobong goats was statistically different (p<0.05) from HWE, and the frequency of heterozygosity was 49% (Table-2).
Figure-1.

Polymerase chain reaction result.
Figure-2.

Alignment result.
Figure-3.
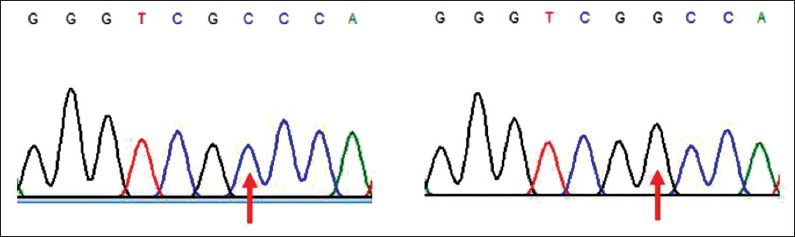
Identified single nucleotide polymorphisms.
Table-2.
Estimated allele and genotype frequency.
| Variable measured | Genotype | Allele | H | χ2 | |||
|---|---|---|---|---|---|---|---|
| GG | GC | CC | G | C | |||
| Frequencies | 0.43 | 0.00 | 0.57 | 0.43 | 0.57 | 0.49 | 35.00* |
| Observation | 15.00 | 0.00 | 0.20 | ||||
| Expectation | 6.43 | 17.14 | 11.42 | ||||
H=Heterozygosity; χ2=Chi-square;
= p<0.05
The test of significance showed that the fixed effect of genotype together with group effect of farm and linear and quadratic coefficients of age were statistically significant (p<0.05) in BW, CW, HW, and HG. On the other hand, the fixed effect of genotype, type of birth, and linear and quadratic coefficients of age were statistically significant (p<0.05) in HH (Table-3). Furthermore, statistical analysis of the association of genotype with BW and BM showed that animals of genotype GG were significantly heavier and larger (p<0.05) than animals of genotype CC: The superiority of BW7 was 1.89 kg (GG 11.05 kg vs. CC 9.16 kg) and the superiority of BW8 was 1.86 kg (GG 11.76 kg vs. CC 9.9 kg). Nonetheless, no significant differences were observed in BW1-BW6, although animals of genotype GG tended to be heavier. In terms of BM, significant differences were observed at the following ages: CW3, CW7, CW8, HH4, HH7, HW7, HW8, HG2, HG4, HG5, HG7, and HG8 (Table-4).
Table-3.
Significance analysis of factors affecting body weights and body measurements.
| Traits | Effect | Degree of freedom | f-value | p-value |
|---|---|---|---|---|
| BW | Genotype | 1 | 4.61* | 0.0328 |
| Group of farm | 3 | 4.42* | 0.0048 | |
| Age | 1 | 235.2* | <0.0001 | |
| Age*age | 1 | 19.33* | <0.0001 | |
| CW | Genotype | 1 | 8.26* | 0.0044 |
| Group of farm | 3 | 5.86* | 0.0007 | |
| Age | 1 | 39.44* | <0.0001 | |
| Age*age | 1 | 10.58* | 0.0013 | |
| HH | Genotype | 1 | 5.46* | 0.0202 |
| Type of birth | 2 | 3.14* | 0.0346 | |
| Age | 1 | 275.95* | <0.0001 | |
| Age*age | 1 | 62.75* | <0.0001 | |
| HW | Genotype | 1 | 4.38* | 0.0397 |
| Group of farm | 3 | 2.21* | 0.0875 | |
| Age | 1 | 60.78* | <0.0001 | |
| Age*age | 1 | 12.50* | 0.0005 | |
| HG | Genotype | 1 | 5.37* | 0.0214 |
| Group of farm | 3 | 4.54* | 0.0041 | |
| Age | 1 | 362.96* | <0.0001 | |
| Age*age | 1 | 74.62* | <0.0001 |
BW=Body weight, CW=Chest width, HH=Hip height, HW=Hip width, HG=Heart girth
Table-4.
Estimated genotypic effect on body weights and body measurements by linear mixed model analysis.
| Traits and measurement at eight periods | Genotypes | |
|---|---|---|
| GG | CC | |
| Body weight | ||
| BW1 | 4.12±0.21 | 3.78±0.19 |
| BW2 | 5.32±0.27 | 4.96±0.25 |
| BW3 | 6.62±0.35 | 5.98±0.33 |
| BW4 | 8.02±0.42 | 7.02±0.38 |
| BW5 | 9.19±0.47 | 7.80±0.43 |
| BW6 | 10.10±0.52 | 8.57±0.48 |
| BW7 | 11.05±0.56a | 9.16±0.52b |
| BW8 | 11.76±0.60a | 9.90±0.55b |
| Chest width | ||
| CW1 | 8.60±0.30 | 8.61±0.28 |
| CW2 | 10.56±0.64 | 9.63±0.58 |
| CW3 | 10.40±0.25a | 9.52±0.23b |
| CW4 | 10.78±0.26 | 10.12±0.23 |
| CW5 | 11.19±0.27 | 10.38±0.24 |
| CW6 | 11.40±0.27 | 10.59±0.24 |
| CW7 | 11.87±0.27a | 10.58±0.25b |
| CW8 | 12.07±0.31a | 10.80±0.29b |
| Hip height | ||
| HH1 | 37.37±1.39 | 35.75±0.88 |
| HH2 | 40.33±1.15 | 39.09±0.72 |
| HH3 | 43.19±1.30 | 42.46±0.82 |
| HH4 | 47.53±1.14a | 44.36±0.71b |
| HH5 | 47.85±1.23 | 46.15±0.77 |
| HH6 | 49.33±1.22 | 47.24±0.77 |
| HH7 | 51.26±1.33a | 48.01±0.84b |
| HH8 | 52.59±1.41 | 50.04±0.89 |
| Hip width | ||
| HW1 | 8.13±0.26 | 7.76±0.24 |
| HW2 | 9.05±0.25 | 8.01±0.23 |
| HW3 | 9.33±0.25 | 8.65±0.22 |
| HW4 | 9.60±0.52a | 9.85±0.48 |
| HW5 | 10.07±0.30 | 9.98±0.27 |
| HW6 | 10.31±0.27 | 9.96±0.25 |
| HW7 | 11.06±0.28a | 9.89±0.26b |
| HW8 | 11.55±0.26a | 10.11±0.24b |
| Heart girth | ||
| HG1 | 32.54±0.84 | 31.96±0.79 |
| HG2 | 36.75±0.78a | 34.07±0.71b |
| HG3 | 38.75±0.79 | 37.23±0.73 |
| HG4 | 42.03±0.80a | 38.94±0.73b |
| HG5 | 44.84±0.88a | 40.57±0.80b |
| HG6 | 44.86±1.01 | 43.15±0.93 |
| HG7 | 46.37±0.82a | 43.48±0.76b |
| HG8 | 48.21±0.88a | 44.29±0.80b |
In the same row, values with different superscripts are significantly different (p<0.05)
In this study, NLMM was used to compare the growth models of the two genotypes in Kejobong goats. Estimated parameters of non-linear growth model and the result of fitness statistics for BW, HG, CW, HH, and HW, in Table-5, showed that the von Bertalanffy model was the best for describing BW, the Brody model for CW and HH, the Gompertz and Logistic models for HG, and the von Bertalanffy together with the Gompertz model for HW.
Table-5.
Estimated parameters of growth and goodness of fit for four different growth model for body weight and body measurements.
| Variable | Parameter | Model | |||
|---|---|---|---|---|---|
| Brody | Von Bertalanffy | Logistic | Gompertz | ||
| Body weight | A | 26.6165±0.8838 | 24.5848±0.4119 | 23.3771±0.2494 | 24.119±0.3392 |
| B | 0.8293±0.01063 | 0.394±0.006254 | 2.5904±0.07293 | 1.4256±0.02609 | |
| C | 0.007131±0.00103 | 0.01416±0.00111 | 0.02815±0.001329 | 0.01766±0.001158 | |
| σ2u | 8.0152±2.3596 | 5.1533±1.3331 | 3.7526±0.9346 | 4.5865±1.1652 | |
| σ2e | 0.3224±0.02913 | 0.3213±0.02903 | 0.3263±0.02948 | 0.3218±0.02907 | |
| GG | −3.6102±0.8251 | −4.9019±0.5525 | −5.671±0.4451 | −5.1983±0.5074 | |
| CC | −6.3733±0.6891 | −7.1133±0.5099 | −7.552±0.4252 | −7.2827±0.4759 | |
| −2 Log-likelihood | 607.7 | 606.9 | 610.7 | 607.2 | |
| AIC | 629.7 | 628.9 | 632.7 | 629.2 | |
| BIC | 646.8 | 646.0 | 6.49.8 | 646.3 | |
| Heart girth | A | 54.4743±0.7187 | 53.2477±0.6747 | 53.3279±0.4993 | 52.5766±0.5957 |
| B | 0.4103±0.01058 | 0.1565±0.004488 | 0.6127±0.01979 | 0.5006±0.01461 | |
| C | 0.01420±0.001606 | 0.01654±0.001683 | 0.02211±0.001747 | 0.01798±0.001687 | |
| σ2u | 7.7466±2.0471 | 10.8093±4.328 | 7.0365±1.8202 | 7.4281±1.9557 | |
| σ2e | 2.9037±0.2623 | 2.8952±0.2609 | 2.9038±0.2623 | 2.9024±0.2622 | |
| GG | −0.1247±0.7312 | 0.3109±0.8102 | −0.6902±0.6498 | 0.6090±0.6901 | |
| CC | −3.001±0.6906 | −2.6632±0.7726 | −3.5819±0.6211 | −2.6324±0.6511 | |
| −2 Log-likelihood | 1186.7 | 1188.6 | 1186.6 | 1186.5 | |
| AIC | 1208.7 | 1210.6 | 1208.6 | 1208.5 | |
| BIC | 1225.8 | 1227.7 | 1225.7 | 1225.7 | |
| Chest width | A | 13.2044±0.2047 | 13.1842±0.1938 | 14.0087±0.1767 | 13.6037±0.1890 |
| B | 0.3014±0.02035 | 0.1105±0.008294 | 0.4026±0.03666 | 0.3477±0.02746 | |
| C | 0.02339±0.006807 | 0.02526±0.0066994 | 0.02897±0.007371 | 0.02619±0.007088 | |
| σ2u | 0.3148±0.1220 | 0.3127±0.1212 | 0.3093±0.1198 | 0.3117±0.1208 | |
| σ2e | 1.2031±0.1087 | 1.2046±0.1088 | 1.2076±0.1091 | 1.2054±0.1089 | |
| GG | 0.2807±0.1912 | 0.2693±0.1871 | −0.3206±0.1809 | −0.02153±0.1853 | |
| CC | −0.6763±0.1736 | −0.6851±0.1709 | −1.2707±0.166 | −0.9747±0.1697 | |
| −2 Log-likelihood | 880.9 | 881.2 | 881.9 | 881.4 | |
| AIC | 902.9 | 903.2 | 903.9 | 903.4 | |
| BIC | 920.0 | 920.4 | 921.0 | 920.5 | |
| Hip height | A | 60.9893±0.6814 | 60.7061±0.6247 | 58.01±0.551 | 58.3122±0.6023 |
| B | 0.3611±0.009661 | 0.1349±0.003943 | 0.5129±0.01791 | 0.4291±0.01311 | |
| C | 0.01687±0.002045 | 0.01922±0.002103 | 0.02395±0.002234 | 0.02040±0.002134 | |
| σ2u | 7.9053±2.0794 | 7.7528±2.0352 | 7.5263±1.9715 | 7.6877±2.0166 | |
| σ2e | 3.9857±0.3601 | 3.9963±0.3610 | 4.0208±0.3633 | 4.0021±0.3616 | |
| GG | −1.9251±0.7249 | −2.0781±0.7042 | −0.9427±0.6775 | −0.7799±0.6961 | |
| CC | −4.6856±0.5687 | −4.8157±0.5513 | −3.6473±0.5289 | −3.5079 | |
| −2 Log-likelihood | 1269.5 | 1270.2 | 1271.7 | 1270.5 | |
| AIC | 1289.5 | 1290.2 | 1291.7 | 1290.5 | |
| BIC | 1305.1 | 1305.7 | 1307.2 | 1306.1 | |
| Hip width | A | 12.7384±0.3135 | 14.7988±0.2714 | 12.5354±0.2168 | 13.4782±0.2548 |
| B | 0.3621±0.02307 | 0.1349±0.009079 | 0.51±0.03891 | 0.4284±0.0297 | |
| C | 0.01499±0.004015 | 0.01737±0.00421 | 0.02213±0.00436 | 0.01855±0.004177 | |
| σ2u | 0.5232±0.1647 | 0.5104±0.159 | 0.4918±0.1515 | 0.505±0.1568 | |
| σ2e | 0.7385±0.06676 | 0.7385±0.06675 | 0.7385±0.06676 | 0.7385±0.06675 | |
| GG | 0.4472±0.2464 | −1.0273±0.2289 | 0.3342±0.2075 | −0.1896±0.2222 | |
| CC | −0.3087±0.2203 | −1.7739±0.2073 | −0.3988±0.1915 | −0.9322±0.2023 | |
| −2 Log-likelihood | 765.3 | 765.3 | 765.3 | 765.3 | |
| AIC | 787.3 | 787.3 | 787.3 | 787.3 | |
| BIC | 804.5 | 804.4 | 804.5 | 804.4 | |
AIC=Akaike information criterion, BIC=Bayesian information criterion
Discussion
In this study, the lack of HWE beside high heterozygosity showed that the population was under selection pressure. These goats are not mated randomly with respect to locus and experience migration, natural selection, mutation, or genetic drift [21]. In this study, the absence of GC heterozygous genotypes is suspected because animals of heterozygous genotypes have smaller BW than those of animals of homozygous genotype. Hence, breeders generally tend to choose or maintain animals that have larger BW and culling the animal that has a smaller BW. Animals of genotype GG showed higher BW (p<0.05) than those of genotype CC, however, that became evident close to weaning age (BW7 and BW8); BM also tended to demonstrate significant differences only in the last two measurements (96-111 days old and 112-127 days old). These results were consistent with those of a previous study [22], where significant differences among genotypes in IGF1 show at 3-12 months old for BW of buffalos, whereas at 0-3 months old, no significant differences appeared. In this study, the high weaning weight was assumed to produce a high rate of post-weaning weight gain, which is in accordance with the finding that IGF1 concentration gradually increases toward weaning age and decreases after maturity [23].
In this study, SNP found at intron 4 had an effect on BW and BM at late ages. Although the intron is a genome in the non-coding region, it plays an important role during transcription, such as transcription rate, initiation, termination, regulation, and alternative splicing [24]. Therefore, SNP at the intron may affect the structure and function of the protein, gene expression levels and animal psychological metabolism, all of which influence animal growth. In this study, SNP was located as described in Nanjiang Huang goats [9] and in Markhoz goats [25]. Another study has emphasized the role of SNPs located in the intron region in nine Indian goat breeds, disclosing two of eight novel SNPs within the intron of the IGF1 gene that has a significant association with BW at different ages [26]. In this study, therefore, SNP at intron position (g5752G→C) was considered one of the genetic markers for the selection of BW and BM in Kejobong goats.
Parameters AIC, BIC, and −2 log-likelihood for BW implied that the lowest value in the von Bertalanffy model was the best fitted to the growth model (Table-5). This differed from the Gompertz and Brody models which clearly explain the growth of Beetal goats [8]. There were diverse results in choosing the best model that can be attributed to the variations in mathematical formulae of equations, the number of records, and the amount of data observed and record collecting intervals [27,28]. In this study, the Brody model showed the lowest values of AIC, BIC, and −2 log-likelihood in CW and HH, compared with the von Bertalanffy, Logistic, and Gompertz models. The foregoing results suggest that the Brody model is the best for estimating the CW and HH. The Gompertz model which was the best for the HG showed the lowest values of AIC, BIC, and −2 log-likelihood and was very similar to those of the Logistic model. Therefore, these models were considered as the best for describing HG in Kejobong goats. Similarly, the von Bertalanffy and Gompertz models were considered as the best for describing HW.
For describing BW, the von Bertalanffy model was the best for estimating mature BW (A) (24.58 kg), integration constant (B) (0.394), and growth rate constant (C) (0.01416), while the highest and the lowest estimated parameter A was observed under the Brody (26.61 kg) and Logistic (23.37 kg) models, indicating that Kejobong goats have a lower mature BW than Markhoz goats (30.50 kg) [29]. The best-estimated parameter A for CW and HH was 13.20 cm and 60.98 cm, respectively, while for HG it was 52.57 cm (Gompertz model) and 53.32 cm (Logistic model) and for HW it was 14.79 cm (von Bertalanffy model) and 13.47 cm (Gompertz model). The estimated value of the parameter A does not imply the highest weight attained by individuals; it only indicates the average weight of mature individuals [30]. In this study, the estimated parameter B ranged between 0.39 and 2.59 for BW, and between 0.11 and 0.61 for BM. Parameter B is a scale parameter that has no biological interpretation [31]. In the present study, parameter C showed the growth rate reaching mature BW; thus, the largest parameter C was less likely to reach a great mature BW; in other words, animals that were heavy at mature age tended to go through a slower growth rate. This result is consistent with the previous reports that large weights at maturity are associated with small growth rates [29] and that the weight at maturity and the growth rate have a highly negative genetic correlation [7]. In this study, the estimated residual variance of BW was equivalent among the models. Residual variance described the gap between the predicted value and observed value. The estimated animal variance of the BW under the Brody, von Bertalanffy, Logistic, and Gompertz models was 8.01, 5.15, 3.75, and 4.58, respectively. Animal variance indicates variability among individual animals: The higher the variance, the greater the difference among them.
Animals of genotype GG demonstrated greater BW and larger BM than those animals of genotype CC; however, significant differences were observed at only later stages of animal growth, which may be attributable to the limited number of observations, suggesting that significant differences prevailed from early stages of growth to maturity. Growth analysis under NLMM can reduce the influence of potential biases despite selective sampling and can supply supplemental parameters that characterize variation between individual animals [32]. Therefore, these considerations provide proper and accurate estimates of parameters to describe the growth performance of Kejobong goats.
Conclusion
SNP at intron 4 (g5752G→C) in the IGF1 gene is associated with growth traits and can be used as MAS for the improvement of these traits. Greater BW and larger BM were demonstrated by animals of genotype GG when they approach weaning age. The von Bertalanffy model (y = 24.58 (1–0.39 Exp–0.014age)3) was the best for describing BW, the Brody model for CW (y = 13.20 (1–0.30 Exp–0.023age)) and HH (y = 60.98 (1–0.36 Exp–0.016age), the Gompertz (y = 52.57 Exp (–0.50 Exp–0.017age)) and Logistic (y = 53.32/(1+0.61 Exp–0.02age)) models for HG, and the von Bertalanffy (y = 14.79 (1–0.13 Exp–0.017age)3) together with the Gompertz (y = 13.47 Exp (–0.42 Exp–0.018age) model for HW. Further study is needed to validate our results with a larger number of animals and recorded sample observations, especially at later stages of growth.
Authors’ Contributions
DAL: Designed the study, collected data, interpreted data analysis, drafted the manuscript; TO: Interpreted data analysis; SS: Interpreted data analysis; EP: Supervised the work; AS: Critical data analysis; EK: Supervised the work, critical construction of the manuscript. All authors read and approved the final manuscript.
Acknowledgments
This research was funded by Pendidikan Master Menuju Doktor Untuk Sarjana Unggul(Master Program of Education Leading to Doctoral Degree for Excellent Graduates), Ministry of Research, Technology, and Higher Education, Republic of Indonesia with Contract No. 315-03/UN7.5-1/PP/2017 dated May 5, 2017.
Competing Interests
The authors declare that they have no competing interests.
Publisher’s Note
Veterinary World remains neutral with regard to jurisdictional claims in published institutional affiliation.
References
- 1.Kurnianto E, Sutopo S, Purbowati E, Setiatin E.T, Samsudewa D, Permatasari T. Multivariate analysis of morphological traits of local goats in central Java, Indonesia. Iran. J. Appl. Anim. Sci. 2013;3(2):361–367. [Google Scholar]
- 2.Lestari D.A, Purbowati E, Sutopo S, Kurnianto E. Phylogenetic relationship between Kejobong goat and other goats based on Mt-DNA D-loop sequence analysis. Trop. Anim. Sci. J. 2018;41(2):85–93. [Google Scholar]
- 3.Febriana A, Sutopo S, Kurnianto E. Identification of BMP15 exon 2 for fecundity traits by PCR-RFLP and nucleotide sequences in Kejobong goat. J. Indones. Trop. Anim. Agric. 2017;42(2):220–226. [Google Scholar]
- 4.Ashpole N.M, Sanders J.E, Hodges E.L, Sontag W.E. Growth hormone, insulin-like growth factor-1 and the aging brain. Exp. Geront. 2015;68:76–81. doi: 10.1016/j.exger.2014.10.002. [DOI] [PMC free article] [PubMed] [Google Scholar]
- 5.Agguirre G.A, De Ita J.R, de la Garza R.G, Castilla-Cortazar I. Insulin-like growth factor-1 deficiency and metabolic syndrome. J. Transl. Med. 2016;14(3):1–23. doi: 10.1186/s12967-015-0762-z. [DOI] [PMC free article] [PubMed] [Google Scholar]
- 6.GenBank. Capra Hircus gIGFI Gene for Insulin-like Growth Factor-I, Complete CDS (Accession Number:D26119) Genbank. National Center for Biotechnology Information. 2018. [Last accessed on 17-12-2019]. Available from: https://www.ncbi.nlm.nih.gov/nuccore/D26119 .
- 7.Lupi T.M, Leon J.M, Nogales S, Barba C, Delgado J.V. Genetic parameters of traits associated with the growth curve in Segurena sheep. Animal. 2016;10(5):729–735. doi: 10.1017/S1751731115002773. [DOI] [PubMed] [Google Scholar]
- 8.Waheed A, Khan M.S, Ali S, Sarwar M. Estimation of growth curve parameters in beetal goats. Arch. Tierz. 2011;54(3):287–296. [Google Scholar]
- 9.Zhang C, Zhang W, Luo H, Yue W, Gao M, Jia Z. A new single nucleotide polymorphism in the IGF1 gene and its association with growth traits in the Nanjiang Huang goat. Asian-Australas. J. Anim. Sci. 2008;21(8):1073–1079. [Google Scholar]
- 10.Tamura K, Stecher G, Peterson D, Filipski A, Kumar S. MEGA6:Molecular evolutionary genetics analysis version 6.0. J. Mol. Biol. Evol. 2013;30(12):2725–2729. doi: 10.1093/molbev/mst197. [DOI] [PMC free article] [PubMed] [Google Scholar]
- 11.Thompson J.D, Higgins D.G, Gibson T.J. CLUSTAL W:Improving the sensitivity of progressive multiple sequence alignment through sequence weighting, position-specific gap penalties and weight matrix choice. Nucleic Acids Res. 1994;22(22):4673–4680. doi: 10.1093/nar/22.22.4673. [DOI] [PMC free article] [PubMed] [Google Scholar]
- 12.SAS Institute Inc. Base/STAT SAS 9.3. User's guide. Cary NC, USA: SAS Institute Inc; 2011. [Google Scholar]
- 13.Tukey J.W. Comparing individual means in the analysis of variance. Intl. Biomet. Soc. 1949;5(2):99–114. [PubMed] [Google Scholar]
- 14.Brody S. Bioenergetics and Growth;with Special Reference to the Efficiency Complex in Domestic Animals. New York: Reinhold Publishing Corporation; 1945. [Google Scholar]
- 15.Bertalanffy L.V. A quantitative theory of organic growth (inquiries on growth laws. II) Hum. Biol. 1938;10(2):181–213. [Google Scholar]
- 16.Verhulst P.F. Notice sur la loi que la population poursuit dans son accroissement. Corresp. Math. Phys. 1838;10:113–121. [Google Scholar]
- 17.Gompertz B. On the nature of the function expressive of the law of human mortality, and on a new mode of determining the value of life contingencies. Philos. Trans. R. Soc. London. 1825;115:513–585. doi: 10.1098/rstb.2014.0379. [DOI] [PMC free article] [PubMed] [Google Scholar]
- 18.Filho R, Tedeschi L.O, Rodrigues M.T, Brito L.F, Oliveira T.S. Comparing of growth curves of two genotypes of dairy goats using nonlinear mixed models. J. Agric. Sci. 2014;152(5):829–842. [Google Scholar]
- 19.Akaike H. A new look at the statistical model identification. IEEE Trans. Automat Control. 1974;19(6):716–723. [Google Scholar]
- 20.Schwarz G. Estimating the dimension of a model. Ann. Stat. 1978;6(2):461–464. [Google Scholar]
- 21.Namipashaki A, Moghadam Z.R, Pour N.A. The essentiality of reporting hardy-weinberg equilibrium calculations in population-based genetic association studies. Cell J. 2015;17(2):187–192. doi: 10.22074/cellj.2016.3711. [DOI] [PMC free article] [PubMed] [Google Scholar]
- 22.El-Magd M.A, Saleh A.A, Nafeaa A.A, El-Komy S.M, Afifi A. Polymorphism of the IGF1 gene and their association with growth traits, serum concentration and expression rate of IGF1 and IGF1R in buffalo. J Zhejiang Univ Sci B Biomed. Biotechnol. 2017;18(12):1064–1074. doi: 10.1631/jzus.B1600573. [DOI] [PMC free article] [PubMed] [Google Scholar]
- 23.Orru S, Nigro E, Mandola A, Alfieri A, Buono P, Daniele A, Mancini A, Imperlini E. A fuctional interplay between IGF1 and Adinopectin. Intl. J. Mol. Sci. 2017;18(10):1–15. doi: 10.3390/ijms18102145. [DOI] [PMC free article] [PubMed] [Google Scholar]
- 24.Chorev M, Carmel L. Review article:The function of intron. Front. Genet. 2012;55(3):1–15. doi: 10.3389/fgene.2012.00055. [DOI] [PMC free article] [PubMed] [Google Scholar]
- 25.Kurdistani Z.K, Rostamzadeh J, Rashidi A, Davis M.E. Evaluation of Insulin-like growth factor-1 gene polymorphism on growth traits and yearling fleece weight in goats. Small Rumin. Res. 2013;111(1-3):10–15. [Google Scholar]
- 26.Sharma A, Dutt G, Sivalingam J, Singh M.K, Pathodiya O.P, Khadda B.S, Dixit S.P. Novel SNPs in IGF1, GHR and IGFBP-3 genes reveal significant association with growth traits in Indian goat breeds. Small Rumin. Res. 2013;115(1-3):7–14. [Google Scholar]
- 27.Zadeh N.G.H. Modeling the growth curve of Iranian shall sheep using non-linear growth models. Small Rumin. Res. 2015;130:60–66. [Google Scholar]
- 28.Zadeh N.G.H. Comparison of non-linear models to describe the lactation curves of milk yield and composition in Iranian Holstein. J. Agric. Sci. 2014;152(2):309–324. [Google Scholar]
- 29.Kheirabadi K, Rashidi A. Modelling and genetic evaluation of Markhoz goat growth curve parameters. Small Rumin. Res. 2019;170(1):43–50. [Google Scholar]
- 30.Kurnianto E, Shinjo A, Suga D. Multiphasic analysis of growth curve of body weight in Mice. Asian-Australas. J. Anim. Sci. 1999;12(3):331–335. [Google Scholar]
- 31.Ghiasi H, Lupi T.M, Mokhtari M.S. The estimation of genetic parameters for growth curve traits in raeini cashmere goat described by Gompertz model. Small Rumin. Res. 2018;165:66–70. [Google Scholar]
- 32.Craig B.A, Schinckel A.P. Nonlinear mixed-effects model for swine growth. Prof. Anim. Sci. 2001;17(4):256–260. [Google Scholar]