Abstract
Infrared drying characteristics of kiwifruits under natural and forced drying air convection with different conditions were investigated. An experimental study along with statistical analysis aimed to evaluate quality characteristics of infrared‐dried kiwifruit slices, in terms of drying time, rehydration ratio and shrinkage as a function of infrared power levels, slice thicknesses, slice distance from the infrared lamps, and air velocity. Response surface methodology was used for optimization of drying parameters with employing desirability function. Minimum drying time, shrinkage, and maximum rehydration ratio assumed as criteria for optimizing drying conditions of kiwifruit slices were strongly dependent on the drying conditions. All operating variables had a significant effect on total responses, but slice thickness almost was the most prominent factor. The slices dried at the highest power level, the lowest distance from the Infrared lamp, the least thickness, and air velocity showed a higher rehydration capacity than slices dried at the other conditions.
Keywords: infrared drying, kiwifruit, rehydration, response surface methodology, shrinkage
The results of this research can provide a theoretical and practical basis for further design, optimization, and scale‐up of such processes and also the development of models that predict the behavior of infrared food drying.
1. INTRODUCTION
Today, the growing reduction of the use of chemical for food preservation and high rate of the popularity of high‐quality fast‐dried products with good rehydration attributes have led to renewed interest in drying (Maskan, 2001).
Owing to the low thermal conductivity of the high sugar‐containing food such as kiwifruit, heat transfer inside the inner sections of it in the falling rate period is restricted during conventional heating, which causes prolonged drying time, reduction in its physicochemical properties, and low energy efficiency (Kocabiyik, Yilmaz, Tuncel, Sumer, & Buyukcan, 2015).
During drying, a pressure unbalance produced between the inner of the material and the external pressure by eliminating moisture from the material generates contracting stresses that cause to material shrinkage (Mayor & Sereno, 2004). Rehydration, as total or partial reconstitution of water, is a criterion of the injuries to the material caused by drying (Lewicki, 1998) and to a large extent determining the final quality of the product (Mohammadi, Rafiee, Keyhani, & Emam‐Djomeh, 2008).
The processing conditions are one of the factors affecting the magnitude of shrinkage. Khraisheh, Cooper, and Magee (1997) have reported that the increase in air velocity produces less shrinkage. Prolonged exposure to high drying temperature may lead to considerable degradation of quality characteristics (Zhang, Tang, Mujumdar, & Wang, 2006).
Infrared is a suitable heating method for the production of high‐quality‐dried foods at low cost to decrease the drying time and as well as appropriate for thin layers drying of samples (Doymaz, 2014).
Some authors have illustrated that the drying time reduced significantly with increase in IR power. Some other authors found that infrared drying system is able to give better qualities of a product such as color and shrinkage (Ponkham, Meeso, Soponronnarit, & Siriamornpun, 2012).
By maximizing rehydration and minimizing operational parameters, drying time and specific energy have found the optimum drying conditions (Kocabiyik & Tezer, 2009).
Response surface methodology (RSM) employs to forecast multivariate statistical model equations for concurrent multiple optimization studies and allows an experimenter to make efficient detection of a process or system (Aghilinategh, Rafiee, Hosseinpour, Omid, & Mohtasebi, 2015).
Despite several experimental studies conducted with different drying system including investigation of quality characteristics (Maskan, 2001), simulation of process (Chen, Pirini, & Ozilgen, 2001), and modeling of the drying kinetics of kiwifruits (Simal, Femenia, Garau, & Rosselló, 2005), little data currently exist on the processing of fresh kiwifruit with IR drying system. Concerning the appropriate combinations of IR power level (IP), slice thickness (λ), slice distance from the IR lamps (Δ), and drying air velocity (V), for optimum responses in IR dryer, almost studies have not been performed up to now. Therefore, the aim of our study was to investigate the IR drying of kiwifruit slices under natural and forced drying air convection modes with respect to drying kinetics, shrinkage, and rehydration and to relate operating variables in a mathematical equation and to optimize the drying conditions of kiwifruit slices regarding to the quality parameters to determine acceptable product quality in IR drier.
2. MATERIALS AND METHODS
2.1. Materials
Kiwifruits were prepared from a local market in Amol, Iran. In order to decelerate the respiration, physiological, and chemical changes (Mohammadi, Rafiee, Keyhani, & Emam‐Djomeh, 2009), all samples were stored in a refrigerator at 4 ± 0.5°C for at least 48 hr. Prior to drying process, samples were placed outside of the refrigerator for about an hour to reach room temperature and then peeled and sliced into 2, 4, and 6 mm thick and about 40 mm diameter. The moisture content of slices before drying was measured by a moisture analyzer (A&D Company). The initial moisture content found to be around 4.7 g water/g dry solid (d.b.). The drying tests were carried out down to a final moisture content of about 0.20 d.b. similar to that reported for kiwifruit (Diamante, Durand, Savage, & Vanhanen, 2010; Doymaz, 2009).
2.2. The experimental equipment and procedures
Thin‐layer drying of kiwifruit slices was done in a laboratory scale single‐tray IR dryer at different conditions that was designed and made at the Babol Noshirvani University of Technology, Iran.
The drying chamber included an aluminum tray and an entrance door for loading and unloading the tray. Airflow can easily enter into drying chamber through holes at the bottom of the dryer and leave as natural convection through some holes provided on the two opposite walls of it. To leave airflow as forced convection, the drying chamber is replaced with a similar one equipped with a fan located on one of the walls. It is powered by a variable speed controller. Air velocity was measured by an anemometer (Airflow Development., LTD, UK) with an accuracy of ±0.1 m/s. IR lamps (4–8 × 250 W) were completely surrounded with an external cover (Radiation loss can be negligible) whose inner surfaces were covered by thick aluminum foil to reflect radiation toward slices on the tray and to provide thermal energy (Figure 1).
Figure 1.
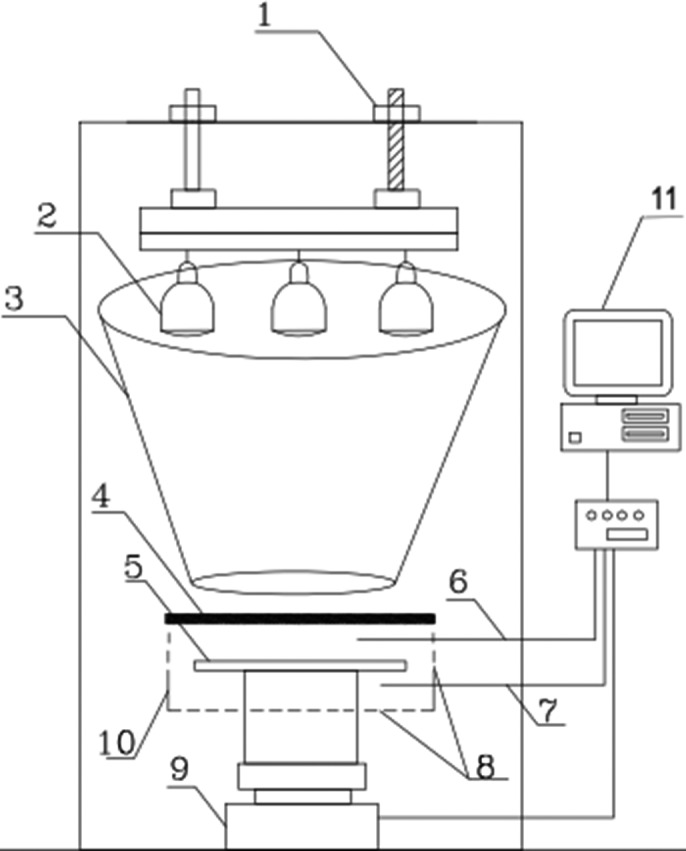
Laboratory IR dryer. 1—distance adjustment screws, 2—IR lamps, 3—cone cover, 4— quartz glass, 5—aluminum tray, 6—psychrometer, 7—anemometer, 8—holes, 9—balance, 10—drying chamber, and 11—computer
The slices were uniformly distributed on the tray and were heated to high temperature inside the chamber and then air along with moisture vapors escape through the side ventilation holes or a fan depending on the type of experiments.
To obtain the drying curves, moisture loss was continuously recorded by using a digital electronic balance of ±0.1 g accuracy (A&D Company, Japan). Prior to the drying experiments to ensure steady‐state in tests, the IR dryer was running without any slice for about 80–100 min.
2.3. Mathematical modeling of drying
Drying curves provide very important information with respect to the mechanisms of moisture movement (Seremet, Botez, Nistor, Andronoiu, & Mocanu, 2016). Equation (1) shows the moisture content of slices at any time of drying (Mt, g water/g dry solid) (da Silva, Precker, & Lima, 2009):
| (1) |
where, Wt, and Wdm are the weights of the kiwifruit slices at any time of drying and the dry solid of them (g), respectively.
Moisture ratio (MR) represents the existing moisture content at any time in the kiwifruit slices to the amount of initial moisture and was calculated using Equation (2):
| (2) |
Due to the relatively small equilibrium moisture content (Me) compared to initial moisture content (M0) at IR drying process (Me), is considered zero, so MR can be rewritten as follows (Özdemir, Aktaş, Şevik, & Khanlari, 2017):
| (3) |
The drying rate (DR) of slices was calculated according to Equation (4) (Doymaz, 2014):
| (4) |
where Mt +Δ t is moisture content at t+Δt, and Δt is the time interval (min).
2.4. Quality evaluation of kiwifruit slices
2.4.1. Rehydration ratio
Generally, it found that the greater the drying, the slower and less complete is the degree of rehydration (Mujumdar, 2014). At the end of each run, rehydration test was performed by immersing a certain weight of slice inside a 100‐ml beaker containing distilled water at 60°C using a water bath for 30 min (Chakraborty, Mukhopadhyay, Bera, & Suman, 2011). After completing the rehydration period, the slice was then taken out, drained on a metal sieve, blotted with soft tissue paper to remove excess water on the slice surface, and finally weighed using an electronic digital balance with accuracy of 0.001 g (GF1000, A&D company).
With regard to recorded weights of the slice before and after the rehydration, the rehydration ratio (RR) was calculated as follows (Maskan, 2001):
| (5) |
where Wr and Wd are the weights of IR‐dried kiwifruit slices after and before rehydration (g), respectively.
2.4.2. Shrinkage
The shrinkage (Sh) percentage was calculated by Equation (6) (Ciurzyńska, Lenart, & Kawka, 2013):
| (6) |
where V d and V 0 are the superficial volume of a kiwifruit slice after and before drying (ml), respectively.
Solvent displacement is one of the usual methods for measurement of the sample volume (Ciurzyńska et al., 2013). The used solvent has to be organic and does not interact with the components of the sample. In order to the complete immersion, the sample has to have a higher density than the solvent (Ruhanian & Movagharnejad, 2016). Therefore, solvents such as toluene or n‐heptane are appropriate for the measurement of the sample volume. The slice volume was calculated as following (McMinn & Magee, 1997):
| (7) |
where V c, Mt, Mc, M and ρs are the glass graduated cylinder volume, total mass of the cylinder, slice, and toluene, mass of the cylinder, the mass of the slice, and the toluene density, respectively.
2.5. Experimental design and optimization
When experimental data cannot be described with linear functions, quadratic response surfaces should be employed to approximate a response function. The full factorial design, central composite design, Box–Behnken design, and Doehlert design are the well‐known second‐order symmetric designs. The central composite design is still used for the development of analytical procedures. But, due to presentation more efficient matrices, the Box–Behnken and Doehlert designs have been recently observed in numerous articles (Bezerra, Santelli, Oliveira, Villar, & Escaleira, 2008).
Drying experiments were carried out with respect to a Box–Behnken design and a central composite design formularized by Design Expert software (DX7) for natural and forced convection runs, respectively. t, RR, and Sh were chosen as response variables, and IP, λ, Δ, and V were selected as the main operating variables.
In order to avoid systematic bias, the experimental runs were randomly selected and performed twice and average values of response variables were shown in Tables 1 and 6.
Table 1.
Experimental design matrix of IR drying of kiwifruit under natural drying air convection
| Run | Uncoded variables | Coded variables |
t (hr) |
RR (g rehydrated sample/g dried sample) |
Sh (%) |
||||
|---|---|---|---|---|---|---|---|---|---|
|
IP (W) |
λ (mm) |
Δ (mm) |
X 1 (W) |
X 2 (mm) |
X 3 (mm) |
||||
| 1 | 2,000 | 6 | 700 | 1 | 1 | 0 | 3.14833 | 2.3913 | 77.8564 |
| 2 | 1,500 | 6 | 550 | 0 | 1 | −1 | 3.60889 | 2.5 | 78.009 |
| 3 | 2,000 | 4 | 550 | 1 | 0 | −1 | 1.71806 | 2.92857 | 75.9368 |
| 4 | 2,000 | 2 | 700 | 1 | −1 | 0 | 1.2 | 3.66667 | 72.51 |
| 5 | 1,500 | 6 | 850 | 0 | 1 | 1 | 5.715 | 2.19048 | 81.7878 |
| 6 | 1,500 | 4 | 700 | 0 | 0 | 0 | 3.15917 | 2.65 | 77.7338 |
| 7 | 1,500 | 2 | 850 | 0 | −1 | 1 | 2.63444 | 2.75 | 77.3787 |
| 8 | 1,500 | 2 | 550 | 0 | −1 | −1 | 1.37278 | 3.57143 | 74.7105 |
| 9 | 1,000 | 4 | 850 | −1 | 0 | 1 | 7.34444 | 2 | 80.8763 |
| 10 | 1,500 | 4 | 700 | 0 | 0 | 0 | 3.18694 | 2.4 | 78.2 |
| 11 | 1,500 | 4 | 700 | 0 | 0 | 0 | 3.13139 | 2.77 | 77.1 |
| 12 | 1,500 | 4 | 700 | 0 | 0 | 0 | 3.17917 | 2.42 | 77.9 |
| 13 | 2,000 | 4 | 850 | 1 | 0 | 1 | 2.99972 | 2.58824 | 78.4539 |
| 14 | 1,000 | 6 | 700 | −1 | 1 | 0 | 6.46444 | 1.93103 | 81.1767 |
| 15 | 1,500 | 4 | 700 | 0 | 0 | 0 | 3.11111 | 2.78 | 76.8 |
| 16 | 1,000 | 2 | 700 | −1 | −1 | 0 | 2.59917 | 2.72727 | 77.6873 |
| 17 | 1,000 | 4 | 550 | −1 | 0 | −1 | 3.81806 | 2.35714 | 78.0767 |
Table 6.
Experimental design matrix of IR drying of kiwifruit with forced drying air convection
| Run | Uncoded variables | Coded variables |
t (hr) |
RR (g rehydrated sample/g dried sample) |
Sh (%) |
||
|---|---|---|---|---|---|---|---|
|
λ (mm) |
V (m/s) |
X 2 (mm) |
X 4 (m/s) |
||||
| 1 | 4 | 1 | 0 | −1 | 1.87528 | 2.53009 | 80.7848 |
| 2 | 2 | 1.25 | −1 | 0 | 1.1425 | 3.34099 | 78.7585 |
| 3 | 4 | 1.5 | 0 | 1 | 2.36111 | 2.84524 | 83.2491 |
| 4 | 6 | 1.25 | 1 | 0 | 2.91111 | 2.10158 | 83.0153 |
| 5 | 2 | 1 | −1 | −1 | 1.09417 | 3.50383 | 75.6343 |
| 6 | 6 | 1 | 1 | −1 | 2.74222 | 2.46159 | 82.8111 |
| 7 | 4 | 1.25 | 0 | 0 | 2.03029 | 2.46491 | 82.1482 |
| 8 | 4 | 1.25 | 0 | 0 | 2.01333 | 2.47447 | 82.9185 |
| 9 | 4 | 1.25 | 0 | 0 | 2.04347 | 2.45748 | 81.5491 |
| 10 | 6 | 1.5 | 1 | 1 | 3.06222 | 2.07243 | 84.4417 |
| 11 | 2 | 1.5 | −1 | 1 | 2.03594 | 2.90136 | 79.5418 |
| 12 | 4 | 1.25 | 0 | 0 | 2.0284 | 2.46597 | 82.2338 |
| 13 | 4 | 1.25 | 0 | 0 | 2.03594 | 2.46173 | 81.8915 |
To survey the influence of operating variables together with their interactive influences on the response variables, a full quadratic equation is used in RSM as follows (Baş & Boyacı, 2007):
| (8) |
where y is the response variable; k is the number of variables; b 0, bj, bjj and bij are regression coefficients of variables for intercept, linear, quadratic, and interaction terms, respectively; and Xi and Xj are the independent coded operating variables. ε is the residual associated with the experiments.
In order to achieve optimal conditions, fitting the Equation (8) to data was done with respect to minimize t and Sh and maximize RR, by the numerical optimization tools of the software. Derringer's overall desirability function (DF) is the most often used method in the problem of multicriteria optimization of analytical procedures (Bezerra et al., 2008). DF is defined as a weighted geometric mean of di as shown by Equation (9) (Chakraborty et al., 2011):
| (9) |
where m is the number of responses investigated in the optimization process.
3. RESULTS AND DISCUSSION
3.1. Drying kinetics of kiwifruit slices
The drying curves of kiwifruit slices undergoing IR drying at various conditions are shown in Figures 2, 3, and 4. Comparison between drying data at various conditions revealed that the drying time of slices at higher IR power or less thickness and/or lower distance was shorter than those of data at the same other options.
Figure 2.
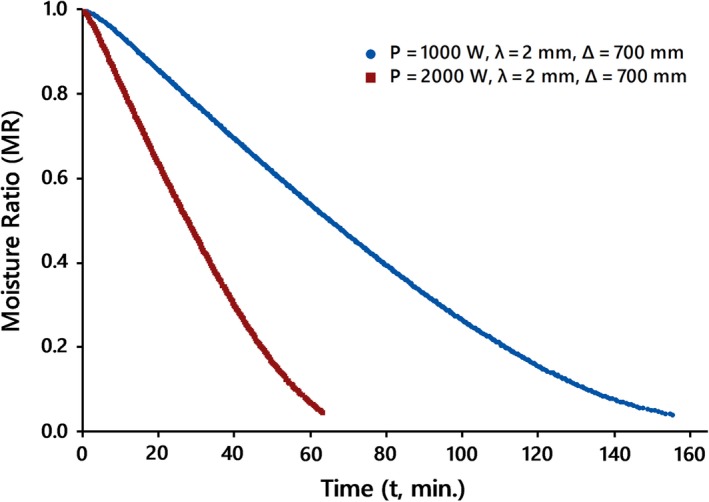
Drying curves of kiwifruit slices at different IR levels, IP, at the natural drying air mode
Figure 3.
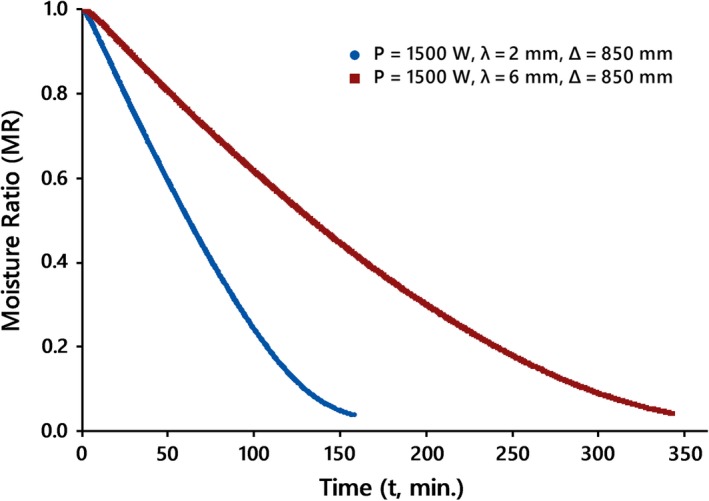
Drying curves of kiwifruit slices at different thickness, λ, at the natural drying air mode
Figure 4.
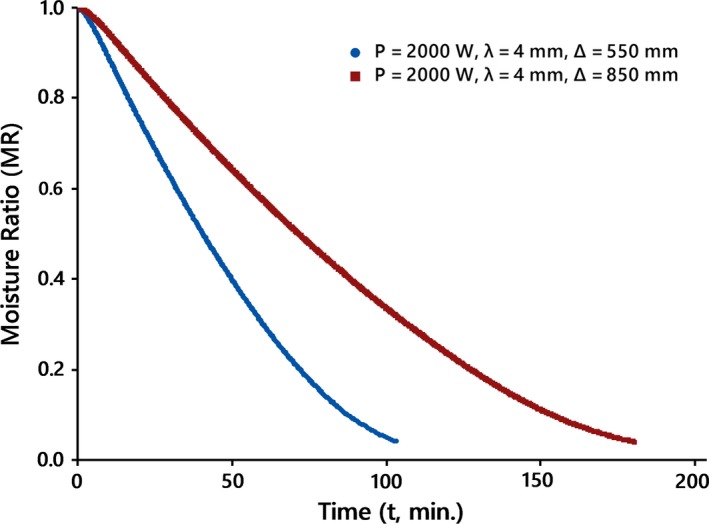
Drying curves of kiwifruit slices at different distances, Δ, at the natural drying air mode
This is most likely due to the fact that each of the mentioned items might increase the amount of radiation absorbed by the kiwifruit surfaces, thus describing the higher drying rate during IR drying.
The variations of the drying rates versus moisture content are shown in Figures 5 and 6. Similar to findings reported by Panyawong and Devahastin (2007), the results suggest that drying rate notably changes with velocity. It is negatively correlated with air velocity. The drying rates were more at the beginning of the drying process, maybe because of evaporation and moisture from the surface of the kiwifruit slices, and then reduced with reducing moisture content, for all the drying conditions when the drying process was governed by moisture diffusion. The accelerated drying rates may be assigned to internal heat generation. The lack of a constant drying rate period can be because of the thin layers of the slice that did not provide a constant supply of moisture, during drying. Also, the drying rate considerably decreases due to some resistance to moisture movement caused by shrinkage (Pathare & Sharma, 2006). An increase in drying rates with an increase in radiation intensity has been observed in other works such as Pathare and Sharma (2006) and Doymaz (2014).
Figure 5.
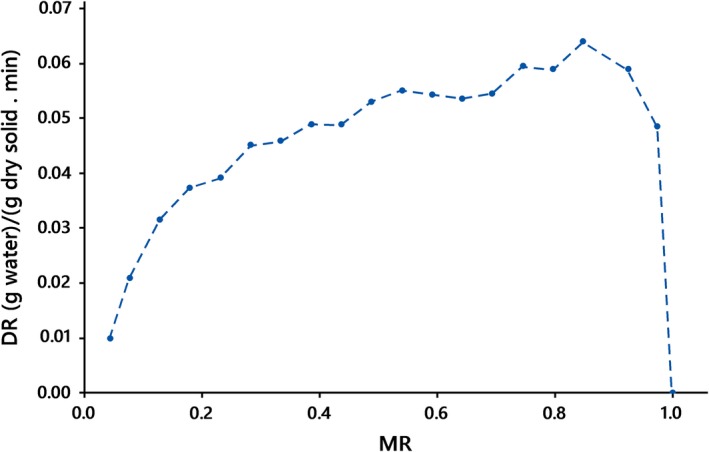
Drying rate of kiwifruit slices at IP = 1,000 W, λ = 2 mm, Δ = 550 mm at the natural drying air mode
Figure 6.
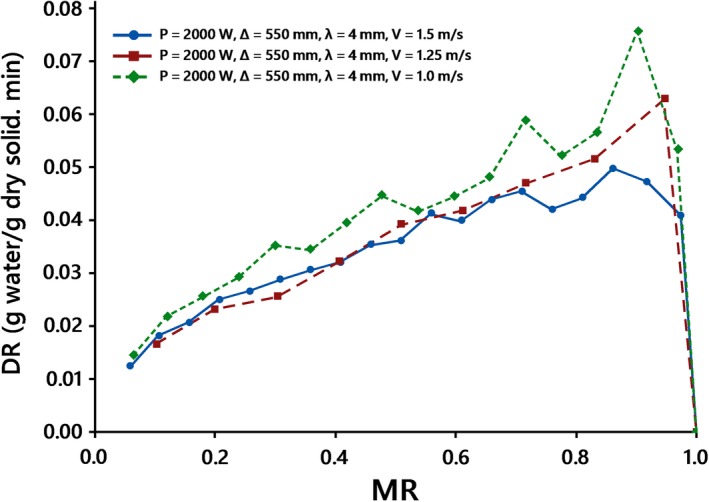
Drying rate of kiwifruit slices at IP = 2000 W, λ = 4 mm, Δ = 550 mm at the forced drying air mode
3.2. Effects of operating variables on t, RR, and Sh‐natural drying air convection mode
It is obvious that the drying time, t, affects the quality of the IR‐dried kiwifruit slices. The rehydration, as an index of quality, is widely employed in the food‐processing industries, denoting the changes in the physicochemical properties of food during drying. These irreversible changes resulted from intense heating and/or lengthened drying will be accompanied by product shrinkage and or lower rehydration values (Tables 1 and 2).
Table 2.
Summarized statistical data of models for drying time(t), rehydration ratio (RR), and shrinkage (Sh) of IR drying of kiwifruit slices under natural airflow convection
| Source | t | RR | Sh | ||||||
|---|---|---|---|---|---|---|---|---|---|
| SD | R 2 | PRESS | SD | R 2 | PRESS | SD | R 2 | PRESS | |
| Linear | 0.60 | 0.89 | 9.32 | 0.19 | 0.86 | 0.9 | 0.75 | 0.91 | 13.81 |
| Two‐factor interaction (2FI) | 0.48 | 0.95 | 10.10 | 0.19 | 0.89 | 1.34 | 0.78 | 0.92 | 25.13 |
| Quadratic | 0.31 | 0.98 | 10.63 | 0.17 | 0.94 | 1.09 | 0.72 | 0.96 | 38.17 |
The quadratic model and the linear models are selected as the best regression models for t, RR, and Sh compared with other models, respectively (Tables 2 and 3).
Table 3.
ANOVA results for drying time (t), rehydration ratio (RR), and shrinkage (Sh) of IR‐dried kiwifruit slices under natural drying air convection
| Source | t | RR | Sh | ||||||||||
|---|---|---|---|---|---|---|---|---|---|---|---|---|---|
| Sum of squares | F ‐value | p‐value | Sum of squares | F ‐value | p‐value | Sum of squares | F ‐value | p‐value | |||||
| Model | 43.38 | 50.49 | <.0001 | 2.95 | 26.01 | <.0001 | 72.83 | 43.02 | <.0001 | ||||
| X 1 | 15.57 | 163.11 | <.0001 | 0.82 | 21.66 | .0005 | 21.32 | 37.78 | <.0001 | ||||
| X 2 | 15.49 | 162.24 | <.0001 | 1.71 | 45.33 | <.0001 | 34.21 | 60.62 | <.0001 | ||||
| X 3 | 8.36 | 87.54 | <.0001 | 0.42 | 11.05 | .0055 | 17.30 | 30.65 | <.0001 | ||||
| X 1 X 2 | 0.92 | 9.62 | .0173 | – | – | – | – | – | – | ||||
| X 1 X 3 | 1.26 | 13.20 | .0084 | – | – | – | – | – | – | ||||
| X 2 X 3 | 0.18 | 1.87 | .2140 | – | – | – | – | – | – | ||||
|
|
0.74 | 7.72 | .0274 | – | – | – | – | – | – | ||||
|
|
0.20 | 2.11 | .1892 | – | – | – | – | – | – | ||||
|
|
0.67 | 6.99 | .0332 | – | – | – | – | – | – | ||||
| R 2 | 0.9848 | 0.8572 | 0.9085 | ||||||||||
| Adj. R 2 | 0.9653 | 0.8243 | 0.8874 | ||||||||||
| Pred. R 2 | 0.7586 | 0.7399 | 0.8278 | ||||||||||
| Adeq. Precision | 24.909 | 16.599 | 20.310 | ||||||||||
Analysis of variance (ANOVA) of the best regression models based on collected statistical data such as the highest coefficient of determination value and adequate precision (>4) demonstrates the competency of the selected models. The ANOVA results explain the insignificant terms of model (p > .05), which have been omitted from the coded form of final equations as given below (Table 3):
| (10) |
| (11) |
| (12) |
where X 1, X 2 and X 3 are the coded values of IP, λ, and Δ, and, respectively.
It can be seen from the ANOVA results that X 1 and X 2 are the most outstanding factors influencing t and RR, Sh, respectively, followed by other factors.
The effect of two factors affecting X 2 and X 3 on t can be interpreted as that increasing the conductive resistance and the moisture gradient of the slice due to the increase of X 2 led to the increase in drying times; reducing X 3 caused to obtain a large amount of heat by material and then resulted in excess enthalpy accumulation within it, which was displayed by an increase in product temperature and finally, led to the reduction of drying times. The effect of X 1 on t can be assigned to that with an increase in X 1, the extra energy emanated from lamps led to the enhanced slice temperature and drying chamber temperature and finally led to an enhanced drying rate (Das, Das, & Bal, 2009; Sharma, Verma, & Pathare, 2005), and following that resulting in reduced moisture content and drying time of slices(Toğrul, 2005) (Figures 7, 8 and 9).
Figure 7.
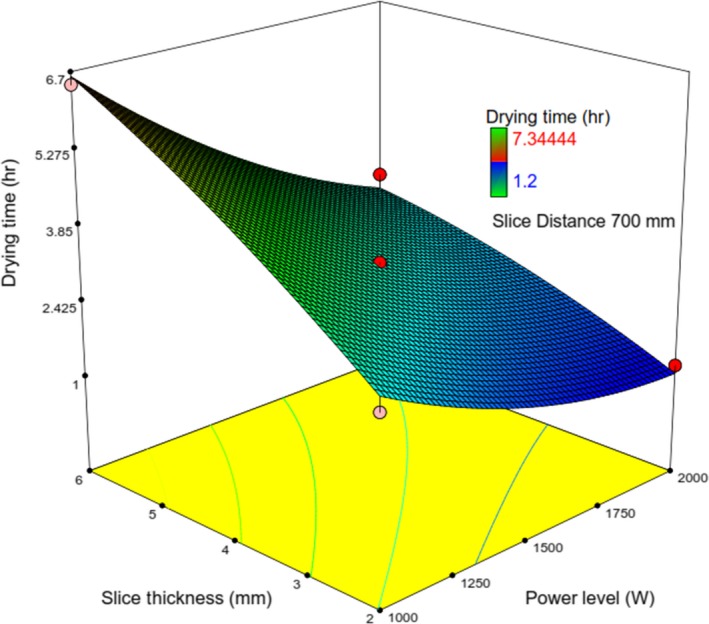
Response surface plot showing the simultaneous effects of λ and IP on t
Figure 8.
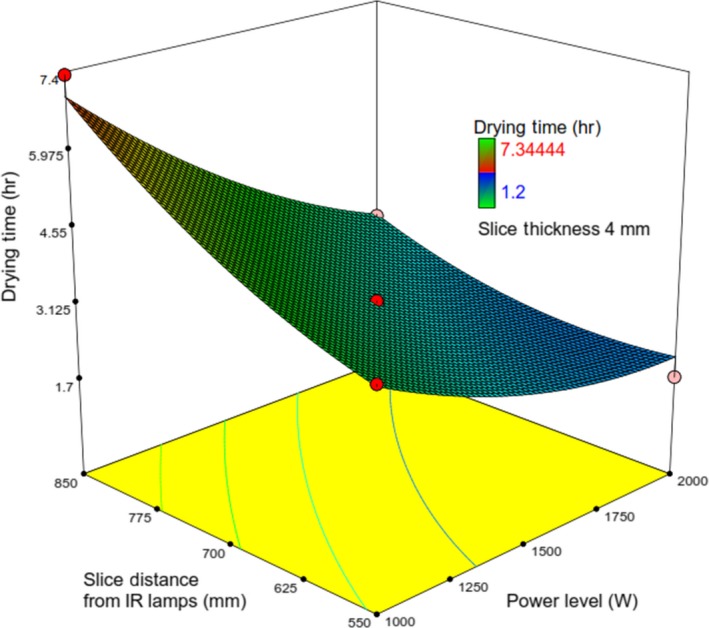
Response surface plot showing the simultaneous effects of IP and Δ on t
Figure 9.
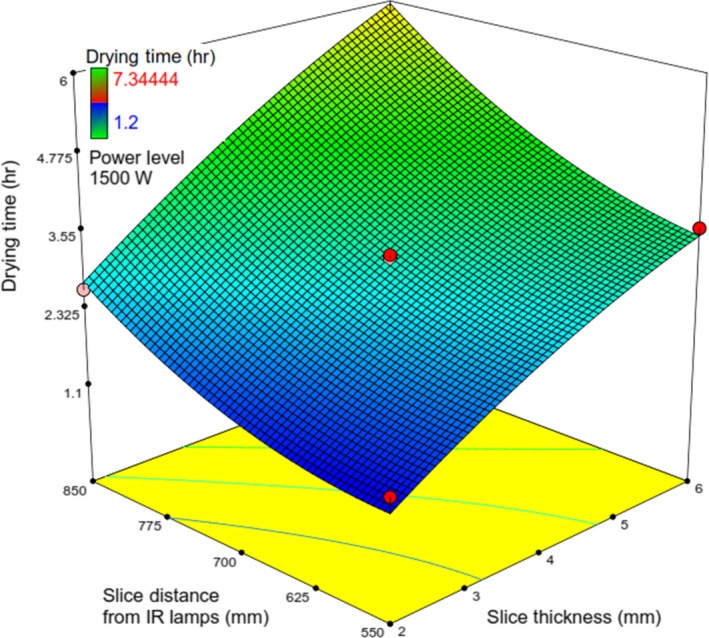
Response surface plot showing the simultaneous effects of λ and Δ on t
Figure 7 indicates that at the constant value of IP (1,000 W), increasing λ, t was reached around 6.5 hr. The same incremental manner has been observed at the other values of IP. Also, at the different constant values of λ, increasing IP led to a decrease in t. The interactive effects, IP versus Δ, and λ versus Δ on t have been identified in Figures 8 & 9, respectively.
In general, food containing more moisture content exhibits a greater extent of rehydration (Mongpraneet, Abe, & Tsurusaki, 2002). But rehydration of kiwifruit slices under various conditions of drying process was found in the range of 1.93–3.7 (g rehydrated sample/g dried sample) (Figures 10 and 11).
Figure 10.
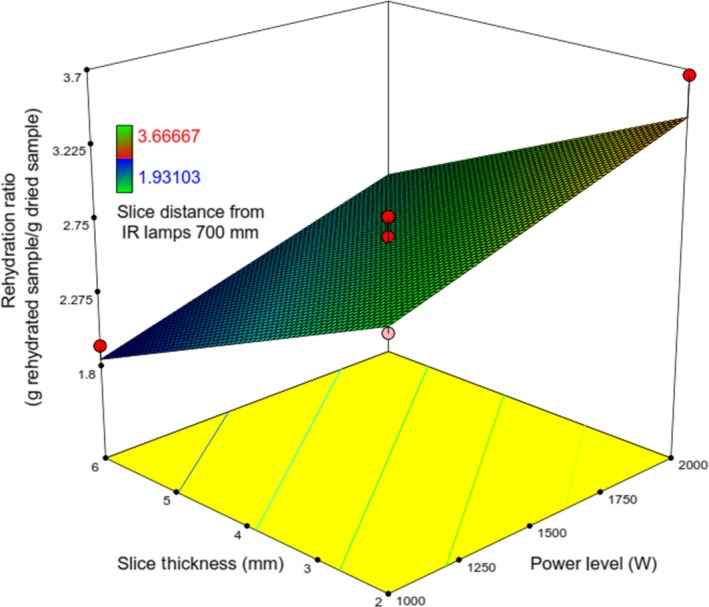
Response surface plot showing the simultaneous effects of λ and IP on RR
Figure 11.
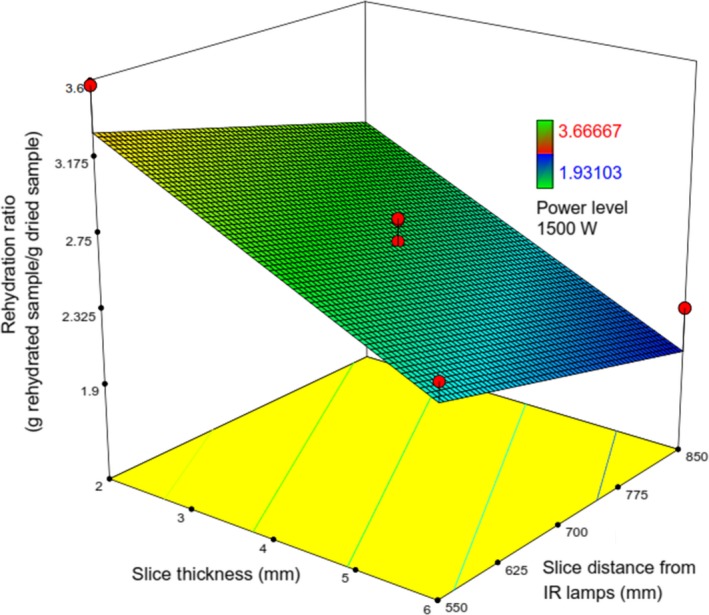
Response surface plot showing the simultaneous effects of λ and Δ on RR
Except for X 1, the other operating variables have a reducing effect on RR. The effect of X 1 on RR can be attributed to the fact that higher X 1 led to dried kiwifruit slices with a relative more porous structure. Similar findings have been observed by Mongpraneet et al. (2002). The increase of X 2 led to reduce rehydration ratio that most likely due to the formation of a little porous medium within dried kiwifruit, thus helping to expedite shrinkage; this corroborated well with the observations of Chakraborty et al. (2011) and Fathi, Mohebbi, and Razavi (2011), and also, similar to the effect of X 2, the increase in X 3 could lead to reduced rehydration ratio. It is observed from Figures 10 and 11 that RR is maximized at the lowest values of λ and Δ and the highest of IP (Figures 12 and 13).
Figure 12.
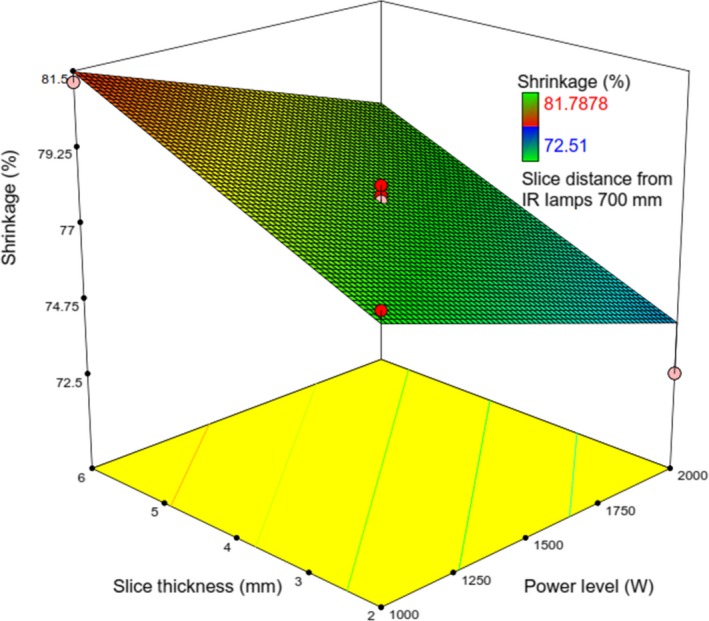
Response surface plot showing the simultaneous effects of λ and IP on Sh
Figure 13.
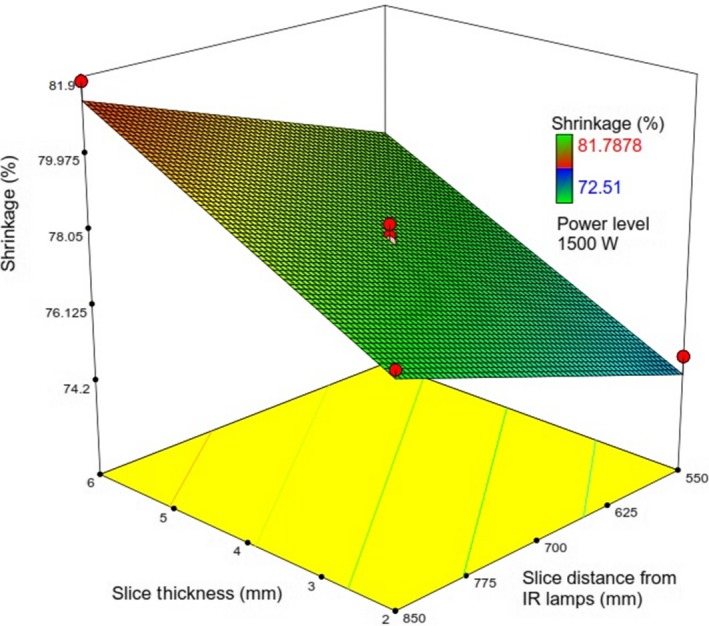
Response surface plot showing the simultaneous effects of λ and Δ on Sh
As well, X 2and X 3 have similar effects on Sh as evident from Equation (12). Figure 12 shows that at the constant values of λ, increasing IP would decrease Sh. At a given value of IP, Sh was observed to monotonically increase with increase in X 3 (Figure 13).
The dried foodstuffs under optimal conditions undergo less damage and more rapid rehydration than those of poorly dried (Pan & Atungulu, 2010). Therefore, by maximizing RR and minimizing t and Sh simultaneously, and assigning importance 3 to operating variables, importance 4 to response variables t and Sh and importance 5 to response variable RR, the optimal process conditions are obtained. The optimization program was run and selected the first solution computed by the software with a maximum desirability 0.99 (Table 4). Then, IR drying experiments were done at the assessed optimal conditions and it was identified that the values were predicted to be close enough to the experimental values (Table 5).
Table 4.
The first solution for optimal conditions in IR drying of kiwifruit under natural drying air convection
| IP (W) | λ (mm) | Δ (mm) | t (hr) | RR (g rehydrated sample/g dried sample) | Sh (%) |
|---|---|---|---|---|---|
| 2000 | 2 | 550 | 1.1944 | 3.63612 | 72.6053 |
Table 5.
Comparison between the predicted and experimental values at optimal conditions in IR drying of kiwifruit under natural drying air convection
| Response | Units | Predicted value | Experimental value | Deviation % |
|---|---|---|---|---|
| t | (hr) | 1.1944 | 1.08 | −10.59 |
| RR | (g rehydrated sample/g dried sample) | 3.63612 | 3.6667 | 0.834 |
| Sh | (%) | 72.6053 | 72.51 | −0.131 |
3.3. Effects of operating variables on t‐, RR‐, and Sh‐forced drying air convection mode
After determining the optimum conditions from the experiments under natural drying air convection, IP (2,000 W) and Δ (550mm) were fixed for IR drying experiments under forced airflow convection (Table 6).
The next experiments were then carried out with respect to a face‐centered central composite design formularized by the software (Table 6). λ and V were chosen as the main operating variables (Table 7).
Table 7.
Summarized statistical data of models for drying time(t), rehydration ratio (RR), and shrinkage (Sh) of IR drying of kiwifruit slices under forced drying air convection
| Source | t | RR | Sh | ||||||
|---|---|---|---|---|---|---|---|---|---|
| SD | R 2 | PRESS | SD | R2 | PRESS | SD | R 2 | PRESS | |
| Linear | 0.17 | 0.93 | 0.67 | 0.22 | 0.78 | 0.91 | 1.00 | 0.85 | 20.62 |
| 2FI | 0.14 | 0.96 | 0.90 | 0.22 | 0.79 | 1.65 | 0.98 | 0.87 | 35.82 |
| Quadratic | 0.11 | 0.98 | 0.77 | 0.20 | 0.87 | 2.75 | 0.55 | 0.97 | 12.69 |
The linear models and the quadratic model are selected as the best regression models for t, RR, and Sh compared with other models, respectively (Tables 7 and 8).
Table 8.
ANOVA results for drying time(t), rehydration ratio (RR), and shrinkage (Sh) of IR‐dried kiwifruit slices under forced drying air convection
| Source | t | RR | Sh | ||||||||||
|---|---|---|---|---|---|---|---|---|---|---|---|---|---|
| Sum of squares | F ‐value | p‐value | Sum of squares | F ‐value | p‐value | Sum of squares | F ‐value | p‐value | |||||
| Model | 3.80 | 69.61 | <.0001 | 1.69 | 18.19 | .0005 | 62.97 | 41.40 | <.0001 | ||||
| X 2 | 3.29 | 120.57 | <.0001 | 1.61 | 34.74 | .0002 | 44.46 | 146.15 | <.0001 | ||||
| X 4 | 0.51 | 18.65 | .0015 | 0.076 | 1.64 | .2288 | 10.67 | 35.08 | .0006 | ||||
| X 2 X 4 | – | – | – | – | – | – | 1.30 | 4.26 | .0779 | ||||
|
|
– | – | – | – | – | – | 4.91 | 16.13 | .0051 | ||||
|
|
– | – | – | – | – | – | 0.11 | 0.37 | .5602 | ||||
| R2 | 0.9330 | 0.7844 | 0.9673 | ||||||||||
| Adj. R 2 | 0.9196 | 0.7413 | 0.9439 | ||||||||||
| Pred. R 2 | 0.8357 | 0.5796 | 0.8051 | ||||||||||
| Adeq. Precision | 26.004 | 12.197 | 21.648 | ||||||||||
The ANOVA results demonstrate the competency of the selected models and explain the final equations as given below (Table 8):
| (13) |
| (14) |
| (15) |
where X 2, and X 4 are the coded values of slice thickness and air velocity, respectively.
X 2 is the most outstanding factor, influencing t and Sh, and only influential factor influencing RR. Both operating variables have an increasing impact on t and Sh. The fact of the significant effect X 2 on t and RR was mentioned earlier (Figure 14).
Figure 14.
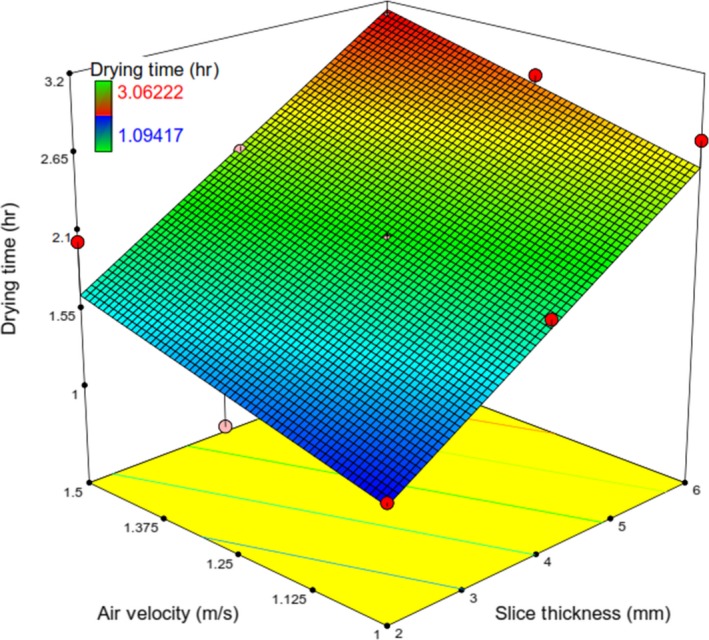
Response surface plot showing the simultaneous effects of λ and V on t
It can be attributed to the fact that the increase in air velocity accelerated the cooling effect, which reduced the temperature of the product and water vapor pressure. This led to the enhanced drying time of slices at all drying conditions (Pathare & Sharma, 2006). There is no significant change in the positive direction in the drying time for drying air velocity more than 1m/s (Nowak & Lewicki, 2004; Özdemir et al., 2017). On the contrary, evidence, Equation (13) as well as from the ANOVA (F = 18.65), indicates that drying time changes with air velocity. Figure 14 indicates that at the constant values of V, with an increase in λ, t was found to increase.
But the change in values of X 4 does not affect the amount of rehydration ratio; in other words, there is no significant change in the positive direction in the rehydration ratio for drying air velocity more than 1m/s. This is due to the fact that higher air velocity led to the slight increase in drying time and consequently, resulted approximately in constant RR (Figure 15).
Figure 15.
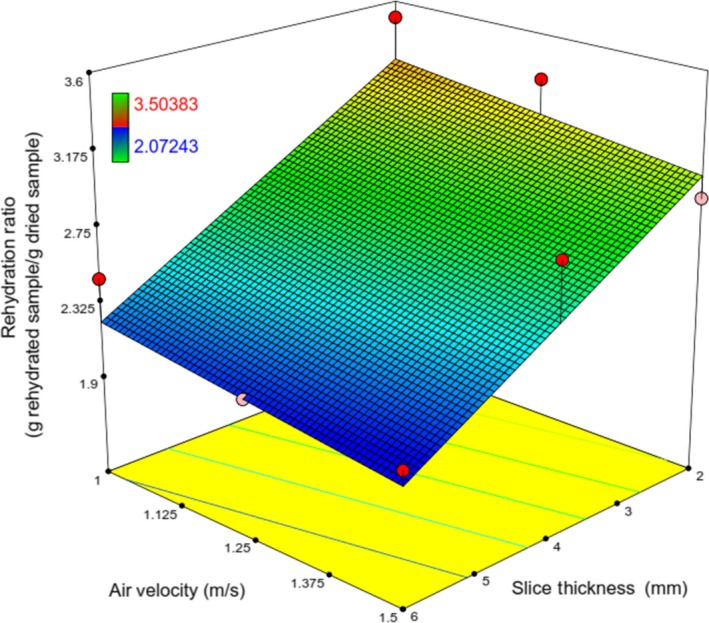
Response surface plot showing the simultaneous effects of λ and V on RR
Figure 15 shows that at any constant value of λ, an increase in air velocity, almost fixed RR. Also, from Figure 15, it can be concluded that RR is maximized at the lowest values of λ and V (Figure 16).
Figure 16.
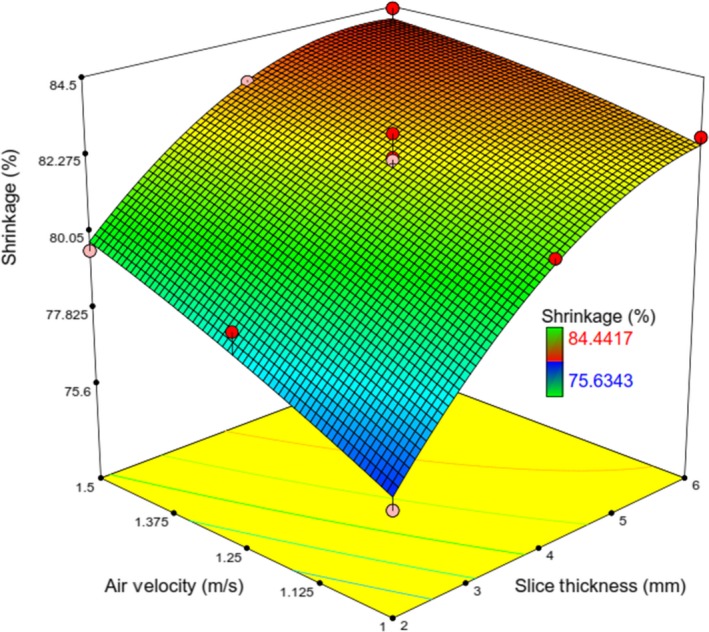
Response surface plot showing the simultaneous effects of λ and V on Sh
Similar to the effect of X 2, the increase in X 4 could lead to increased moisture content, and as explained earlier, it was because of the prolonged drying time; thus, X 2 and X 4 have the same effects on Sh. It can be seen that at any value of λ, with a decrease in air velocity, Sh was decreased (Figure 16).
Similar to the study of Kocabiyik and Tezer (2009), as air velocity increases, the shrinkage of slices increased. These observations can be explained on the basis of the effect of variables on the mass transfer. In kiwifruit drying, mass transfer occurs with both internal diffusion and external convection control, while the energy transport is externally controlled. Shrinkage may change with the resistance to moisture transfer during drying. Surface resistance dominates at low air velocities; internal stresses inside the slice are at a minimum and moisture profiles are relatively flat. So, at high air velocities, the slice shrinks uniformly and the transfer rate is controlled by internal resistance, especially at low moisture content. The surface of slice becomes drier than the center, so misfit shrinkage is at different points. If air velocities are very high, drying may make the surface of the sample stiff, limiting shrinkage even at the earliest stages. The surface of the sample does not become stiff at low air velocities until the moisture content has attained very low values (Khraisheh et al., 1997) (Tables 9 and 10).
Table 9.
Optimal conditions in IR drying of kiwifruit under forced drying air convection
| Slice thickness (mm) | Drying air velocity(m/s) | Drying time(hr.) | Rehydration ratio (g rehydrated sample/g dried sample) | Shrinkage (%) |
|---|---|---|---|---|
| 2 | 1 | 1.0741 | 3.253 | 76.01 |
Table 10.
Comparison between the predicted and experimental values at optimal conditions in IR drying of kiwifruit under forced drying air convection
| Response | Units | Predicted value | Experimental value |
Deviation % |
|---|---|---|---|---|
| t | (hr) | 1.0741 | 1.094 | 1.83 |
| RR | (g rehydrated sample/g dried sample) | 3.253 | 3.504 | 7.16 |
| Sh | (%) | 76.01 | 75.634 | −0.497 |
The optimal process conditions were found by assigning the same importance to the variables. The optimization program was selected the first solution computed by the same software with a maximum desirability 0.916 (Table 9). It was identified that the values were predicted to be close enough to the experimental values (Table 10).
4. CONCLUSION
Several experiments were done at IP (1000–2000 W), λ (2–6 mm), Δ (550–850 mm), and V (1–1.5 m/s) based on a Box–Behnken design and a central composite design. Statistical equations generated can predict drying time, rehydration ratio, and shrinkage of IR‐dried kiwifruit as a function of operating variables under natural and forced air convection modes. In all results, slice thickness almost was the most prominent factor, influencing t, RR, and Sh. The operating variables had significant effect on all responses. In IR drying experiments, the optimal conditions were found to be as follows: IP (2000 W), Δ (550 mm), and λ (2 mm) for natural air convection and V (1 m/s) and λ (2 mm) for forced air convection. The drying parameters were optimized based on the quality characteristics of dried kiwifruit and drying time (or energy consumed) during the drying process. At the optimal conditions with regard to a maximum desirability, the lowest values of drying time of the IR‐dried kiwifruit for natural and forced convection were 1.1944 hr. and 1.0741 hr., respectively, which ensures the avoiding excessive consumption of energy from any source.
Besides, the rehydration ratios were 3.636 and 3.253 (g rehydrated sample/g dried sample), which clearly satisfies product quality. Moreover, from the shrinkage of the IR‐dried kiwifruit slices, namely 72.605 and 76.06(%), it was obvious that the IR‐dried kiwifruit slices had become more stable compared with fresh samples.
It is worth mentioning the developed statistical multivariate model equations can be very useful for the design and operation of IR dryer when there is no certain multidimensional IR drying model for high‐value foodstuffs such as kiwifruit.
CONFLICT OF INTEREST
The authors declare that they have no conflict of interest.
ETHICAL APPROVAL
This study does not involve any human or animal testing.
INFORMED CONSENT
For this type of study, formal consent is not required.
ACKNOWLEDGMENTS
We are grateful to the Babol Noshirvani University of Technology, Iran, for financial support. Also, we would not forget to remember Mr. Farhad Asadi for his help in the completion of the project.
Sadeghi E, Haghighi Asl A, Movagharnejad K. Optimization and quality evaluation of infrared‐dried kiwifruit slices. Food Sci Nutr. 2020;8:720–734. 10.1002/fsn3.1253
REFERENCES
- Aghilinategh, N. , Rafiee, S. , Hosseinpour, S. , Omid, M. , & Mohtasebi, S. S. (2015). Optimization of intermittent microwave–convective drying using response surface methodology. Food Science & Nutrition, 3(4), 331–341. 10.1002/fsn3.224 [DOI] [PMC free article] [PubMed] [Google Scholar]
- Baş, D. , & Boyacı, İ. H. (2007). Modeling and optimization I: Usability of response surface methodology. Journal of Food Engineering, 78(3), 836–845. 10.1016/j.jfoodeng.2005.11.024 [DOI] [Google Scholar]
- Bezerra, M. A. , Santelli, R. E. , Oliveira, E. P. , Villar, L. S. , & Escaleira, L. A. (2008). Response surface methodology (RSM) as a tool for optimization in analytical chemistry. Talanta, 76(5), 965–977. 10.1016/j.talanta.2008.05.019 [DOI] [PubMed] [Google Scholar]
- Chakraborty, R. , Mukhopadhyay, P. , Bera, M. , & Suman, S. (2011). Infrared‐assisted freeze drying of tiger prawn: Parameter optimization and quality assessment. Drying Technology, 29(5), 508–519. 10.1080/07373937.2010.513214 [DOI] [Google Scholar]
- Chen, X. , Pirini, W. , & Ozilgen, M. (2001). The reaction engineering approach to modelling drying of thin layer of pulped Kiwifruit flesh under conditions of small Biot numbers. Chemical Engineering and Processing: Process Intensification, 40(4), 311–320. 10.1016/S0255-2701(01)00108-8 [DOI] [Google Scholar]
- Ciurzyńska, A. , Lenart, A. , & Kawka, P. (2013). Influence of chemical composition and structure on sorption properties of freeze‐dried pumpkin. Drying Technology, 31(6), 655–665. 10.1080/07373937.2012.753609 [DOI] [Google Scholar]
- da Silva, W. P. , Precker, J. W. , & de Lima, A. G. B. (2009). Drying kinetics of lima bean (Phaseolus lunatus L.) experimental determination and prediction by diffusion models. International Journal of Food Engineering, 5(3), 1-19. [Google Scholar]
- Das, I. , Das, S. , & Bal, S. (2009). Drying kinetics of high moisture paddy undergoing vibration‐assisted infrared (IR) drying. Journal of Food Engineering, 95(1), 166–171. 10.1016/j.jfoodeng.2009.04.028 [DOI] [Google Scholar]
- Diamante, L. , Durand, M. , Savage, G. , & Vanhanen, L. (2010). Effect of temperature on the drying characteristics, colour and ascorbic acid content of green and gold kiwifruits. International Food Research Journal, 17, 441–451. [Google Scholar]
- Doymaz, I. (2009). Mathematical modelling of thin‐layer drying of kiwifruit slices. Journal of Food Processing and Preservation, 33(s1), 145–160. 10.1111/j.1745-4549.2008.00289.x [DOI] [Google Scholar]
- Doymaz, I. (2014). Mathematical modeling of drying of tomato slices using infrared radiation. Journal of Food Processing and Preservation, 38(1), 389–396. 10.1111/j.1745-4549.2012.00786.x [DOI] [Google Scholar]
- Fathi, M. , Mohebbi, M. , & Razavi, S. M. (2011). Effect of osmotic dehydration and air drying on physicochemical properties of dried kiwifruit and modeling of dehydration process using neural network and genetic algorithm. Food and Bioprocess Technology, 4(8), 1519–1526. 10.1007/s11947-010-0452-z [DOI] [Google Scholar]
- Khraisheh, M. , Cooper, T. , & Magee, T. (1997). Shrinkage characteristics of potatos dehydrated under combined microwave and convective air conditions. Drying Technology, 15(3–4), 1003–1022. 10.1080/07373939708917274 [DOI] [Google Scholar]
- Kocabiyik, H. , & Tezer, D. (2009). Drying of carrot slices using infrared radiation. International Journal of Food Science & Technology, 44(5), 953–959. 10.1111/j.1365-2621.2008.01767.x [DOI] [Google Scholar]
- Kocabiyik, H. , Yilmaz, N. , Tuncel, N. B. , Sumer, S. K. , & Buyukcan, M. B. (2015). Drying, energy, and some physical and nutritional quality properties of tomatoes dried with short‐infrared radiation. Food and Bioprocess Technology, 8(3), 516–525. 10.1007/s11947-014-1418-3 [DOI] [Google Scholar]
- Lewicki, P. P. (1998). Some remarks on rehydration of dried foods. Journal of Food Engineering, 36(1), 81–87. 10.1016/S0260-8774(98)00022-3 [DOI] [Google Scholar]
- Maskan, M. (2001). Drying, shrinkage and rehydration characteristics of kiwifruits during hot air and microwave drying. Journal of Food Engineering, 48(2), 177–182. 10.1016/S0260-8774(00)00155-2 [DOI] [Google Scholar]
- Mayor, L. , & Sereno, A. (2004). Modelling shrinkage during convective drying of food materials: A review. Journal of Food Engineering, 61(3), 373–386. 10.1016/S0260-8774(03)00144-4 [DOI] [Google Scholar]
- McMinn, W. , & Magee, T. (1997). Physical characteristics of dehydrated potatoes—Part I. Journal of Food Engineering, 33(1–2), 37–48. 10.1016/S0260-8774(97)00039-3 [DOI] [Google Scholar]
- Mohammadi, A. , Rafiee, S. , Keyhani, A. , & Emam‐Djomeh, Z. (2008). Estimation of thin‐layer drying characteristics of kiwifruit (cv. Hayward) with use of Page’s model. American‐Eurasian Journal of Agricultural & Environmental Sciences, 3, 802–805. [Google Scholar]
- Mohammadi, A. , Rafiee, S. , Keyhani, A. , & Emam‐Djomeh, Z. (2009). Moisture content modeling of sliced kiwifruit (cv. Hayward) during drying. Pakistan Journal of Nutrition, 8(1), 78–82. 10.3923/pjn.2009.78.82 [DOI] [Google Scholar]
- Mongpraneet, S. , Abe, T. , & Tsurusaki, T. (2002). Accelerated drying of welsh onion by far infrared radiation under vacuum conditions. Journal of Food Engineering, 55(2), 147–156. 10.1016/S0260-8774(02)00058-4 [DOI] [Google Scholar]
- Mujumdar, A. S. (2014). Handbook of industrial drying. Boca Raton, FL: CRC Press. [Google Scholar]
- Nowak, D. , & Lewicki, P. P. (2004). Infrared drying of apple slices. Innovative Food Science & Emerging Technologies, 5(3), 353–360. 10.1016/j.ifset.2004.03.003 [DOI] [Google Scholar]
- Özdemir, M. B. , Aktaş, M. , Şevik, S. , & Khanlari, A. (2017). Modeling of a convective‐infrared kiwifruit drying process. International Journal of Hydrogen Energy. 10.1016/j.ijhydene.2017.01.012 [DOI] [Google Scholar]
- Pan, Z. , & Atungulu, G. G. (2010). Infrared heating for food and agricultural processing. Boca Raton, FL: CRC Press. [Google Scholar]
- Panyawong, S. , & Devahastin, S. (2007). Determination of deformation of a food product undergoing different drying methods and conditions via evolution of a shape factor. Journal of Food Engineering, 78(1), 151–161. 10.1016/j.jfoodeng.2005.09.012 [DOI] [Google Scholar]
- Pathare, P. B. , & Sharma, G. (2006). Effective moisture diffusivity of onion slices undergoing infrared convective drying. Biosystems Engineering, 93(3), 285–291. 10.1016/j.biosystemseng.2005.12.010 [DOI] [Google Scholar]
- Ponkham, K. , Meeso, N. , Soponronnarit, S. , & Siriamornpun, S. (2012). Modeling of combined far‐infrared radiation and air drying of a ring shaped‐pineapple with/without shrinkage. Food and Bioproducts Processing, 90(2), 155–164. 10.1016/j.fbp.2011.02.008 [DOI] [Google Scholar]
- Ruhanian, S. , & Movagharnejad, K. (2016). Mathematical modeling and experimental analysis of potato thin‐layer drying in an infrared‐convective dryer. Engineering in Agriculture, Environment and Food, 9(1), 84–91. 10.1016/j.eaef.2015.09.004 [DOI] [Google Scholar]
- Seremet, L. , Botez, E. , Nistor, O.‐V. , Andronoiu, D. G. , & Mocanu, G.‐D. (2016). Effect of different drying methods on moisture ratio and rehydration of pumpkin slices. Food Chemistry, 195, 104–109. 10.1016/j.foodchem.2015.03.125 [DOI] [PubMed] [Google Scholar]
- Sharma, G. , Verma, R. , & Pathare, P. (2005). Thin‐layer infrared radiation drying of onion slices. Journal of Food Engineering, 67(3), 361–366. 10.1016/j.jfoodeng.2004.05.002 [DOI] [Google Scholar]
- Simal, S. , Femenia, A. , Garau, M. , & Rosselló, C. (2005). Use of exponential, Page's and diffusional models to simulate the drying kinetics of kiwi fruit. Journal of Food Engineering, 66(3), 323–328. 10.1016/j.jfoodeng.2004.03.025 [DOI] [Google Scholar]
- Toğrul, H. (2005). Simple modeling of infrared drying of fresh apple slices. Journal of Food Engineering, 71(3), 311–323. 10.1016/j.jfoodeng.2005.03.031 [DOI] [Google Scholar]
- Zhang, M. , Tang, J. , Mujumdar, A. , & Wang, S. (2006). Trends in microwave‐related drying of fruits and vegetables. Trends in Food Science & Technology, 17(10), 524–534. 10.1016/j.tifs.2006.04.011 [DOI] [Google Scholar]


