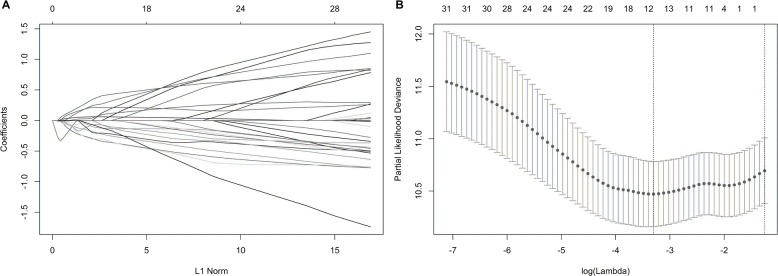
Figure 3. Construction of the prognostic index based on the most significant survival-associated splicing factor genes ( P < 0.005) using the LASSO COX regression model.
(A) The LASSO coefficient profiles of the splicing factors. A vertical line is drawn at the value chosen by 10-fold cross-validation. (B) Tuning parameter (λ) selection cross-validation error curve. The vertical lines were drawn at the optimal values by the minimum criteria and the 1-SE criteria.

