Abstract
Clinically, uterine contractions are monitored with tocodynamometers or intrauterine pressure catheters. In the research setting, electromyography (EMG), which detects electrical activity of the uterus from a few electrodes on the abdomen, is feasible, can provide more accurate data than these other methods, and may be useful for predicting preterm birth. However, EMG lacks sufficient spatial resolution and coverage to reveal where uterine contractions originate, how they propagate, and whether preterm contractions differ between women who do and do not progress to preterm delivery. To address those limitations, electromyometrial imaging (EMMI) was recently developed and validated to non-invasively assess three-dimensional (3D) electrical activation patterns on the entire uterine surface in pregnant sheep. EMMI uses magnetic resonance imaging to obtain subject-specific body-uterus geometry and collects uterine EMG data from up to 256 electrodes on the body surface. EMMI software then solves an ill-posed inverse computation to combine the two datasets and generate maps of electrical activity on the entire 3D uterine surface. Here, we assessed the feasibility to clinically translate EMMI by evaluating EMMI’s accuracy under the unavoidable geometrical alterations and electrical noise contamination in a clinical environment. We developed a hybrid experimental-simulation platform to model the effects of fetal kicks, contractions, fetal/maternal movements, and noise contamination caused by maternal respiration and environmental electrical activity. Our data indicate that EMMI can accurately image uterine electrical activity in the presence of geometrical deformations and electrical noise, suggesting that EMMI can be reliably translated to non-invasively image 3D uterine electrical activation in pregnant women.
Keywords: Electromyometrial imaging, Preterm birth, Inverse problem, Electrophysiology, Clinical translation
Introduction
Worldwide, about 10% of pregnant women give birth preterm [1], resulting in a high rate of fetal mortality and severe neurological disability [2]. Currently, our ability to predict preterm birth is limited. However, if we could accurately monitor uterine contractions, which are normally low amplitude and uncoordinated during early gestation and become intense and synchronized when close to labor [3–5], we may be able to better predict preterm birth. In daily clinical practice, the most common techniques used to monitor uterine contractions are tocodynamometry (TOCO), which detects small uterine contour displacements associated with contractions, and intrauterine pressure catheter (IUPCs), which measure pressure inside the uterus. However, TOCO provides inaccurate measurements of contraction amplitude and duration [6], and IUPCs are invasive and increase risks of maternal and neonatal infection [7,8].
One research tool to monitor uterine contraction is magnetomyography, which detects uterine magnetic activities with a superconducting quantum interference device (SQUID) [9], which has 151 sensors arranged in a fixed pattern to collect signal from the anterior abdominal region [10]. SQUID can record uterine contractile activity with high spatial and temporal resolution. However, SQUID needs to be installed in a magnetically shielded room, which limits its wide application in clinical practice. Another research technique is electromyography (EMG), which measures uterine electrical activity from a few electrodes placed on the abdomen. These EMG signals are the spatial integral of action potentials from all of the uterine smooth muscle (myometrial) cells [12]. EMG can generate highly accurate TOCO/IUPC-like signals [11], and by recording from multiple-electrode arrays (2 × 2, 4 × 4, or 8 × 8), EMG can provide information about regional electrical propagation. EMG studies have revealed that the electrical propagation velocity increases with labor progression, but no predominant propagation direction was found [17,18]. Additionally, several features of EMG signals, such as power spectrum peak frequency, sample entropy, and magnitude, have great promise to identify the onset of labor and distinguish between term and preterm birth [13–16]. However, conventional EMG measures electrical activities from only a few body surface locations. Thus conventional EMG does not have sufficient spatial coverage and specificity to reflect the electrical activation pattern on the entire three-dimensional uterine surface.
To overcome the limitations of conventional EMG, we recently developed a new uterine electrical imaging system, Electromyometrial Imaging (EMMI) [6], to non-invasively characterize the three-dimensional electrical features of uterine contractions including initiation and propagation. This technique is conducted in three steps: First, magnetic resonance imaging (MRI), which has been widely used in studies of women in all three trimesters of pregnancy [19–21], is used to acquire a subject-specific body-uterus geometry. Second, when the subject is in labor, multi-channel body surface electrical potentials are measured with up to 256 unipolar electrodes placed all around the abdomen. Third, EMMI software, which is a customized MATLAB package using the method of fundamental solution [22], is used to combine body surface potentials with the body-uterus geometry to reconstruct uterine surface potentials (electrical activity across the uterus at a single time point). These potentials are then used to generate uterine electrograms (electrical waveforms over time at each uterine site) and isochrone maps (time of activation at each site across the entire uterine surface).
In our previous work, we used a sheep model to assess the validity of the biophysical and mathematical model underlying EMMI [6]. In that work, we measured uterine electrical activity from up to 128 electrodes placed directly on the sheep uterus. Simultaneously, we measured electrical potentials from up to 256 electrodes placed on the body surface and used EMMI software to reconstruct uterine signals. We then compared the EMMI-reconstructed and directly measured uterine signals and found that EMMI could accurately (with high correlation coefficients) image three-dimensional uterine electrical activations. To begin to assess the robustness of EMMI during oxytocin-induced contractions, we modelled a small amount of random geometrical deformation of the uterus (1 cm) or 10% Gaussian noise. We found that these small amounts of deformation and noise had little effect on EMMI reconstructions (high correlation coefficient and low relative error) [6]. However, in the clinical setting, the body-uterus geometry could have larger and less random deformations as a result of fetal or maternal movements or uterine contractions. Moreover, the electrical noise could come from multiple sources and be much larger than we previously modeled.
Here, we assessed the accuracy of EMMI in the presence of substantial noise and both random and non-random geometrical alterations that would realistically occur in a clinical environment. We used a hybrid experimental/simulation method to computationally model four types of geometrical alterations (two types of fetal kicks, maternal/fetal movement, and uterine contractions) and two types of noise (Gaussian noise to model that from other electronic equipment and Perlin noise to model that caused by maternal respiration). Our results indicate that clinically relevant geometry deformations and electrical noise only cause minor EMMI reconstruction errors, indicating that EMMI can be used clinically to image uterine contractions in pregnant women.
Materials and Methods
Scheme of the hybrid method to assess the effects of geometrical deformation and electrical noise on EMMI
This study uses data from our previous study [6]. These include a representative body-uterus geometry and 400 seconds of multi-channel EMG signals measured during oxytocin-induced contractions from up to 128 unipolar electrodes placed directly on the sheep uterus (See supplementary material for detailed animal experiment procedure). The raw uterine electrical recordings were pre-processed before analysis (See supplementary material for detailed description of signal processing). Katahdin sheep were used as a model for human pregnancy because they have a similar abdomen size as humans and respond to steroids to induce labor [6,23]. All procedures were approved by the Washington University in St. Louis Institutional Animal Care and Use Committee and were performed in compliance with their guidelines and regulations.
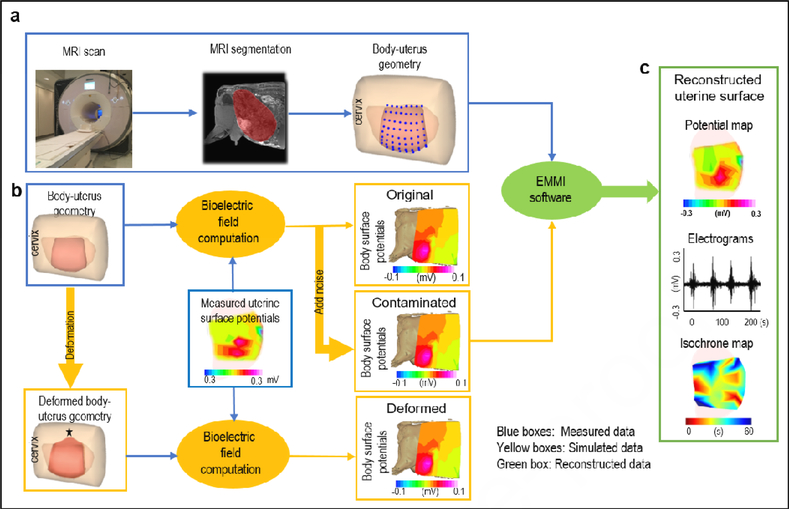
For the work described in this paper, we used a bioelectric field computation to forward compute an “original” body surface potential map from the measured uterine surface potentials and the original body-uterus geometry (Figure 1b). We then developed computer simulation algorithms to generate different types and extents of body-uterus geometry deformations, which we used to forward compute geometry-deformed body surface potentials (Figure 1b). Additionally, we used a simulation algorithm to add electrical noise to the original body surface potentials to generate noise-contaminated body surface potentials (Figure 1b). We then used EMMI software to combine the original, geometry-deformed, and noise-contaminated body surface potentials with the original body-uterus geometry to reconstruct original, geometry-deformed, and noise-contaminated uterine potentials, respectively. Finally, we derived uterine electrograms and isochrone maps from the uterine potentials for geometry-deformed and noise-contaminated cases and compared them to the original electrograms and isochrone maps (See supplementary material for detailed definition of electrograms and isochrone maps).
Figure 1. EMMI system and hybrid assessment method.
a, body-uterus geometry generation. Body-uterus geometry (original geometry) was acquired from MRI images (Beige, body surface; light pink, complete uterine surface; blue dots, locations where electrodes were placed; dark pink, the region of uterine surface where electrodes were placed). b, Simulation of body surface potentials under different conditions. The body-uterus geometry and experimentally measured uterine potentials were used to generate original body surface potentials. Noise-contaminated body surface potentials were generated by adding signal noise to original body surface potentials. A computer-simulated deformed geometry, derived from the original body-uterus geometry, was combined with measured uterine potentials to generate geometry-deformed body surface potentials. The black star denotes deformation center. c. Reconstruction and comparison of uterine surface signals. The three types of body surface potentials and original body-uterus geometry were input into EMMI software to reconstruct uterine surface potentials, respectively. Then respective original, noise-contaminated, and geometry-deformed uterine electrograms and isochrone maps were derived and compared.
Simulation of body-uterus geometry deformation
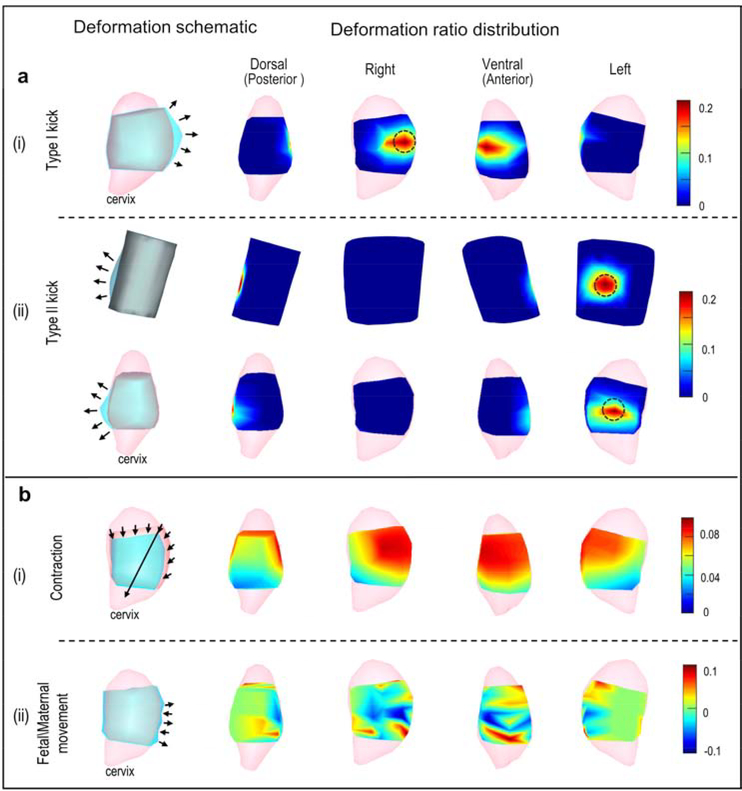
We investigated four types of body-uterus deformations (Figure 2): Local deformations included a Type I kick (a fetal kick that caused the uterus but not the body surface to protrude) and a Type II kick (a fetal kick that caused both the uterus and body surface to protrude); global deformations included a contraction (a reduction in uterine volume), and fetal/maternal movement (random global protrusion or indentation in uterine geometry that did not affect body surface geometry). These deformations were simulated with customized MATLAB functions (Release 2016a, The MathWorks). Local deformations used a widely used Laplacian-based deformation method, [24,25] and global deformations were based on the natural features of the deformations. The deformation ratio was defined to quantify the severity of geometric deformations. (See supplementary materials for details).
Figure 2. Simulation of geometrical deformations.
a, Local deformations. b, Global deformations. All rows show the uterus except the top row in a(ii), which shows the body surface. Note that the body surface is not to scale with the uterus in the other rows. In each row, the left-most image shows a schematic of the simulated deformation. Light pink, complete uterine surface; blue, deformed surface; light gray, original uterine surface overlap of blue and dark pink (as in Figure 1); dark gray, overlap of blue and beige body surface color (as in Figure 1). Arrows indicate the deformation region and direction. In each row, the four images on the right show deformation ratios in heat maps from the four indicated views. Warm colors indicate large deformations, and cool colors indicate small deformations as indicated in scales at far right. Black circles mark regions with maximum deformation ratios for local deformations.
Simulation of signal noise
Two types of noise were investigated. Gaussian white noise, a normally distributed noise with wide frequency band, was used to model complicated environmental electrical noise [26]. Perlin noise, a wide frequency band noise with higher amplitude at lower frequency, was developed to model maternal respiratory noise [27]. Signal-to-noise ratio (SNR) was used to quantify the severity of noise contamination.
Bioelectric field computation
In both EMMI and the electrocardiographic imaging (ECGI) system on which it is based, the inductive effects of the volume conductor are negligible [28], leading to the quasi-static condition. Previous ECGI studies have shown that body surface potential maps can be accurately computed from measured epicardial potentials and body-heart geometry [22]. In addition, the inhomogeneity of the volume conductor between the heart and body surface doesn’t change the reconstructed electrical activation pattern [29]. Here, we assumed a homogenous volume conductor between the uterine surface and body surface. The conductivity of the volume conductor Ω is denoted by σ. Because there is no primary electrical source in Ω, the potential (ϕ) in Ω satisfies Laplace’s equation (1) [30] with two types of boundary conditions as seen in equations (2) and (3).
| (1) |
| (2) |
| (3) |
ΓU represents the uterine surface. and are the uterine surface potential and the normal current density on the body surface at location , respectively. σair is the conductivity of air. Because σair is 0, the right side of equation (3)(6) is simplified to 0. To accurately compute the body surface potential, the boundary element method [6] was used to discretize equations (1) – (3) and relate the uterine surface potential (ϕU) with the body surface potential (ϕB), shown as equation (4).
| (4) |
where A is the transfer matrix reflecting the patient-specific body-uterus geometry relationship and will change corresponding to geometrical deformation; the original geometry and the deformed geometry will lead to different body surface potentials with the same ϕU.
EMMI software – Inverse computation of EMMI
The goal of EMMI software is to reconstruct uterine potential maps from the body surface potentials and patient-specific body-uterus geometry segmented from MRI. The basic mathematical formulation underlying this inverse problem can be described by Laplace’s equation (1) and two boundary conditions on the body surface ϕB.
| (5) |
| (6) |
ΓB represents the body surface. and are the measured potential and the normal current density on the body surface at location , respectively. In this study, ϕB is the computed body surface potential generated by the bioelectric field computation. σ is the conductivity of the volume conductor Ω, which is assumed to be homogeneous. The method of fundamental solutions [22], a mesh-free method robust to noise, was used to discretize Laplacian’s equation and two boundaries (5), (6), and then a transfer matrix was generated. Because the inverse problem was numerically ill-posed, it could not be solved by directly inverting the matrix A. Thus, we used a well-established technique for such cases, the zero-order of Tikhonov regularization method [6,22,31,32], which solves a least-square problem with an L2 norm regularization term (equation (7)). The composite residual and smoothing operator methods [33] were used to stabilize the numerical computation.
| (7) |
Statistical Analysis
The errors of reconstructed electrograms and isochrone maps caused by the deformations were quantitatively evaluated by using relative error (RE) ([> 0], quantifies amplitude differences) and correlation coefficient (CC) ([0 ~ 1], quantifies morphology differences), defined as follows:
| (8) |
| (9) |
For electrograms, temporal CC and RE were calculated. X denotes potential and is replaced with V. n is the number of sample points over time in the electrograms. represents the potentials for the ith frame based on original body surface signals and geometry, and represents potentials reconstructed from deformed or noise-contaminated body surface potentials and geometry. OG indicates original, and CM indicates deformed or contaminated. and are the average potential of all the time frames from the original and deformed or noise-contaminated body-uterus geometry and body surface potentials, respectively.
For activation sequences, X denotes time and is replaced with T. n is the number of discretized points on the uterine surface. and are the activation times at the ith site derived from the electrograms based on the original and deformed or noise-contaminated body-uterus geometry and body surface potentials, respectively. and are the spatial averaged activation times.
To thoroughly quantify the effect of deformation and noise on the isochrone maps, activation time differences of each correlated EMG burst between original and deformed or noise-contaminated signals were calculated, and the mean error at each uterine site was defined as activation absolute error (AAE) in equation (10).
| (10) |
where ic is the ith corresponding EMG burst at one uterine site. and are the activation times (initiation times) of the ic EMG burst derived from the original and deformed or noise-contaminated signals/geometries, respectively.
In total, 310 ± 5 single EMG bursts were compared, and an average of six EMG burst clusters were analyzed in each electrogram. Wilcoxon rank-sum test was performed to test the difference of activation time between original and deforemed or noise-contaminated signals reconstructed from original and deformed or noise-contaminated body-uterus geometry and body surface signals, respectively.
Results
Geometry deformations and noise contamination have minimal effect on EMMI electrograms
Local geometry deformation
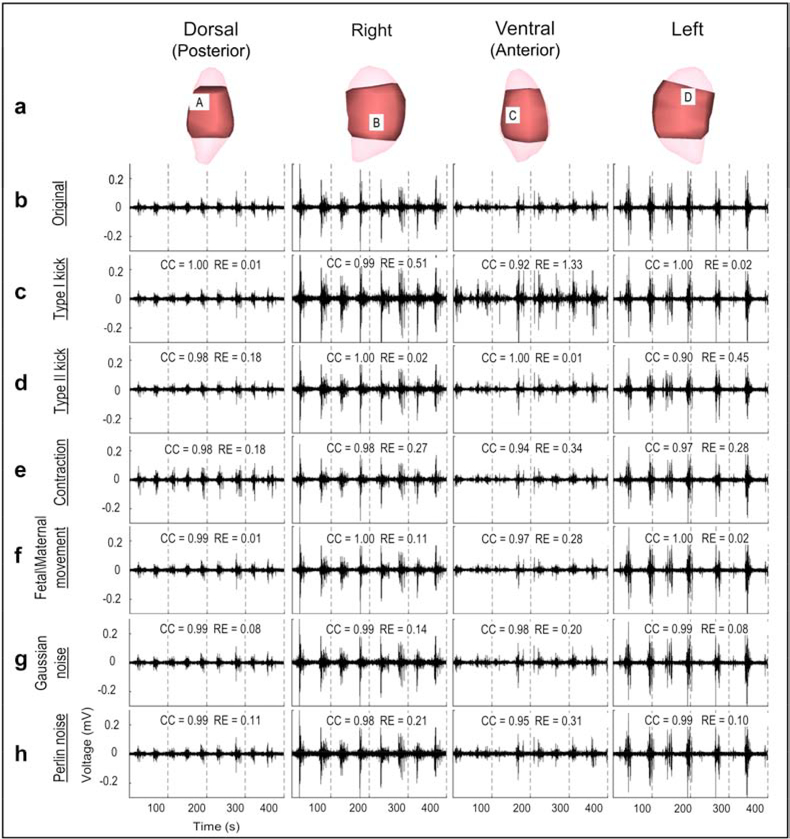
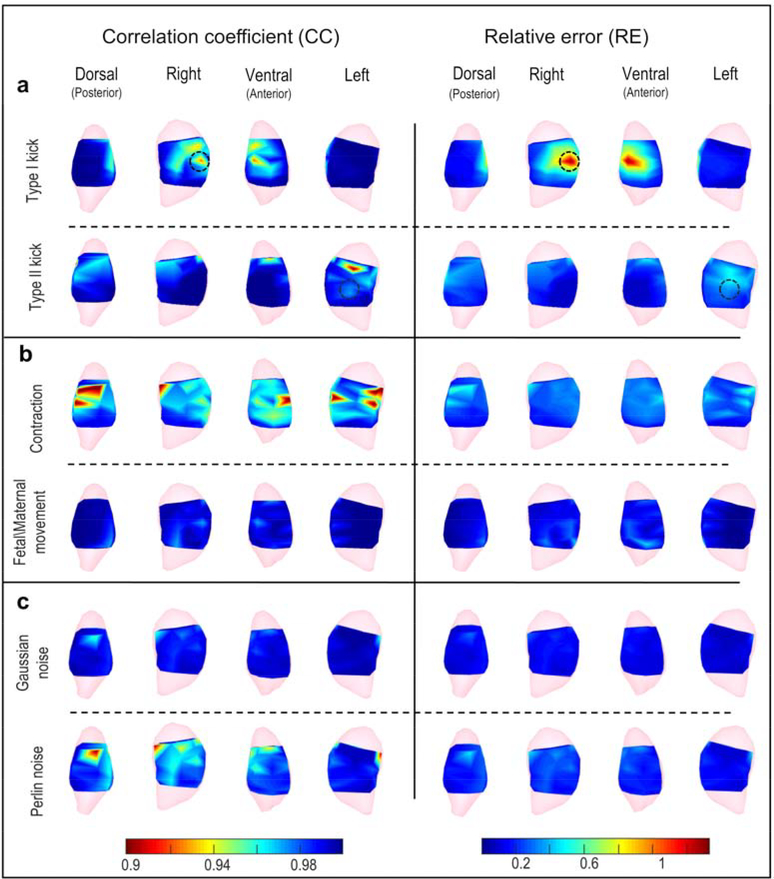
To determine the effect of local body-uterus geometry deformations, we first modelled moderate Type I kicks (causing only the uterus to protrude) and Type II kicks (causing both the uterus and the body surface to protrude) for which the maximum deformation ratio was 0.2, correlating with a protrusion distance up to 1.3 cm. The maximum deformation ratio (red in Figure 2a) was centered at the protrusion (black circle in Figure 2a) and gradually decreased from the protrusion site to distant sites (blue in Figure 2a). To evaluate how accurately EMMI could reconstruct electrograms under these local deformations, we calculated correlation coefficient (CC, 0–1; numbers close to 1.0 indicate high accuracy) and relative error (RE, >0; low numbers indicate high accuracy) at each uterine surface site. Figure 3c, d shows representative EMMI-reconstructed electrograms at four locations, labeled A through D in Figure 3a. The EMMI-reconstructed electrograms under local geometry deformations had similar morphologies (CC > 0.9) as the original electrograms (Figure 3b). Except for the protrusion region of the Type I kick (Site B, C in Figure 3), the magnitudes of the EMMI-reconstructed electrograms were also well preserved (RE < 0.5). Figure 4a summarizes the electrogram CC and RE values across the entire uterine surface with warm colors indicating low accuracy, and cool colors indicating high accuracy. For the Type I kick (Figure 4a), maximum RE was about 1.3 at the center of the simulated kick (black circle in Figure 4a) and gradually decreased to below 0.2 at areas far from the deformation; the minimum CC was about 0.92 near the deformation center. For the Type II kick, the minimum CC was 0.9 and maximum RE was 0.45.
Figure 3. Electrograms under moderate deformations or noise contamination.
a, Four views of sheep uterus; light pink is the uterine geometry segmented from MRI images; dark pink is the uterine geometry from the locations of electrodes placed on the uterine surface. b, Electrograms reconstructed from original body surface potentials from four locations labeled A, B, C, and D in a. c–h, Reconstructed electrograms corresponding to the deformed or noise-contaminated body surface potentials. Deformation extents are the same as those shown in Figure 2, and SNR = 17.5 dB.
Figure 4. Electrogram accuracy distribution under moderate deformations or noise contamination.
The CC (left) and RE (right) are shown as heat maps (scale at bottom) in which warm colors indicate large error and cool colors indicate small error. a, Local deformations, b, Global deformations, c, Signal noise. Black circles mark deformation centers for local deformations. Deformation extents are the same as those shown in Figure 2, and SNR = 17.5 dB.
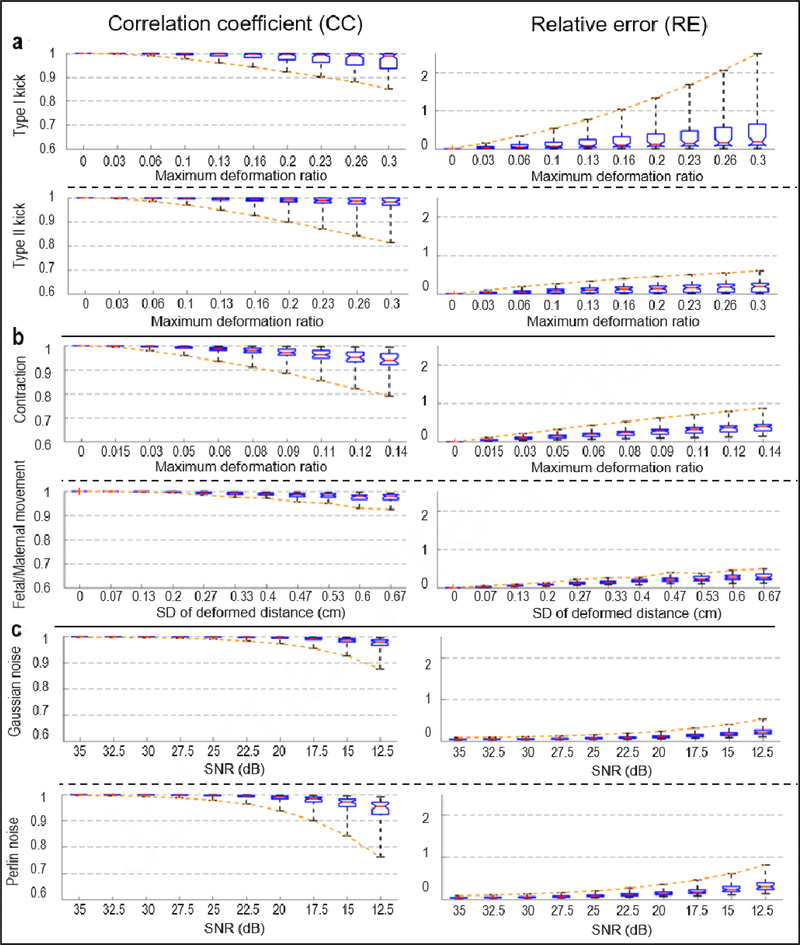
To examine EMMI’s accuracy under different extents of local geometry deformation, we generated a series of maximum Type I and II kicks, with deformation ratios from 0 to 0.3, which correlated with a protrusion distance up to 2 cm. This distance is within the physiological range observed clinically. The maximum RE values for the Type I kicks increased substantially as the deformation ratio increased (up to 2.5 at deformation ratio = 0.3); the minimum CC value was 0.85 at extreme local deformation (Figure 5a). For Type II kicks, the minimum CC and maximum RE at extreme deformation were 0.81 and 0.6, respectively (Figure 5a).
Figure 5. EMMI-reconstructed electrogram errors under different extents of deformation or noise.
Results are summarized with standard box plots indicating median (red line), 1st and 3rd quartile (boxes), and minimum and maximum values (whiskers). Orange dashed lines connect the minimum CC or maximum RE values, indicating the largest errors at different deformation ratios or SNR. a, Local deformations (n=55), b, Global deformations n=55 for contraction, n=31 for fetal/maternal movement), c, Signal noise (n=55).
Global geometry deformation effect
We simulated two types of global deformations, uterine contraction and fetal/maternal movement, and examined their effects on EMMI-reconstructed electrograms (Figure 2b). First, for moderate contractions with 8.73% uterine volume reduction, electrogram accuracy was affected over all uterine sites; the minimum CC was 0.88, and the maximum RE was 0.62 (Figure 4b). We also investigated a series of contractions with uterine volume reductions from 0 to 12.9% (deformation ratio from 0 to 0.14). The electrogram accuracy decreased as the deformation ratio increased. At extreme deformation severity, the minimum CC was 0.79, and the maximum RE was 0.87 (Figure 5b).
Second, we simulated moderate fetal/maternal movements in which the standard deviation (SD) of the deformed distance was 0.333 cm. All the CC values were higher than 0.97, and all of the RE values were lower than 0.45 (Figure 3f and Figure 4b). We also evaluated a range of maximum deformation ratios from 0 to 0.24, which correlated with an SD of protrusion/indentation distance up to 0.67 cm, and maximum deformed distance up to 2 cm. Even under the maximal deformation, all CC values were over 0.9, and all RE values were smaller than 0.5 (Figure 5b).
Noise contamination effect
At moderate levels (signal to noise ratio [SNR] = 17.5 dB), Perlin noise more strongly affected EMMI-reconstructed electrograms than Gaussian noise, though the minimum CC value of Perlin-contaminated electrograms was 0.89 and maximum RE was 0.47 (Figure 4c). We further examined the effects of a series of SNRs from 35 dB to 12.5 dB, which are typical in a clinical environment [16,34]. For Gaussian noise, all CC values at SNR = 12.5 dB were above 0.85, and all RE values were lower than 0.55. For Perlin noise, lowest accuracy at SNR = 12.5 dB was CC = 0.81 and RE = 0.76 (Figure 5c).
Geometry deformations and noise contamination have minimal effects on EMMI-reconstructed isochrone maps
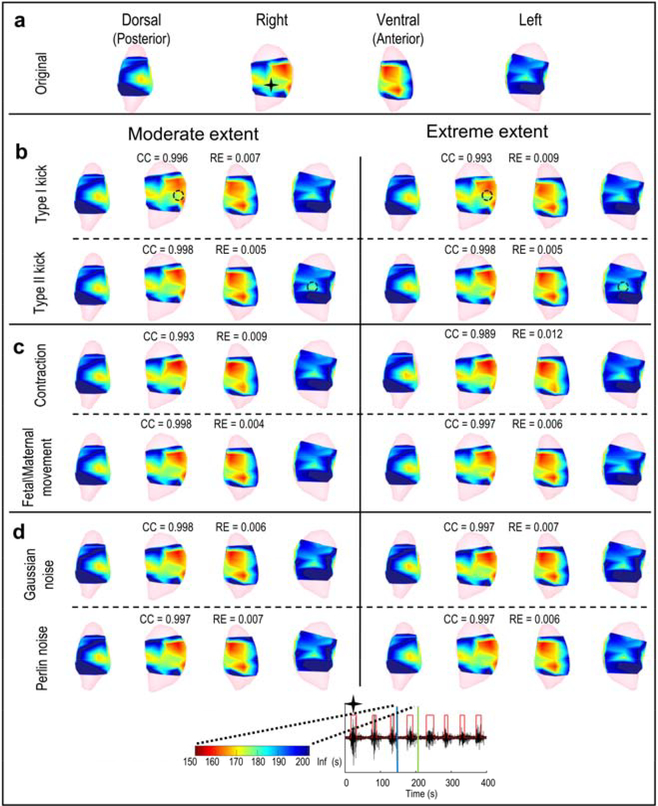
We examined the effect of geometry deformations and noise contaminations on EMMI-reconstructed isochrone maps (Figure 6) in which warm colors denote early activation sites and cool colors denote late activation sites. We examined the accuracy of EMMI-reconstructed isochrone maps for one EMG burst under moderate and extreme local deformations (maximum deformation ratio = 0.2 and 0.3 for Type I and Type II kicks), uterine contraction (maximum deformation of 0.1 and 0.14), fetal/maternal movement (standard deviation of distortion 0.33 cm and 0.67 cm), and Gaussian and Perlin noise (SNR = 17.5 dB and 12.5 dB) (Figure 6). The isochrone maps derived under geometrical deformation and noise contamination (Figure 6b–d) were similar to the original isochrone maps (Figure 6a). The isochrone map CC values were all close to 1.0, and RE values were less than 0.1 (Figure 6). Even at extreme deformation or noise, the accuracy of isochrone maps only decreased slightly, suggesting that deformations and noise had minor effects on the ability of EMMI to accurately reconstruct isochrone maps.
Figure 6. EMMI-reconstructed isochrone maps.
In the top seven rows, isochrones are displayed for extents of deformation or noise and shown in four views. In the heat maps, red indicates early activation, blue indicates late activation, and the darkest blue denotes regions in which no activation was recorded during the specific observation window. The black star indicates the location at which the electrogram (bottom row) was reconstructed. The electrogram shows EMG bursts (denoted by the red step lines); blue and green vertical lines indicate the start and end of the observation window for EMG burst (from 150 s to 201 s). a - d, Isochrones from original, local deformed, global deformed, and noise contaminated electrograms, respectively. Black circles in b mark local deformation centers.
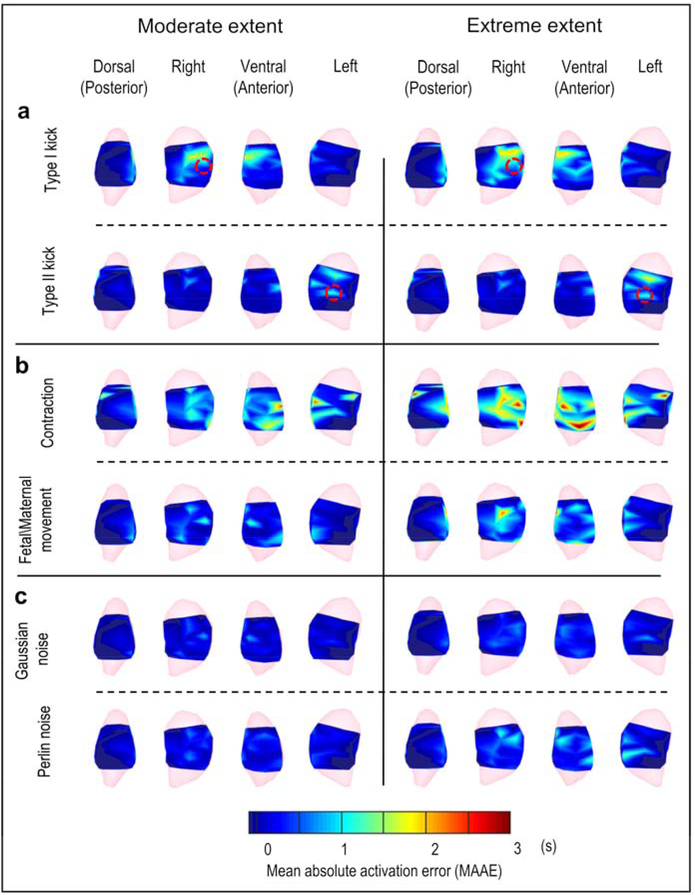
To quantify the EMMI-reconstructed isochrone accuracy across multiple oxytocin-induced uterine contractions, we analyzed a 400-second EMG recording including 8 oxytocin-induced uterine contractions and more than 300 single EMG clusters (see Methods). We constructed a mean absolute activation time error (MAAE) map by computing the mean absolute activation time error caused by geometry deformation and noise contamination for each uterine surface site across uterine contractions (Figure 7). In MAAE maps, warm colors indicate uterine regions with activation time error greater than 2 s, and cool colors indicate uterine regions with activation time error less than 0.1 s. The Type I kick (Figure 7a) and contraction (Figure 7b) caused the largest error in EMMI-reconstructed activation times. Quantitatively, the largest errors were within 3 s, which is minor relative to the duration of uterine contraction (30 s [16]), and did not affect EMMI’s ability to accurately image uterine activation patterns. The extreme levels of deformation and noise caused slightly greater MAAE than the moderate levels (Type I kick, 0.25 s; Type II kick, 0.11 s; contraction, 0.43 s; maternal/fetal movement, 0.34 s; Gaussian noise, 0.23 s; Perlin noise, 0.27 s). For the Type I and Type II kicks, the regions with greatest activation time errors were near the centers of the deformations (red circle in Figure 7a), suggesting that local deformations created spatially heterogeneous activation time errors. The null hypothesis that the median value of activation time error is zero was accepted by a two-sided Wilcoxon signed-rank test for most cases. Although the hypothesis was rejected for moderate contraction, moderate fetal/maternal movement, extreme contraction, and extreme Gaussian noise (P < 0.05), the estimated median values under those cases were all lower than 0.5 s. (Detailed P-values and estimated median values are in Supplementary material Table S1).
Figure 7. Mean absolute activation time error distribution maps.
Activation time error distributions are shown in heat maps from four views. a, Local deformations, b, Global deformations, c, Signal noise. Left and right represent the moderate and extreme extent of deformation or noise, respectively. Red circles denote local deformation centers. In the heat map, warm colors indicate large activation time error; cool colors indicate small activation time error (scale at bottom). The darkest blue denotes regions in which no activation was recorded during the episode. The sample size is 300 ± 5.
Discussion
EMMI was designed to noninvasively image the three-dimensional electrical activation patterns of uterine contractions. We previously used a well-controlled pregnant sheep model to demonstrate that EMMI could accurately image the uterine electrical initiation and propagation pattern during contractions. Herein, our hybrid experimental-simulation approach revealed that EMMI accuracy is minimally affected by body-uterus geometry deformations that could occur between the MRI scan and EMG recordings or by electrical noise contamination in the clinical environment.
In a clinical environment, fetal kicks are likely to occur frequently during EMMI body surface recordings. Depending on their direction (anterior or posterior) and strength, fetal kicks could cause local uterine geometry deformation alone (which we modeled as Type I kicks), or both uterus and body surface deformation (which we modeled as Type II kicks). We found that the largest EMMI errors (lowest CC and highest RE) were confined to the regions with maximal kick-induced deformations. Overall median CC and RE values were modestly affected by fetal kicks. This suggests that fetal kicks only impair EMMI accuracy locally and transiently. Surprisingly, the magnitude RE of the Type II kick was smaller than that of the Type I kick. This counter-intuitive finding can be explained by the quasi-electrostatic theory and inverse numerical computation [22,30]. The transfer matrix (equation (4)) [22] linking body surface potentials with uterine surface potentials was less altered in Type II kicks (in which the body and uterine surfaces changed synchronously) than in Type I kicks (in which only the uterine surface changed), leading to better preserved inverse computation accuracy.
In EMG, the peak power spectrum frequency has been used to compare term and preterm labor and identify first-stage labor arrest [4,35]. EMMI should be useful for determining the peak power spectrum frequency and will have better spatial coverage and resolution than other EMG methods. Also in EMG, essential characteristics of uterine contractions such as electrical propagation velocity and direction [10,17] have been explored as predictive markers of preterm birth. However, EMG measures these propagation vectors from only a few electrodes covering a small anterior abdominal area, leading to limited spatial coverage and poor angular resolution. In contrast, EMMI-reconstructed uterine surface isochrone maps can be used to generate uterine contraction propagation maps on the entire three-dimensional uterine surface at high spatial and temporal resolution.
Recently source imaging techniques based on EMG and magnetomyography measurements were developed to image the sources of the uterine activities [26,36]. However, source imaging techniques usually use predefined electrical/magnetical source models and would rely on detailed information about myometrial microstructures. These source imaging techniques usually require extensive computation, which would be challenging for real-time clinical applications. In contrast, EMMI can be conducted through two simple steps: deriving the body-uterus geometry from MR images and measuring electrical activities from the body surface. Moreover, EMMI employs the fast zero-order of Tikhonov regularization method to solve the underlying ill-posed linear problem. In addition, the EMMI-derived potential maps, electrograms, and isochrone maps are quantitative descriptions of electrophysiological properties underlying uterine contractions.
Limitations
Our study has four major limitations. First, to model realistic regional protrusions (Type I and II kicks), we employed the Laplacian-based deformation method (Figure 2a). However, because of the 5 cm spacing between electrodes, the simulated deformation region (which covered about 40% of the uterine surface) could be larger than that caused by a realistic fetal kick. Second, for simplicity, we did not consider body surface deformations in simulating uterine contraction and fetal/maternal movement. Third, we didn’t consider uterine deformation-induced EMG changes in computing the deformed body surface potentials. Fourth, the bioelectric field computation didn’t consider the inhomogeneity of the volume conductor between the body and uterine surfaces. In future studies, we will incorporate a more detailed body-uterus geometry [37], uterine contraction model [38,39], and inhomogeneous volume conductors into the computer simulations. Despite these limitations, this study provides a thorough evaluation and quantification of EMMI’s accuracy under realistic clinical conditions.
Conclusion
This study demonstrates that EMMI can accurately image uterine electrical activity (electrograms and isochrone maps) in the presence of geometrical deformations and noise contamination. Thus, EMMI can be used clinically to characterize the three-dimensional activation patterns of uterine contractions. Clinical applications of EMMI will allow us to investigate whether uterine smooth muscle has a pacemaker(s), how uterine contractions that initiate at different regions correlate with one another [18], and whether the three-dimensional activation patterns of preterm contractions differ from those of term contractions.
Supplementary Material
Data S1. Electrode_positions.xlsx
Materials and methods
Table S1. Wilcoxon signed-rank test results of activation time error
Highlights.
The accuracy of Electromyometrial Imaging (EMMI) is evaluated with a hybrid method.
Multiple levels of geometry deformations and of electrical noise are considered.
Ten different levels of deformations/noise are studied.
Accuracy of EMMI uterine electrogram, isochrone and activation time are evaluated.
Geometrical deformation and electrical noise have minor effects on EMMI accuracy.
Acknowledgments
We thank Dr. Peinan Zhao for valuable advice on data analysis, Dr. Sarah England for technical advice, Dr. Deborah Frank for editing the manuscript, and Jessica Chubiz for coordinating the sheep experiments.
Funding: This work was supported by the March of Dimes (March of Dimes Prematurity Research Center, PI Macones) and by grants from NIH/National Institute of Child Health and Human Development (RO1HD094381; PIs Wang/Cahill); the NIH/National Institute of Aging (RO1AG053548; PIs Benzinger/Wang); and the BrightFocus Foundation (A2017330S; PI Wang).
Competing interests: Y.W., A.G.C., P.C., and A.L.S submitted U.S. Provisional Application No. 62/642,389 titled “System and Method for Noninvasive Electromyometrial Imaging (EMMI)” for the EMMI technology evaluated in this work. Y.W. serves as a scientific consultant for Medtronic and has NIH research funding. P.K.W. has research support from Siemens and research funding from Roche, Lilly, and NIH. R.M. has a travel fund from Siemens.
Footnotes
Publisher's Disclaimer: This is a PDF file of an unedited manuscript that has been accepted for publication. As a service to our customers we are providing this early version of the manuscript. The manuscript will undergo copyediting, typesetting, and review of the resulting proof before it is published in its final form. Please note that during the production process errors may be discovered which could affect the content, and all legal disclaimers that apply to the journal pertain.
References
- [1].Blencowe H, Cousens S, Oestergaard MZ, Chou D, Moller A-B, Narwal R, Adler A, Garcia CV, Rohde S, Say L, National, regional, and worldwide estimates of preterm birth rates in the year 2010 with time trends since 1990 for selected countries: a systematic analysis and implications, Lancet. 379 (2012) 2162–2172. [DOI] [PubMed] [Google Scholar]
- [2].Saigal S, Doyle LW, An overview of mortality and sequelae of preterm birth from infancy to adulthood, Lancet. 371 (2008) 261–269. doi: 10.1016/S0140-6736(08)60136-1. [DOI] [PubMed] [Google Scholar]
- [3].Romero R, Dey SK, Fisher SJ, Preterm labor: one syndrome, many causes, Science (80-. ). 345 (2014) 760–765. [DOI] [PMC free article] [PubMed] [Google Scholar]
- [4].Garcia-Casado J, Ye-Lin Y, Prats-Boluda G, Mas-Cabo J, Alberola-Rubio J, Perales A, Electrohysterography in the diagnosis of preterm birth: a review, Physiol. Meas. 39 (2018) 02TR01. [DOI] [PubMed] [Google Scholar]
- [5].Huber C, Shazly SA, Ruano R, Potential use of electrohysterography in obstetrics: a review article, J. Matern. Neonatal Med. 0 (2019) 1–7. doi: 10.1080/14767058.2019.1639663. [DOI] [PubMed] [Google Scholar]
- [6].Wu W, Wang H, Zhao P, Talcott M, Lai S, McKinstry RC, Woodard PK, Macones GA, Schwartz AL, Cahill AG, Cuculich PS, Wang Y, Noninvasive high-resolution electromyometrial imaging of uterine contractions in a translational sheep model., Sci. Transl. Med. 11 (2019) eaau1428. doi: 10.1126/scitranslmed.aau1428. [DOI] [PubMed] [Google Scholar]
- [7].Wilmink FA, Wilms FF, Heydanus R, Mol BWJ, Papatsonis DNM, Fetal complications after placement of an intrauterine pressure catheter: a report of two cases and review of the literature, J. Matern. Neonatal Med. 21 (2008) 880–883. [DOI] [PubMed] [Google Scholar]
- [8].Harper LM, Shanks AL, Tuuli MG, Roehl KA, Cahill AG, The risks and benefits of internal monitors in laboring patients, Am. J. Obstet. Gynecol. 209 (2013) 38. e1–38. e6. [DOI] [PMC free article] [PubMed] [Google Scholar]
- [9].Eswaran H, Govindan RB, Furdea A, Murphy P, Lowery CL, Preissl HT, Extraction, quantification and characterization of uterine magnetomyographic activity—a proof of concept case study, Eur. J. Obstet. Gynecol. Reprod. Biol. 144 (2009) S96–S100. [DOI] [PMC free article] [PubMed] [Google Scholar]
- [10].Escalona-Vargas D, Zhang M, Nehorai A, Eswaran H, Connectivity Measures of Uterine Activity using Magnetomyography, in: 2018 40th Annu. Int. Conf. IEEE Eng. Med. Biol. Soc., IEEE, 2018: pp. 5878–5881. doi: 10.1109/EMBC.2018.8513498. [DOI] [PMC free article] [PubMed] [Google Scholar]
- [11].Jain S, Saad AF, Basraon SS, Comparing Uterine Electromyography & Tocodynamometer To Intrauterine Pressure Catheter For Monitoring Labor, J. Woman’s Reprod. Heal. 1 (2016) 22–30. doi: 10.14302/issn.2381-862X.jwrh-15-771. [DOI] [Google Scholar]
- [12].Devedeux D, Marque C, Mansour S, Germain G, Duchêne J, Uterine electromyography: a critical review, Am. J. Obstet. Gynecol. 169 (1993) 1636–1653. [DOI] [PubMed] [Google Scholar]
- [13].Lucovnik M, Kuon RJ, Chambliss LR, Maner WL, SHI S, Shi L, Balducci J, Garfield RE, Use of uterine electromyography to diagnose term and preterm labor, Acta Obstet. Gynecol. Scand. 90 (2011) 150–157. [DOI] [PMC free article] [PubMed] [Google Scholar]
- [14].Jager F, Libenšek S, Geršak K, Characterization and automatic classification of preterm and term uterine records., PLoS One. 13 (2018) e0202125. doi: 10.1371/journal.pone.0202125. [DOI] [PMC free article] [PubMed] [Google Scholar]
- [15].Horoba K, Jezewski J, Matonia A, Wrobel J, Czabanski R, Jezewski M, Early predicting a risk of preterm labour by analysis of antepartum electrohysterograhic signals, Biocybern. Biomed. Eng. 36 (2016) 574–583. doi: 10.1016/J.BBE.2016.06.004. [DOI] [Google Scholar]
- [16].Garfield RE, Maner WL, Physiology and Electrical Activity of Uterine Contractions, 18 (2007) 289–295. [DOI] [PMC free article] [PubMed] [Google Scholar]
- [17].Rabotti C, Mischi M, Propagation of electrical activity in uterine muscle during pregnancy: A review, Acta Physiol. 213 (2015) 406–416. doi: 10.1111/apha.12424. [DOI] [PubMed] [Google Scholar]
- [18].Young RC, The Uterine Pacemaker of Labor, Best Pract. Res. Clin. Obstet. Gynaecol. (2018). [DOI] [PubMed] [Google Scholar]
- [19].Bulas D, Egloff A, Benefits and risks of MRI in pregnancy, Semin. Perinatol. 37 (2013) 301–304. [DOI] [PubMed] [Google Scholar]
- [20].Ray JG, Vermeulen MJ, Bharatha A, Montanera WJ, Park AL, Association between MRI exposure during pregnancy and fetal and childhood outcomes, Jama. 316 (2016) 952–961. [DOI] [PubMed] [Google Scholar]
- [21].Kok RD, de Vries MM, Heerschap A, van den Berg PP, Absence of harmful effects of magnetic resonance exposure at 1.5 T in utero during the third trimester of pregnancy: a follow-up study, Magn. Reson. Imaging. 22 (2004) 851–854. doi: 10.1016/J.MRI.2004.01.047. [DOI] [PubMed] [Google Scholar]
- [22].Wang Y, Rudy Y, Application of the method of fundamental solutions to potential-based inverse electrocardiography, Ann. Biomed. Eng. 34 (2006) 1272–1288. [DOI] [PMC free article] [PubMed] [Google Scholar]
- [23].Barry JS, V Anthony R, The pregnant sheep as a model for human pregnancy., Theriogenology. 69 (2008) 55–67. doi: 10.1016/j.theriogenology.2007.09.021. [DOI] [PMC free article] [PubMed] [Google Scholar]
- [24].Sorkine O, Cohen-Or D, Lipman Y, Alexa M, Rössl C, Seidel H-P, Laplacian surface editing, in: ACM Press, n.d.: p. 175. doi: 10.1145/1057432.1057456. [DOI] [Google Scholar]
- [25].Martin S, Thomaszewski B, Grinspun E, Gross M, Example-based elastic materials, ACM Trans. Graph. 30 (2011) 72. [Google Scholar]
- [26].Zhang M, La Rosa PS, Eswaran H, Nehorai A, Estimating uterine source current during contractions using magnetomyography measurements, PLoS One. 13 (2018) e0202184. [DOI] [PMC free article] [PubMed] [Google Scholar]
- [27].Liu M, Belfore LA, Shen Y, Scerbo MW, Uterine Contraction Modeling and Simulation, (2010). [Google Scholar]
- [28].Plonsey R, Action potential sources and their volume conductor fields, Proc. IEEE. 65 (1977) 601–611. [Google Scholar]
- [29].Ramanathan C, Rudy Y, Electrocardiographic imaging: II. Effect of torso inhomogeneities on noninvasive reconstruction of epicardial potentials, electrograms, and isochrones, J. Cardiovasc. Electrophysiol. 12 (2001) 241–252. [DOI] [PubMed] [Google Scholar]
- [30].Macfarlane PW, Van Oosterom A, Pahlm O, Kligfield P, Janse M, Camm J, Comprehensive electrocardiology, Springer Science & Business Media, 2010. [Google Scholar]
- [31].Aster RC, Borchers B, Thurber CH, Parameter Estimation and Inverse Problems, Academic Press, 2013. [Google Scholar]
- [32].Burnes JE, Taccardi B, Rudy Y, A noninvasive imaging modality for cardiac arrhythmias, Circulation. 102 (2000) 2152–2158. [DOI] [PMC free article] [PubMed] [Google Scholar]
- [33].Johnston PR, Gulrajani RM, A new method for regularization parameter determination in the inverse problem of electrocardiography, IEEE Trans. Biomed. Eng. 44 (1997) 19–39. doi: 10.1109/10.553710. [DOI] [PubMed] [Google Scholar]
- [34].Lange L, Vaeggemose A, Kidmose P, Mikkelsen E, Uldbjerg N, Johansen P, Velocity and directionality of the electrohysterographic signal propagation, PLoS One. 9 (2014) e86775. [DOI] [PMC free article] [PubMed] [Google Scholar]
- [35].Vasak B, Graatsma EM, Hekman-Drost E, Eijkemans MJ, van Leeuwen JHS, Visser GH, Jacod BC, Uterine electromyography for identification of first-stage labor arrest in term nulliparous women with spontaneous onset of labor, Am. J. Obstet. Gynecol. 209 (2013) 232. e1–232. e8. [DOI] [PubMed] [Google Scholar]
- [36].Zahran S, Diab A, Khalil M, Marque C, Source localization of uterine activity using Maximum Entropy on the Mean approach, in: 2018 IEEE 4th Middle East Conf. Biomed. Eng., IEEE, 2018: pp. 247–251. doi: 10.1109/MECBME.2018.8402442. [DOI] [Google Scholar]
- [37].Xu XG, Taranenko V, Zhang J, Shi C, A boundary-representation method for designing whole-body radiation dosimetry models: pregnant females at the ends of three gestational periods—RPI-P3, -P6 and -P9, Phys. Med. Biol. 52 (2007) 7023–7044. doi: 10.1088/0031-9155/52/23/017. [DOI] [PubMed] [Google Scholar]
- [38].Zhang M, Tidwell V, La Rosa PS, Wilson JD, Eswaran H, Nehorai A, Modeling Magnetomyograms of Uterine Contractions during Pregnancy Using a Multiscale Forward Electromagnetic Approach, PLoS One. 11 (2016) e0152421. doi: 10.1371/journal.pone.0152421. [DOI] [PMC free article] [PubMed] [Google Scholar]
- [39].Yochum M, Laforêt J, Marque C, Multi-scale and multi-physics model of the uterine smooth muscle with mechanotransduction, Comput. Biol. Med. 93 (2018) 17–30. [DOI] [PubMed] [Google Scholar]
Associated Data
This section collects any data citations, data availability statements, or supplementary materials included in this article.
Supplementary Materials
Data S1. Electrode_positions.xlsx
Materials and methods
Table S1. Wilcoxon signed-rank test results of activation time error


