

Abstract
Studies of sensorimotor integration often use sensory stimuli that require a simple motor response, such as a reach or a grasp. Recent advances in neural recording techniques, motion capture technologies, and time-synchronization methods enable studying sensorimotor integration using more complex sensory stimuli and performed actions. Here, we demonstrate that prehensile actions that require using complex sensory instructions for manipulating different objects can be characterized using high-density electroencephalography and motion capture systems. In 20 participants, we presented stimuli in different sensory modalities (visual, auditory) containing different contextual information about the object with which to interact. Neural signals recorded near motor cortex and posterior parietal cortex discharged based on both the instruction delivered and object manipulated. Additionally, kinematics of the wrist movements could be discriminated between participants. These findings demonstrate a proof-of-concept behavioral paradigm for studying sensorimotor integration of multidimensional sensory stimuli to perform complex movements. Such a framework will prove vital for studying neural control of movements in clinical populations in which sensorimotor integration is impaired due to information no longer being communicated correctly between brain regions (e.g. stroke). Such a framework is the first step towards developing a neural rehabilitative system for restoring function more effectively.
Index Terms—: Electroencephalography (EEG), Grasping, Kinematic Analysis, Mobile Brain/Body Integration (MoBI), Motion Capture (Mocap), Reaching, Sensorimotor Integration
I. Introduction
When reaching to grasp an object such as a coffee cup, information about the cup’s shape, location, and function are integrated to perform the movements necessary to drink from the cup. [1–3] Multiple neural pathways are required in order to access specific sensory information about an object (e.g. location, shape) and transform this information into the necessary motor commands that produce behavioral outcomes (in this example, reaching and grasping movements). [2, 3] Patients with focal neurologic injuries can lose the ability to perform such movements because communication along these neural pathways is disrupted. For example, patients with apraxia might not be able to use certain objects correctly even though they can identify the function of the objects and perform the correct movements if they do not involve interacting directly with the objects. [4] Clinically used rehabilitation therapies often do not take into account which neural pathways are damaged to determine the most effective means of restoring motor function. Developing a rehabilitative system that can identify the intact neural pathways involved in sensorimotor integration could lead to future therapies that target these pathways to restore function more effectively.
Sensorimotor integration studies involving non-human primates utilized high-density implanted microelectrode arrays and motion capture technologies to relate single neuron activity to complex arm, hand, and finger movements. [5–9] Arm and hand kinematics in a 3-dimensional workspace were decoded from local field potentials in primary motor cortex as subjects freely reached and grasped different objects. [7, 8] Neural recordings of primary motor cortex activity and motion capture of hand and arm kinematics identified different phases of reaching and grasping based on the location of specific objects being manipulated. [5, 6] When recording neural activity in posterior parietal cortex of nonhuman primates, neural activity has been shown to relate to the intention to move as well as what motor plans were performed. [10–12] One limitation to studying non-human primates is the difficulty of using complex sensory stimuli to study specific movements. Non-human primates are generally trained using operant conditioning to perform a sensorimotor task. As a result, these studies rely on simple sensory cues as instructions for performing the task. By translating these studies to humans, more complex sensory stimuli can be applied to capture more detailed mechanisms of sensorimotor integration.
Numerous studies on the ways in which humans reach and grasp have been conducted beginning with the pioneering work of Marc Jeannerod in the 1980s. [13, 14] Much of this work has characterized how the time-course of reaching and grasping (prehension kinematics) relates to different sensory (mainly visual) information. [15–18] Studies have expanded on the proposed role of the parietal-motor pathway for sensorimotor integration. Techniques such as functional magnetic resonance imaging (fMRI) have demonstrated that grasping activates dorsal but not ventral stream areas [19], primary motor cortex contains context sensitive outputs [20], and activity along the parietofrontal pathway activates in response to both executing and observing specific actions [21, 22]. Magnetoencephalography (MEG) studies have shown that the timing and duration with which observed and performed reach to grasp movements differed [23] and patients with hand dystonia have greater MEG-EMG coherence to the opponens pollicis muscle in the hand [24]. Studies involving transcranial magnetic stimulation (TMS) have demonstrated posterior parietal cortex plays a role in reaching to moving visual targets [25], and that electrical stimulation of the cortical surface over posterior parietal cortex evoked an intention or urge to move. [26] Event-related potentials (ERPs), derived from electroencephalography (EEG) recordings, have demonstrated that grasping movements can be identified and localized to specific areas of the brain (for a review see [27]). Recent studies have even demonstrated that the type of grasp performed (precision or power grasp) can be decoded from EEG signals. [28] These are but a small sample of the numerous studies involving different neuroimaging techniques that have analyzed the role of the parietofrontal pathway during sensorimotor integration. Many of these studies demonstrated clear links between recorded neural activity and the actions performed, however, they were limited by 1) only studying either the reach or the grasp (but not both), 2) only analyzing movement kinematics or neural activity for changes related to the reach or grasp, and 3) using relatively simple sensory stimuli to study sensorimotor integration when performing the reach or grasp.
Currently, experiments involving mobile brain/body imaging (MoBI) are studying how neural activity changes when motor tasks and cognitive tasks co-occur. [29–35] In such experiments, the same cognitive task is performed sitting (or standing) and walking to determine how movement kinematics and neural activity are affected. These studies use high-density EEG and motion capture technologies to identify neural changes due to the addition of a motor task (i.e. walking versus sitting). Combining these same technologies to study sensorimotor integration can allow for determining how complex sensory information can be used to perform detailed actions.
Here, we utilize an experimental paradigm in which complex sensory stimuli were used as instructions for performing specific actions. Participants used different sensory stimuli as instructions for interacting with a collection of sensorized toddler toys. Both neural activity and movement kinematics were analyzed to detect task-related changes in performance based on which instruction modality was used or which object was manipulated. Combining high-density EEG and motion capture technology with work-space object interactions involving complex sensory stimuli enables experimental designs to address sensorimotor integration in more detail. Such an approach could lead to systems that identify intact and damaged neural pathways based on real-time measurements of the allocation of neural resources in an effort to develop more effective, individualized neural rehabilitative therapies.
II. Methods
20 participants ages 18–32 (10 female, 10 male; 18 right-handed, 2 left-handed) participated in the study. All participants had normal or corrected-to-normal vision, and reported no history of psychiatric, neurological, or musculoskeletal disorders. The Institutional Review Board of the University of Rochester approved the experimental procedures, and all participants provided their written informed consent. All procedures were compliant with the principles laid out in the Declaration of Helsinki for the responsible conduct of research.
A. Experimental Setup
Participants were seated in front of a platform consisting of pairs of objects, a 24” computer monitor, and computer speakers (Figure 1). The participants viewed four pairs of objects arranged along a 90 cm wide by 48 cm deep platform. The computer monitor was placed above the objects so that it could be viewed by all participants without obstruction (cropped at the top of Figure 1A). Each object pair consisted of a primary object that was used to interact with a secondary object. These primary – secondary object pairs were: 1) a coin – piggy bank, 2) a cookie – cookie jar, 3) a hammer – pegs, and 4) a drill – toy crane. Participants were instructed to use their right hand to perform the task, regardless of which hand was dominant.
Fig. 1.

Diagram of behavioral task. A. Participants interacted with pairs of toddler toys: drill – crane, coin – bank, cookie – jar, hammer – peg. Participants first held down the home button (green button) until an instruction was delivered. Coordinate axes labeled in white in lower right. The computer monitor rested above the secondary objects and is cropped in the photo for visualization purposes. B. Instructions contained a sensory component and a contextual information component. Sensory components were either visual or auditory. Contextual information either contained explicit or implicit information about the primary object. Examples depicted for the cookie – coin object pair. C. Trial structure of the task. Participants held the home button down for a variable initial hold until an instruction was delivered. Upon releasing the home button, participants moved to the target object. After using the correct primary object a reward was delivered for 1000 ms in the form of a partying dog. After reward, participants then pressed the home button again to start the next trial.
The behavioral task was controlled by custom software written in Presentation (Neurobehavioral Systems) which also generated behavioral event markers relating to stimulus triggers and behavioral responses. A trial began when the participant used his or her right hand to press down a central home button. The button was positioned to be a distance of 20 to 30 cm from any of the objects (3D Euclidean distance) and located along the mid-sagittal plane of the participant. The location of the central button was variable due to participants slightly shifting their starting positions to perform the task comfortably. Closing the home button switch sent a behavioral event marker to Presentation via an Arduino Leonardo (onboard ATmega32u4 Microcontroller, 2M baud rate, parity none, 8 bits, 1 stop) and displayed text stating “please hold down the button” on the computer screen. After a variable initial hold period (1000 to 1500 ms) during which the participant held down on the central home button, the text on the screen was removed and a visual or auditory stimulus was delivered as an instruction for one of the primary objects. The sensory stimuli contained contextual information either explicitly or implicitly describing the identity of the primary object. For visual stimuli, an image appeared on the computer monitor and remained until the end of the trial. For auditory stimuli, a sound file was played through a pair of computer speakers (Altec Lansing VS3030). For example, if the target object was the coin then the instructions were as follows: 1) visual explicit – picture of a coin, 2) visual implicit – picture of the piggy bank, 3) auditory explicit – the phrase “put the coin in the piggy bank,” and 4) auditory implicit – the phrase “put the object in the piggy bank.”
Upon identifying the target primary object, participants removed their hand from the home button, sending another behavioral event marker to Presentation indicating movement onset. As the participant reached to and picked up the target primary object (coin, cookie, hammer, drill), a magnet embedded in each primary object opened a reed switch to indicate when the object was removed from the sensorized platform. Each switch sent a logic TTL signal to the Arduino which communicated a behavioral event marker related to the primary object contacted to Presentation. Participants then used the primary object to interact with the secondary object: putting the coin in the bank, putting the cookie in the jar, hitting the peg with the hammer, and driving a screw with the drill. For the cookies and coins, a cluster of 4 each was placed on the sensorized platform. After all four of either the coins or the cookies were used, the experimenters removed all the coins and cookies from bank and jar, respectively. The hammer and drill were always placed back on the platform to reset the reed switch. Upon successfully using the primary target object to interact with the secondary object, a “reward” was delivered in the form of a picture of a dog for 1000 ms to provide feedback to the participant that the trials were being performed correctly. If participants did not pick up the correct primary object, no reward was delivered. Upon completion of the trial, participants could then press and hold the home button again to start a new trial.
Presentation logged the following behavioral event markers: 1) initiation of the trial (detected upon pressing the home button), 2) instruction onset (start of the audio or visual stimulus controlled by Presentation), 3) movement onset (detected upon release of the home button), 4) target primary object contact (detected by reed switches mounted underneath the platform holding all the primary objects) and 5) reward delivery (controlled by Presentation). Participants had an allowable reaction time of 5000 ms (time from instruction delivery to movement onset) and movement time of 5000 ms (time from movement onset to primary object contact). The instructed objects were presented in a pseudorandomized block design accounting for the sensory modality and contextual information of the instruction for each object (4 instructions, 4 objects, totaling 16 trials per block). After participants performed a set of 5 blocks (80 total trials), they were offered a break before beginning the next set of 5 blocks of trials.
Electroencephalography (EEG) data were recorded from 64 electrodes (digitized at 2048Hz) using a BioSemi Active Two System (BioSemi Inc, Figure 2A). Neural activity was re-referenced offline to a common average reference across all 64 electrodes. Motion capture of the upper body was recorded using a 16 camera OptiTrack system (Prime 41 cameras), and Motive software (Optitrack Inc). The upper body skeleton captured movements of the arm and wrist position of both hands (Figure 2B). Cameras recorded 25 markers along the torso and both arms and hands at 360 frames per second. Time-synchronization of the stimulus triggers from Presentation, behavioral responses from the buttons and switches, motion tracking data, and EEG data was conducted with Lab Streaming Layer (LSL) software (Swartz Center for Computational Neuroscience, University of California, San Diego, CA; available at: https://github.com/sccn/labstreaminglayer). Motion capture data were recorded using custom software written to rebroadcast the data from the Motive software to the LSL lab recorder. EEG Data was recorded from available LSL streaming plugins for the BioSemi system. Behavioral event markers were recorded using built-in the LSL functionality in the Presentation software. All behavioral, EEG, and kinematics data analyses were performed using custom MATLAB scripts (MathWorks, Natick, MA) and/or functions from EEGLAB. [36]
Fig. 2.

A. High-density electroencephalography (EEG) recorded from 64-channel system (BioSemi Inc). B. Motion capture information collected from Optitrack System (Optitrack Inc.) capturing arm and hand position.
B. Behavioral Performance Analysis
Successful trials were defined as trials in which 1) held the home button for the required duration, 2) reacted within the predefined allowed reaction time (5000 ms), 3) contacted the correct primary object given the delivered instruction, and 4) contacted the correct primary object within the predefined allowed movement time (5000 ms). Reaction times were measured from the end of the instruction until the time the home button was released. Negative reaction times indicate the participant moved before the instruction was completed (which occurred for the longer duration auditory instructions). Movement times were measured from the time the home button was released until the time the target primary object was contacted.
C. Kinematic Analysis
Motion capture analyses were performed to detect wrist position of the right hand throughout the task. Markers were placed about the upper body in accordance to the skeletal markers defined by OptiTrack Motive::Body tracking software. A total of 25 markers were placed at the following positions on the body: 5 Torso markers (“chest” at center of sternum, “backTop” on the spine below the neck, “backLeft” and “backRight” on each side of the back slightly below the scapular bone), 4 waist markers (“WaistLFront” and “WaistRFront” placed on protruding bone on front of pelvis (left/right anterior iliac spine bone, “WaistLBack” and “WaistRBack” placed above left and right hip, approximately 10 cm from hip joint), 4 shoulder markers (“LShoulderBack” and “RShoulderBack” on the shoulder joint (glenohumerol joint) on the back, “LShoulder Top” and “RShoulder Top” placed at the top of the shoulder on the distal end of the clavical bone (acrominoclivicular joint)), 3 head markers (“Head top” placed on the apex of the head, “HeadFront” placed at the center of the forehead, “HeadSide” placed on the right side of the head slightly above the ear), 4 arm markers (“LElbowOut” and “RElbowOut” placed on the lateral epicondyle of the distal end of the humerous, “LUArmHigh” and “RUArmHigh” placed on the back of the upper arm near the groove between the triceps), and 6 hand markers (“LWristOut” and “RWristOut” placed on the lateral side of the wrist axis distal end of the radius bone, “LWristIn” and “RWristIn” placed on the inner prominence (medial side) of the wrist axis distal end of the ulnar bone, and “LHandOut” and “RHandOut” placed slightly below the pinky knuckle between the distal end of the fifth and fourth metacarpal bones). Upon placing these markers correctly on the body, the Motive::Body software was able to capture and create a skeleton for tracking the movements.
All movements were performed with the right hand. Kinematic activity was sampled at 360 frames per second with the exception of one participant in which the sampling rate was incidentally set to 120 frames per second. For this dataset, movement kinematics were upsampled to 360Hz using the matlab ‘spline’ function. For each trial, continuous three-dimensional data of wrist position and velocity (measured from marker “RWristOut”) were parsed into epochs beginning 2500 ms before and extending until 2000 ms after movement onset (subsequently movement onset is indicated by time = 0).
For each epoch, the baseline hold period was defined as [−2000 ms to −250 ms] relative to movement onset. Trials containing missing data points were interpolated using the ‘spline’ function in Matlab. Trials were excluded from subsequent analysis if 1) there were more than 400 ms of consecutive motion capture data missing, 2) if more than 25% of the epoch (1125 ms) needed to be interpolated, 3) if extremely improbable outliers existed in which the wrist position exceeded 100 m from the starting position (0,0,0 at the home button), and 4) if the mean or variance of the wrist position (x, y, or z) during the baseline period was more than 3 scaled median absolute deviations from the median (using the Matlab function ‘isoutlier’). For each participant, the wrist-position was re-centered at the median baseline of all accepted trials.
Because participants’ movement times differed on each trial, the time from movement onset to object contact was normalized to 500 samples (L). This allowed for comparing the movement trajectories across trials. The baseline period before movement onset was kept at the initial sampling frequency. Wrist position and wrist velocity were compared based on the instruction used to perform each action. A two-way multivariate analysis of variance (MANOVA) was performed on the wrist position or wrist velocity, separately, as a function of the object, instruction, and the interaction (using the Matlab function ‘manova’). The Wilks’ test statistic (Λ) was reported at each time step to compare the between sum of squares to within sum of squares. [37, 38] The Λ value ranges from 0 to 1 to measure how much each MANOVA factor contributed to the overall covariance. A value of 0 indicates the factor in question contributes more to the model. Λ values for the object, instruction, and interaction were measured at each normalized time step to detect when each contributed to the overall model of wrist position and velocity.
D. EEG Analysis
EEG data from each electrode were bandpass filtered using the zero-phase filtfilt function in Matlab (Chebyshev Type II bandpass filter, 1.0 Hz to 45 Hz, Astop 65 dB, Apass 1dB). Then the signal was downsampled from 2048 Hz to 256 Hz. Bad electrodes to be interpolated were identified based on electrode covariance and standard deviation. Data from each electrode were first z-scored and then the covariance matrix of all the data was computed. The standard deviation of the covariance matrix (σcov) and the EEG data (σEEG) was then calculated. Bad electrodes were identified if σcov < mean (σcov)/3 or σEEG > 3 × mean(σEEG). The identified bad electrodes were removed and interpolated (spherical interpolation) using data from neighboring electrodes. The baseline activity from each electrode was removed and all the channels were re-referenced to the common average.
Independent components analysis (ICA) was performed to identify and remove eye movement artifacts. First, principal components analysis (PCA) was performed to estimate the number of components that matched the rank of the EEG data. The function runica was then used to calculate the independent components (ICs).[39] After estimating the ICs, the components most related to eye blinks were detected and removed using the EEGLab function ICLabel. [40]
For each electrode, event-related potentials (EPRs) were created from epochs −2000 ms to +2500 ms around each behavioral event. The baseline (−2000 ms to −1000 ms prior to movement onset or object contact) was subtracted to remove low frequency offsets. For each electrode, the maximum value of the rectified epoch was calculated. If the maximum value exceeded 500 μV or exceeded 2 standard deviations from the mean of all the maximum values from that electrode, the epoch was rejected. EEG epochs were also excluded if the trial was not a successful trial as defined in II.A or if the motion capture data were also excluded as defined in II.B.
E. Statistical Analyses
For analysis of the behavioral responses (reaction times, movement times), the data were not normally-distributed based on a lilliefor’s test (p<0.001 for reaction times and movement times). Therefore, a non-parametric Kruskal-Wallis test was performed on the reaction times by instruction type (visual-implicit, visual-explicit, auditory-explicit, and auditory-implicit), and performed on the movement times by object (coin, cookie, hammer, drill). Tukey’s Honest Significant Difference (HSD) post-hoc tests were subsequently performed.
For comparisons of the EEG event-related potentials stratified by instruction or object, repeated measures analyses of variance (RM-ANOVA) were performed over a window of −500 ms to 500 ms relative to either movement onset or object contact behavioral event markers.
For comparisons of wrist position and wrist velocity kinematic activity, multivariate ANOVA (MANOVA) was performed (object, instruction, and interaction) at each normalized time step (500 steps). P-values were corrected for multiple comparison using Bonferroni’s correction (< 0.05/500 time steps = 1e-4).
III. Results
On average, 398 [356, 400] trials (median, [25th 75th percentiles]) were performed by each participant while neural activity and movement kinematics were synchronously recorded (Table I). Due to the task simplicity, performance on the task was 99.7% [99.4%, 100%] correct. After rejecting trials due to noisy EEG epochs, missing motion capture data, or unsuccessful trials an average of 178 [155 201] trials were included for subsequent analysis for each participant.
TABLE I.
Reaction times by instruction modality
| Instruction Modality | Reaction Time (ms) |
|---|---|
| Median [25th, 75th percentile] | |
| Visual – Explicit | 477 ms [−37 ms, 576 ms] |
| Visual – Implicit | 479 ms [−44 ms, 613 ms] |
| Auditory – Explicit | −359 ms [−791 ms, −23 ms] |
| Auditory – Implicit | −202 ms [−407 ms, −31 ms] |
A. Behavioral task performance
A summary of each participant’s reaction and movement times is listed in Table II. Participants’ reaction times to either explicit or implicit visual instructions were significantly faster than to explicit or implicit auditory instructions (p < 4e-9, Kruskal-Wallis test followed by Tukey’s Post-hoc test for multiple comparisons). This is most likely a result of auditory instructions involving a temporally evolving stimulus (spoken phrase) whereas the visual stimulus was a static image. No significant difference in reaction times to visual explicit or visual implicit instructions was detected (p=0.84). Interestingly, participants reacted faster to the auditory implicit instructions compared to the auditory explicit instructions (p<7e-6). No significant difference was detected on the participants’ reaction times based on which object was instructed (p=0.75, Kruskal-Wallis test, p>0.73 on all Tukey’s post-hoc tests).
TABLE II.
Movement times by target object
| Target Object | Movement Time (ms) |
|---|---|
| Median [25th, 75th percentile] | |
| Coin | 685 ms [588 ms, 842 ms] |
| Cookie | 702 ms [596 ms, 837 ms] |
| Hammer | 652 ms [573 ms, 759 ms] |
| Drill | 785 ms [691 ms, 908 ms] |
A similar analysis was conducted on the movement times. When analyzing each participants movement times, there was no significant difference based on what type of instruction was delivered (p=0.44, Kruskal-Wallis test). There was, however a significant difference in movement times based on which object was instructed (p<7e-42, Kruskal-Wallis test). Movements to the drill took the longest on average (p<4e-9 compared to either the cookie, coin, or hammer, Tukey’s post-hoc test), whereas movements to the hammer took the fastest on average (p<7e-4 compared to the other objects, Tukey’s post-hoc test). No significant different in movement time was detected between the coin and cookie (p=0.74).
B. Kinematic Trajectories
The position and velocity of the wrist were compared in three dimensional coordinates to determine how movements changed based on the instruction used and the object contacted. Figure 3A. depicts the kinematic trajectories of the right wrist for each participant, with a group average depicted in a thick line. Figure 3B depicts the average velocity in the x, y, and z directions. A two-way multivariate analysis of variance (MANOVA) was performed separately on the three dimensional position and velocity data at each time step separately. The Wilk’s lambda statistic was plotted in Figure 3C and 3D for the position and velocity, respectively, to determine when the variance accounted most for the object contacted, the instruction performed, or their interaction. Λ values close to 0 indicate variance for that factor accounted for the majority of variance in the MANOVA model, whereas values of 1 indicate variance for that factor contributed little to the model. Solid lines in Figure 3C and 3D indicate the MANOVA p-value was significant (dotted lines indicate the MANOVA p-value was not significant) after Bonferroni correction for multiple comparisons at each time step (p < 0.05/500 = 1e-4). Consistent with the movement time results presented earlier, a significant object effect of object was detected for both position and velocity throughout the movement. The Wilk’s lambda statistic reached close to 0 for the position data towards the end of the movement (Figure 3C) and for the velocity movement in between movement and contact near peak velocity (Figure 3D).
Fig. 3.

A. Kinematic trajectories of the right wrist averaged across 20 participants. Traces color coded for each object: coin-bank (blue), cookie-jar (red), hammer-peg (yellow), drill-crane (purple). Thin traces are averaged trials for each individual, thick traces are group averages. B. Velocity traces corresponding to each participant depicted in A. Velocities depicted in the x (top), y (middle), and z (bottom) directions. Time normalized to 500 time steps from movement onset (move) to object contact (contact). Color code the same as A. C., D. Wilk’s lambda statistics for the instruction, object, and interaction (instruction × object) effects at each based on three dimensional values from the C. position and D. velocity. Each trace was color coded for the different MANOVA factors: instruction (green), object (cyan), instruction × object (maroon). Solid lines indicate significant MANOVA p-values, dashed lines indicate not significant MANOVA p-values after Bonferroni correction for multiple comparisons.
C. Task-related neural activity
During reaching and grasping, sensory information is communicated from posterior parietal cortex to motor cortex which executes the movements. Here, we analyzed neural activity recorded from an electrode located over motor cortex (C5) and another electrode located over parietal cortex (P3) to identify task-related changes based on the instruction used or object contacted.
Over motor cortex (Figure 4), activity from −500 ms to +500 ms relative to movement onset demonstrated significant differences based on the instructions used (p < 5e-8, RMANOVA). Additionally, neural activity differentiated the target object contacted (p < 8e-7). Even though the RM-ANOVA tests found specific effects of instruction and object, Tukey’s honest significant difference post-hoc tests did not detect specific pairs of instructions or objects that had significant differences.
Fig. 4.
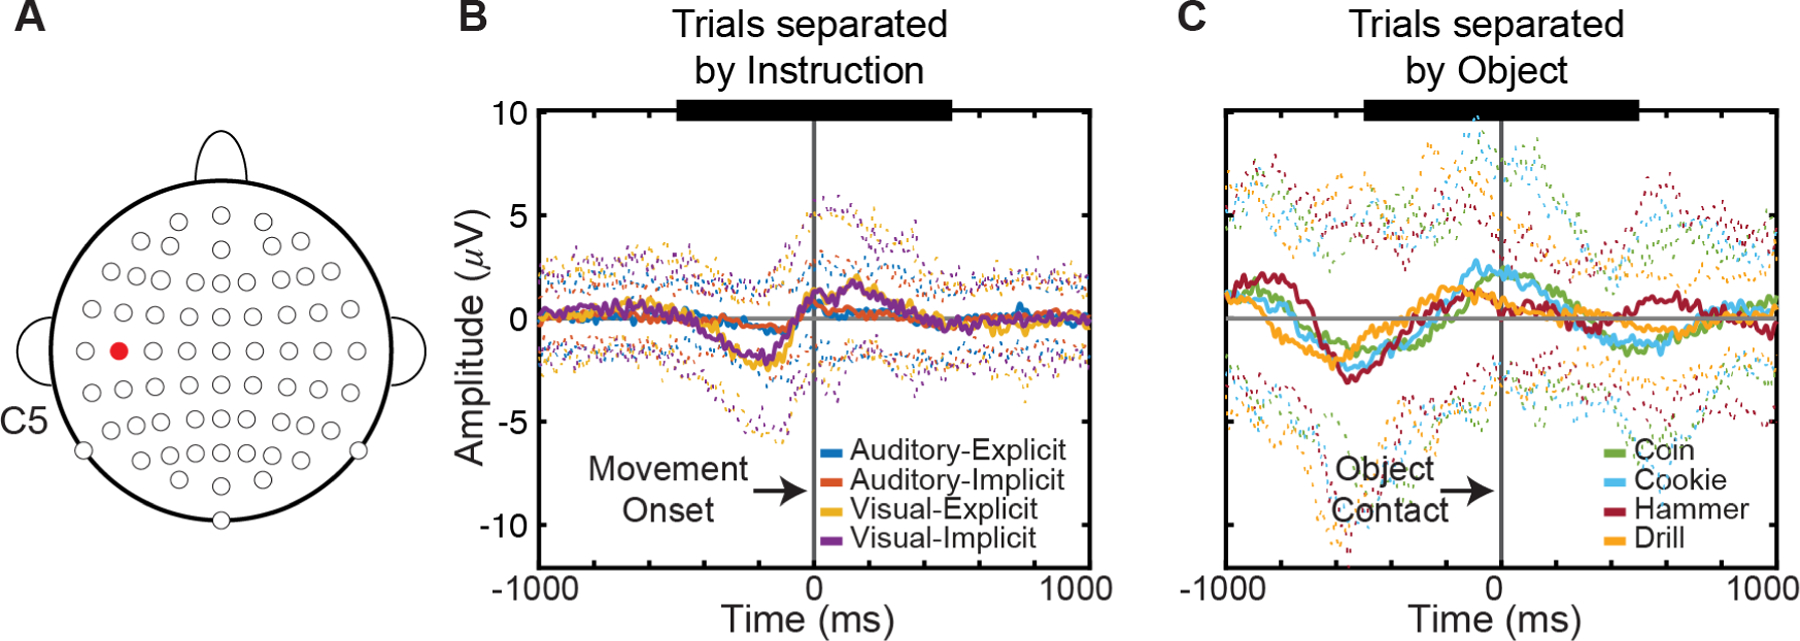
Event-related activity near motor cortex. A. Electrode C5 (highlighted in red) thought to be located over sensorimotor cortex. B. Event-related potentials aligned to movement onset demonstrate instruction separation. Traces separated by instruction modality: auditory-explicit (blue), auditory-implicit (red), visual-explicit (yellow), visual-implicit (purple). Solid lines show mean ERP signal across 20 participants. Color-coded dotted lines show +/−2 standard deviations from the mean. Epochs aligned on movement onset (vertical gray line). Thick black line on top indicate region where RM-ANOVA performed (−500 to 500 ms). C. Event-related potentials aligned to object contact. Traces separated by each object: coin (olive green), cookie (cyan), hammer (maroon-red), drill (orange-yellow). Color-coded dotted lines show +/− 2 standard deviations from the mean. Epochs aligned on object contact (vertical gray line). Thick black line on top indicate region where RM-ANOVA performed (−500 to 500 ms).
When comparing neural activity recorded over parietal cortex a similar finding was detected (Figure 5). Neural activity showed significance differences based on the instructions used (p < 0.05). Parietal activity also separated based on object contacted (p < 6e-4). Only the auditory-explicit and visual-implicit instructions showed significant differences after post-hoc tests (p<0.03, Tukey’s Honest Significant Difference). Overall, the ability to detect effects of both the instructions used and the objects contacted within this behavioral task provides a powerful tool for future studies to identify information communicated over different neural pathways.
Fig. 5.

Event-related activity near posterior parietal cortex. A. Electrode P3 (highlighted in red) thought to be located over posterior parietal cortex. B. Event-related potentials aligned to movement onset demonstrate instruction separation. C. Event-related potentials aligned to object contact. onset demonstrate instruction separation. C. Event-related potentials aligned to object contact. Conventions the same as Fig. 4.
IV. Discussion
Previous studies of sensorimotor integration either use complex sensory stimuli but require a simple motor response or use simple stimuli requiring more complex movements. [5–9] Here, we demonstrate that state-of-the-art motion capture technologies and high-density EEG systems provide the framework for studying how the nervous system performs multidimensional sensorimotor integration. These techniques have been previously applied to MoBI experiments to study neural changes in cognitive tasks as additional motor demands are introduced. Rather than adding an additional motor task, we used sensory stimuli containing different modalities and contextual information that were combined to evoke complex reaching, grasping, and manipulating actions of different objects.
The work presented here demonstrates a proof-of-concept system for studying sensorimotor integration. We were able to track simple arm movements with a focus on the wrist position which provided a simplified measure of the reach direction of the arm. This was due to the limitation of only having 6 markers on each arm to track the position of the limb throughout the task. Future studies will be able to incorporate additional markers to provide more spatial resolution of the arm and hand as well as attempt to discriminate individual finger movements as has been performed previously in studies of non-human primates. [5, 6] Having more detailed kinematic recordings of the hands and fingers will allow characterization of more complex sensorimotor integration actions.
By delivering complex sensory stimuli to be used as instructions for performing detailed actions, we were able to characterize changes in movement kinematics and neural activity. Previous studies of reaching and grasping often use a simple sensory cue as an instruction for performing different actions. [5–9] Here, we show that neural activity near motor cortex and posterior parietal cortex in the left hemisphere produce ERPs that differentiate the instruction used and the action performed. The ERPs were able to differentiate the sensory modality used as instruction for performing the task, although no effect was observed based on the contextual information delivered. The visual instructions that were displayed here were static pictures that delivered all the information to the user at once. Comparatively, the auditory instructions are spoken phrases that delivered information over the course of the temporally changing stimulus. Future studies will require temporally changing visual and auditory stimuli that attempt to synchronize the delivery of information throughout the time-series. This will take the form of a movie in which either the video or audio is presented. Such sensory instructions are more complex to deliver but allow for comparing time series information between the auditory and visual stimuli. Alternatively, more simplistic stimuli could be used which require participants to learn associations between a specific LED turning on or a specific auditory tone with different actions, however, this loses some of the naturalness of the instructions that provide for a richer dataset.
Over both motor and posterior parietal cortical regions, EEG waveforms associated with reaching differed and were dependent on the object being contacted. It is important to note that in the current design objects were always in the same spatial location. Thus, the observed effect might be due to the location of the object rather than dependent upon the object itself. Previous studies in non-human primates demonstrated that moving the same object to different locations evokes different neural responses and kinematic responses. [5, 6] Activity in parietal cortex has been shown to respond to the intention or awareness of the actions about to be performed. [12, 25, 26] Posterior parietal cortex and dorsal premotor cortex have been found to specify a target’s spatial location and which hand was used to reach to the target. [41] The findings presented here are consistent with these previous studies of sensorimotor integration. The system proposed here provides the ability to relate the synchronously recorded neural activity and movement kinematics to aspects of sensorimotor integration such as performing the same actions in different locations, performing different actions in response to different sensory stimuli, and performing actions based on different cognitive functions (e.g. intention, motor attention, decision making). Subsequent studies can randomize key features of the task (e.g. object location or sensory instruction) to further examine how these task features change the measured ERPs in each area. Additionally, end-effector kinematics can be compared with intrinsic configurations such as joint angles to determine how cognitive features such as intent or decision making relate to the recorded neural activity. Separating intent from the goal directed activity might help further identify the role of posterior parietal cortex during sensorimotor integration.
The use of toys to study common reach-to-grasp responses (e.g. precision pinch, power grasp) provided participants with more engagement in performing the task than is often used in reaching or grasping experiments. Here we instrumented a collection of toddler toys (coincidentally all of the participants were ages 18 years or older), however other objects and devices could be sensorized in a similar manner. For example, objects involved in activities of daily living [42] (e.g. pitcher of water, eating utensils) could be instrumented to detect when objects were interacted with in addition to the simultaneously recorded neural activity and movement kinematics. Overall, this framework provides a unique means of engaging participants and reducing boredom that might occur in more traditional experimental designs.
V. Significance and Future Work
The findings presented here demonstrate a proof-of-concept for studying sensorimotor integration of multidimensional sensory stimuli to perform complex movements. These results will provide a means for studying how information is communicated between different areas of the brain when different sensory information is delivered or different actions are performed. Visual information about an object’s shape and location are hypothesized to be communicated from posterior parietal cortex to premotor and primary motor cortex which create and execute plans for reaching and grasping. Effective connectivity techniques [43–47] provide a means of inferring how sensory information is communicated to motor cortex based on the neural recordings. Additionally, more complex biomechanical models of the upper limb can be applied to capture the intrinsic joint angles performed when different cognitive functions are required of the task (e.g. intention, awareness, decision making). Using our MoBI paradigm, we can use effective connectivity techniques (e.g. Event-related causality [48–51]) to identify how instructional information is communicated between different brain regions and dissociate information related to motor control from cognitive functions of motor intention and motor awareness. [12, 26, 52, 53]
Ultimately, this experimental setup will also prove to be an important framework for studying neural control of movements in different patient populations. For patients with a neurologic injury affecting sensorimotor integration (e.g. stroke, Parkinson’s disease) neural information might be communicated differently compared to healthy individuals performing the same actions. Combining high-density neural recordings with motion capture technologies will enable studying how neurologic diseases or injuries affect the neural processing needed to perform specific movements. Developing a tool to identify where and how neural information is no longer processed correctly is the first step towards developing a neural rehabilitative system for restoring function more effectively.
VI. Acknowledgements
The authors thank each of the participants that enrolled in the study. The authors also thank Suzan Hoffman and Soma Mizobuchi for their assistance during the study.
This work was supported in part by a grant from the Roberta K. Courtman Revocable Trust (EGF). KAM was supported by the University of Rochester Clinical and Translational Science Institute (CTSI) Career Development Program (KL2), NIH Grant 5KL2TR001999.
References
- [1].Rizzolatti G and Luppino G, “The cortical motor system,” Neuron, vol. 31, no. 6, pp. 889–901, September 27 2001. [Online]. Available: https://www.ncbi.nlm.nih.gov/pubmed/11580891. [DOI] [PubMed] [Google Scholar]
- [2].Grafton ST, “The cognitive neuroscience of prehension: recent developments,” Exp Brain Res, vol. 204, no. 4, pp. 475–91, August 2010, doi: 10.1007/s00221-010-2315-2. [DOI] [PMC free article] [PubMed] [Google Scholar]
- [3].Karl JM and Whishaw IQ, “Different evolutionary origins for the reach and the grasp: an explanation for dual visuomotor channels in primate parietofrontal cortex,” Frontiers in neurology, vol. 4, p. 208, December 23 2013, doi: 10.3389/fneur.2013.00208. [DOI] [PMC free article] [PubMed] [Google Scholar]
- [4].Gross RG and Grossman M, “Update on apraxia,” Curr Neurol Neurosci Rep, vol. 8, no. 6, pp. 490–6, November 2008. [Online]. Available: https://www.ncbi.nlm.nih.gov/pubmed/18957186. [DOI] [PMC free article] [PubMed] [Google Scholar]
- [5].Rouse AG and Schieber MH, “Spatiotemporal Distribution of Location and Object Effects in Primary Motor Cortex Neurons during Reach-to-Grasp,” The Journal of neuroscience : the official journal of the Society for Neuroscience, vol. 36, no. 41, pp. 10640–10653, October 12 2016, doi: 10.1523/JNEUROSCI.1716-16.2016. [DOI] [PMC free article] [PubMed] [Google Scholar]
- [6].Rouse AG and Schieber MH, “Spatiotemporal distribution of location and object effects in reach-to-grasp kinematics,” Journal of neurophysiology, vol. 114, no. 6, pp. 3268–82, December 2015, doi: 10.1152/jn.00686.2015. [DOI] [PMC free article] [PubMed] [Google Scholar]
- [7].Zhuang J, Truccolo W, Vargas-Irwin C, and Donoghue JP, “Decoding 3-D reach and grasp kinematics from high-frequency local field potentials in primate primary motor cortex,” IEEE Trans Biomed Eng, vol. 57, no. 7, pp. 1774–84, July 2010, doi: 10.1109/TBME.2010.2047015. [DOI] [PMC free article] [PubMed] [Google Scholar]
- [8].Vargas-Irwin CE, Shakhnarovich G, Yadollahpour P, Mislow JM, Black MJ, and Donoghue JP, “Decoding complete reach and grasp actions from local primary motor cortex populations,” The Journal of neuroscience : the official journal of the Society for Neuroscience, vol. 30, no. 29, pp. 9659–69, July 21 2010, doi: 10.1523/JNEUROSCI.5443-09.2010. [DOI] [PMC free article] [PubMed] [Google Scholar]
- [9].Saleh M, Takahashi K, and Hatsopoulos NG, “Encoding of coordinated reach and grasp trajectories in primary motor cortex,” The Journal of neuroscience : the official journal of the Society for Neuroscience, vol. 32, no. 4, pp. 1220–32, January 25 2012, doi: 10.1523/JNEUROSCI.2438-11.2012. [DOI] [PMC free article] [PubMed] [Google Scholar]
- [10].Snyder LH, Batista AP, and Andersen RA, “Coding of intention in the posterior parietal cortex,” Nature, vol. 386, no. 6621, pp. 167–70, March 13 1997, doi: 10.1038/386167a0. [DOI] [PubMed] [Google Scholar]
- [11].Cohen YE and Andersen RA, “A common reference frame for movement plans in the posterior parietal cortex,” Nature reviews. Neuroscience, vol. 3, no. 7, pp. 553–62, July 2002, doi: 10.1038/nrn873. [DOI] [PubMed] [Google Scholar]
- [12].Andersen RA and Cui H, “Intention, action planning, and decision making in parietal-frontal circuits,” Neuron, vol. 63, no. 5, pp. 568–83, September 10 2009, doi: 10.1016/j.neuron.2009.08.028. [DOI] [PubMed] [Google Scholar]
- [13].Jeannerod M, “The formation of finger grip during prehension. A cortically mediated visuomotor pattern,” Behav Brain Res, vol. 19, no. 2, pp. 99–116, February 1986. [Online]. Available: https://www.ncbi.nlm.nih.gov/pubmed/3964409. [DOI] [PubMed] [Google Scholar]
- [14].Jeannerod M, “The timing of natural prehension movements,” J Mot Behav, vol. 16, no. 3, pp. 235–54, September 1984. [Online]. Available: https://www.ncbi.nlm.nih.gov/pubmed/15151851. [DOI] [PubMed] [Google Scholar]
- [15].Goodale MA, Jakobson LS, and Keillor JM, “Differences in the visual control of pantomimed and natural grasping movements,” Neuropsychologia, vol. 32, no. 10, pp. 1159–1178, October 1994. [DOI] [PubMed] [Google Scholar]
- [16].Goodale MA, “Transforming vision into action,” Vision Res, vol. 51, no. 13, pp. 1567–87, July 1 2011, doi: 10.1016/j.visres.2010.07.027. [DOI] [PubMed] [Google Scholar]
- [17].Goodale MA, Milner AD, Jakobson LS, and Carey DP, “A neurological dissociation between perceiving objects and grasping them,” Nature, vol. 349, no. 6305, pp. 154–6, January 10 1991, doi: 10.1038/349154a0. [DOI] [PubMed] [Google Scholar]
- [18].Bootsma RJ, Marteniuk RG, MacKenzie CL, and Zaal FT, “The speed-accuracy trade-off in manual prehension: effects of movement amplitude, object size and object width on kinematic characteristics,” Exp Brain Res, vol. 98, no. 3, pp. 535–41, 1994. [Online]. Available: https://www.ncbi.nlm.nih.gov/pubmed/8056073. [DOI] [PubMed] [Google Scholar]
- [19].Culham JC, Danckert SL, DeSouza JF, Gati JS, Menon RS, and Goodale MA, “Visually guided grasping produces fMRI activation in dorsal but not ventral stream brain areas,” Exp Brain Res, vol. 153, no. 2, pp. 180–9, November 2003, doi: 10.1007/s00221-003-1591-5. [DOI] [PubMed] [Google Scholar]
- [20].Gandolla M et al. , “Re-thinking the role of motor cortex: context-sensitive motor outputs?,” Neuroimage, vol. 91, pp. 366–74, May 1 2014, doi: 10.1016/j.neuroimage.2014.01.011. [DOI] [PMC free article] [PubMed] [Google Scholar]
- [21].Buccino G et al. , “Neural circuits underlying imitation learning of hand actions: an event-related fMRI study,” Neuron, vol. 42, no. 2, pp. 323–34, April 22 2004. [Online]. Available: https://www.ncbi.nlm.nih.gov/pubmed/15091346. [DOI] [PubMed] [Google Scholar]
- [22].Rizzolatti G and Sinigaglia C, “The functional role of the parietofrontal mirror circuit: interpretations and misinterpretations,” Nature reviews. Neuroscience, vol. 11, no. 4, pp. 264–74, April 2010, doi: 10.1038/nrn2805. [DOI] [PubMed] [Google Scholar]
- [23].Virji-Babul N, Moiseev A, Cheung T, Weeks D, Cheyne D, and Ribary U, “Spatial-temporal dynamics of cortical activity underlying reaching and grasping,” Hum Brain Mapp, vol. 31, no. 1, pp. 160–71, January 2010, doi: 10.1002/hbm.20853. [DOI] [PMC free article] [PubMed] [Google Scholar]
- [24].Tecchio F et al. , “Sensorimotor integration in focal task-specific hand dystonia: a magnetoencephalographic assessment,” Neuroscience, vol. 154, no. 2, pp. 563–71, June 23 2008, doi: 10.1016/j.neuroscience.2008.03.045. [DOI] [PubMed] [Google Scholar]
- [25].Desmurget M, Epstein CM, Turner RS, Prablanc C, Alexander GE, and Grafton ST, “Role of the posterior parietal cortex in updating reaching movements to a visual target,” Nature neuroscience, vol. 2, no. 6, pp. 563–7, June 1999, doi: 10.1038/9219. [DOI] [PubMed] [Google Scholar]
- [26].Desmurget M, Reilly KT, Richard N, Szathmari A, Mottolese C, and Sirigu A, “Movement intention after parietal cortex stimulation in humans,” Science, vol. 324, no. 5928, pp. 811–3, May 08 2009, doi: 10.1126/science.1169896. [DOI] [PubMed] [Google Scholar]
- [27].Koester D, Schack T, and Westerholz J, “Neurophysiology of Grasping Actions: Evidence from ERPs,” Frontiers in psychology, vol. 7, p. 1996, 2016, doi: 10.3389/fpsyg.2016.01996. [DOI] [PMC free article] [PubMed] [Google Scholar]
- [28].Iturrate I et al. , “Human EEG reveals distinct neural correlates of power and precision grasping types,” Neuroimage, vol. 181, pp. 635–644, November 1 2018, doi: 10.1016/j.neuroimage.2018.07.055. [DOI] [PubMed] [Google Scholar]
- [29].Malcolm BR, Foxe JJ, Butler JS, Mowrey WB, Molholm S, and De Sanctis P, “Long-term test-retest reliability of event-related potential (ERP) recordings during treadmill walking using the mobile brain/body imaging (MoBI) approach,” Brain Res, May 19 2017, doi: 10.1016/j.brainres.2017.05.021. [DOI] [PMC free article] [PubMed] [Google Scholar]
- [30].Malcolm BR, Foxe JJ, Butler JS, and De Sanctis P, “The aging brain shows less flexible reallocation of cognitive resources during dual-task walking: A mobile brain/body imaging (MoBI) study,” Neuroimage, vol. 117, pp. 230–42, August 15 2015, doi: 10.1016/j.neuroimage.2015.05.028. [DOI] [PMC free article] [PubMed] [Google Scholar]
- [31].De Sanctis P, Butler JS, Malcolm BR, and Foxe JJ, “Recalibration of inhibitory control systems during walking-related dual-task interference: a mobile brain-body imaging (MOBI) study,” Neuroimage, vol. 94, pp. 55–64, July 1 2014, doi: 10.1016/j.neuroimage.2014.03.016. [DOI] [PMC free article] [PubMed] [Google Scholar]
- [32].De Sanctis P, Butler JS, Green JM, Snyder AC, and Foxe JJ, “Mobile brain/body imaging (MoBI): High-density electrical mapping of inhibitory processes during walking,” Conference proceedings : … Annual International Conference of the IEEE Engineering in Medicine and Biology Society. IEEE Engineering in Medicine and Biology Society. Annual Conference, vol. 2012, pp. 1542–5, 2012, doi: 10.1109/EMBC.2012.6346236. [DOI] [PubMed] [Google Scholar]
- [33].Gramann K et al. , “Cognition in action: imaging brain/body dynamics in mobile humans,” Rev Neurosci, vol. 22, no. 6, pp. 593–608, 2011, doi: 10.1515/RNS.2011.047. [DOI] [PubMed] [Google Scholar]
- [34].Jungnickel E and Gramann K, “Mobile Brain/Body Imaging (MoBI) of Physical Interaction with Dynamically Moving Objects,” Front Hum Neurosci, vol. 10, p. 306, 2016, doi: 10.3389/fnhum.2016.00306. [DOI] [PMC free article] [PubMed] [Google Scholar]
- [35].Makeig S, Gramann K, Jung TP, Sejnowski TJ, and Poizner H, “Linking brain, mind and behavior,” Int J Psychophysiol, vol. 73, no. 2, pp. 95–100, August 2009, doi: 10.1016/j.ijpsycho.2008.11.008. [DOI] [PMC free article] [PubMed] [Google Scholar]
- [36].Delorme A and Makeig S, “EEGLAB: an open source toolbox for analysis of single-trial EEG dynamics including independent component analysis,” J Neurosci Methods, vol. 134, no. 1, pp. 9–21, March 15 2004, doi: 10.1016/j.jneumeth.2003.10.009. [DOI] [PubMed] [Google Scholar]
- [37].Torres EB and Zipser D, “Simultaneous control of hand displacements and rotations in orientation-matching experiments,” J Appl Physiol (1985), vol. 96, no. 5, pp. 1978–87, May 2004, doi: 10.1152/japplphysiol.00872.2003. [DOI] [PubMed] [Google Scholar]
- [38].Rencher AC, Methods of Multivariate Analysis. John Wiley & Sons, 2003. [Google Scholar]
- [39].Bell AJ and Sejnowski TJ, “An information-maximization approach to blind separation and blind deconvolution,” Neural computation, vol. 7, no. 6, pp. 1129–59, November 1995. [Online]. Available: https://www.ncbi.nlm.nih.gov/pubmed/7584893. [DOI] [PubMed] [Google Scholar]
- [40].Pion-Tonachini L, Kreutz-Delgado K, and Makeig S, “ICLabel: An automated electroencephalographic independent component classifier, dataset, and website,” Neuroimage, vol. 198, pp. 181–197, September 2019, doi: 10.1016/j.neuroimage.2019.05.026. [DOI] [PMC free article] [PubMed] [Google Scholar]
- [41].Beurze SM, de Lange FP, Toni I, and Medendorp WP, “Integration of target and effector information in the human brain during reach planning,” Journal of neurophysiology, vol. 97, no. 1, pp. 188–99, January 2007, doi: 10.1152/jn.00456.2006. [DOI] [PubMed] [Google Scholar]
- [42].Katz S, Ford AB, Moskowitz RW, Jackson BA, and Jaffe MW, “Studies of Illness in the Aged. The Index of Adl: A Standardized Measure of Biological and Psychosocial Function,” JAMA, vol. 185, pp. 914–9, September 21 1963. [Online]. Available: https://www.ncbi.nlm.nih.gov/pubmed/14044222. [DOI] [PubMed] [Google Scholar]
- [43].Friston KJ, “Functional and effective connectivity: a review,” Brain Connect, vol. 1, no. 1, pp. 13–36, 2011, doi: 10.1089/brain.2011.0008. [DOI] [PubMed] [Google Scholar]
- [44].Friston KJ, “Functional and effective connectivity in neuroimaging: a synthesis,” Human brain mapping, vol. 2, no. 1–2, pp. 56–78, 1994. [Google Scholar]
- [45].Arieli A, Sterkin A, Grinvald A, and Aertsen A, “Dynamics of ongoing activity: explanation of the large variability in evoked cortical responses,” Science, vol. 273, no. 5283, pp. 1868–71, September 27 1996. [Online]. Available: https://www.ncbi.nlm.nih.gov/pubmed/8791593. [DOI] [PubMed] [Google Scholar]
- [46].Buchel C, Coull JT, and Friston KJ, “The predictive value of changes in effective connectivity for human learning,” Science, vol. 283, no. 5407, pp. 1538–41, March 05 1999. [Online]. Available: https://www.ncbi.nlm.nih.gov/pubmed/10066177. [DOI] [PubMed] [Google Scholar]
- [47].Keller CJ, Honey CJ, Megevand P, Entz L, Ulbert I, and Mehta AD, “Mapping human brain networks with cortico-cortical evoked potentials,” Philosophical transactions of the Royal Society of London. Series B, Biological sciences, vol. 369, no. 1653, October 05 2014, doi: 10.1098/rstb.2013.0528. [DOI] [PMC free article] [PubMed] [Google Scholar]
- [48].Korzeniewska A, Crainiceanu CM, Kus R, Franaszczuk PJ, and Crone NE, “Dynamics of event-related causality in brain electrical activity,” Hum Brain Mapp, vol. 29, no. 10, pp. 1170–92, October 2008, doi: 10.1002/hbm.20458. [DOI] [PMC free article] [PubMed] [Google Scholar]
- [49].Korzeniewska A, Franaszczuk PJ, Crainiceanu CM, Kus R, and Crone NE, “Dynamics of large-scale cortical interactions at high gamma frequencies during word production: event related causality (ERC) analysis of human electrocorticography (ECoG),” Neuroimage, vol. 56, no. 4, pp. 2218–37, June 15 2011, doi: 10.1016/j.neuroimage.2011.03.030. [DOI] [PMC free article] [PubMed] [Google Scholar]
- [50].Flinker A et al. , “Redefining the role of Broca’s area in speech,” Proc Natl Acad Sci U S A, vol. 112, no. 9, pp. 2871–5, March 03 2015, doi: 10.1073/pnas.1414491112. [DOI] [PMC free article] [PubMed] [Google Scholar]
- [51].Ewen JB, Lakshmanan BM, Hallett M, Mostofsky SH, Crone NE, and Korzeniewska A, “Dynamics of functional and effective connectivity within human cortical motor control networks,” Clin Neurophysiol, vol. 126, no. 5, pp. 987–96, May 2015, doi: 10.1016/j.clinph.2014.09.006. [DOI] [PMC free article] [PubMed] [Google Scholar]
- [52].Choi K and Torres EB, “Intentional signal in prefrontal cortex generalizes across different sensory modalities,” Journal of neurophysiology, vol. 112, no. 1, pp. 61–80, July 1 2014, doi: 10.1152/jn.00505.2013. [DOI] [PubMed] [Google Scholar]
- [53].Torres EB, Quian Quiroga R, Cui H, and Buneo CA, “Neural correlates of learning and trajectory planning in the posterior parietal cortex,” Frontiers in integrative neuroscience, vol. 7, p. 39, 2013, doi: 10.3389/fnint.2013.00039. [DOI] [PMC free article] [PubMed] [Google Scholar]