Summary
Tobacco smoking causes lung cancer1–3, driven by the 60+ carcinogens in cigarette smoke that directly damage and mutate DNA4,5. The profound effects of tobacco on the lung cancer genome have been well documented6–10, but we lack equivalent data for normal bronchial cells. We sequenced whole genomes of 632 colonies derived from single bronchial epithelial cells across 16 subjects. Tobacco smoking was the major influence on mutation burden, adding 1000-10,000+ mutations/cell, massively increasing both within-subject and between-subject variance, and generating several distinct signatures of substitutions and indels. A population of cells in subjects with smoking history had mutation burdens equivalent to that expected for never-smokers: these cells had less damage from tobacco-specific mutational processes, were four-fold more frequent in ex-smokers than current smokers, and had significantly longer telomeres than their more mutated counterparts. Driver mutations increased in frequency with age, affecting 4-14% of cells in middle-aged never-smokers. In current smokers, ≥25% of cells carried driver mutations and 0-6% cells had 2 or even 3 drivers. Thus, tobacco smoking increases mutation burden, cell-to-cell heterogeneity and driver mutations, but quitting promotes replenishment of bronchial epithelium from mitotically quiescent cells that have avoided tobacco mutagenesis.
Introduction
Lung cancer kills more people globally than any other cancer, with 80-90% of those deaths attributable to tobacco exposure1,2. Our model for how tobacco causes lung cancer emphasises direct mutagenesis from the 60+ carcinogens in cigarette smoke4,5, combined with indirect effects such as inflammation, immune suppression and infection. Recognised first in TP53 sequencing5 and more recently in genome-wide sequencing of lung cancers6–10, tobacco exposure leads to both an increase in somatic mutation burden and an altered spectrum of mutations. A lung cancer genome from a smoker typically has tens of thousands of somatic mutations6,7,9 – of these, a small handful, probably <20, drive the biology of the tumour11–13.
Epidemiological studies have quantified the relationships between lung cancer and duration of smoking, intensity of smoking, type of smoking and timing of smoking cessation1–3,14. Interpreting these observations from population cohorts in terms of the molecular basis for tobacco carcinogenesis is challenging. Under a model in which lung cancer requires n driver mutations, an exposure that, say, increases mutation rates k-fold should increase incidence by ~kn, across a range of growth patterns11. However, in a paradox first noted by Armitage in 197115, the dose-response relationship between number of cigarettes smoked per day and lung cancer risk is linear3,14, k1, or at most weakly quadratic16. The benefits from smoking cessation likewise do not fit straightforwardly into multistage models of cancer15. By stopping in middle age or earlier, smokers avoid most of the risk of tobacco-associated lung cancer, a benefit that begins to emerge almost immediately and accrues steadily with time2. Of two people who smoked the same lifetime number of cigarettes, why the one with longer duration of cessation should have lower risk of lung cancer is difficult to explain if tobacco induces carcinogenesis exclusively via increased mutation burden.
Sequencing single-cell–derived colonies
We recruited 16 patients to assess the landscape of somatic mutations in normal bronchial epithelium: 3 children, 4 never-smokers, 6 ex-smokers and 3 current smokers (Supplementary Table 1). For ethical reasons, samples could only be obtained from subjects undergoing a bronchoscopy for clinical indications. The never-smokers and current smokers had bronchoscopy to investigate changes eventually diagnosed as benign. Of the ex-smokers, 2 had had a previous cancer treated with curative intent, and 5 had a carcinoma in situ or invasive squamous cell carcinoma that was the indication for bronchoscopy. The children in the cohort had bronchoscopy for investigation or follow-up of congenital anomalies: all had normal bronchial epithelium.
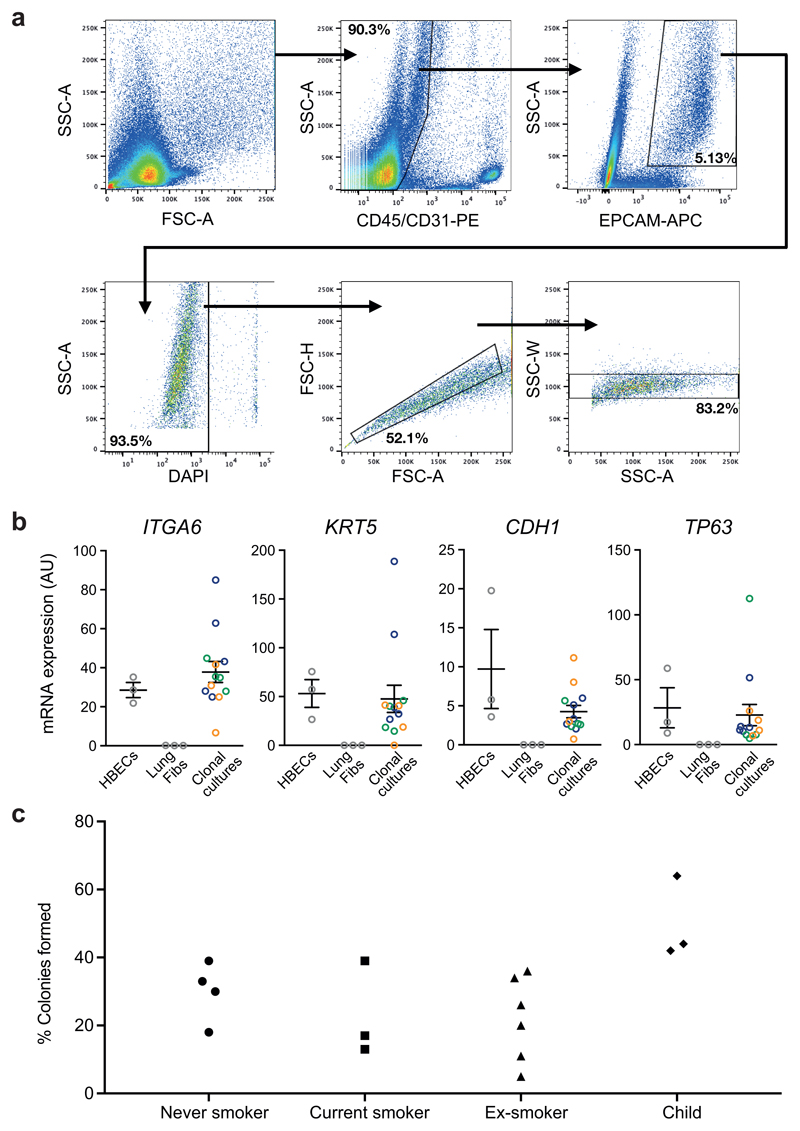
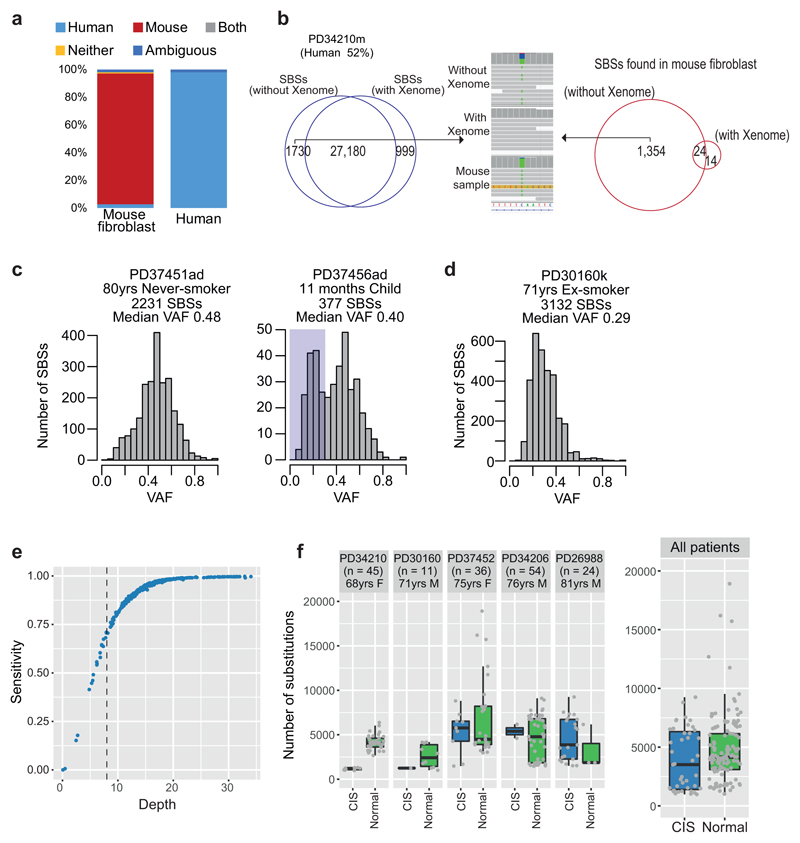
Samples of airway epithelium were obtained from biopsies or brushings of main or secondary bronchi. These were dissociated into single cells and EPCAM-positive epithelial cells flow-sorted, one to a well, onto mouse feeder cells allowing basal cell attachment and growth (Extended Figure 1A). Each cell was independently cultured to obtain single-cell–derived colonies that expressed the transcripts expected for basal cells of pseudostratified bronchial epithelium (Extended Figure 1B). Typically 15-40% of flow-sorted cells produced colonies (Extended Figure 1C), confirming that cells sequenced were drawn from a prevalent and representative population of epithelial cells. Colonies underwent whole genome sequencing to average coverage 16x (Supplementary Table 2), analysed using a xenograft pipeline to flag non-human sequencing reads (Extended Figure 2A-B). Somatically acquired mutations were identified from reads specific to the human genome. In nearly all colonies, the variant allele fraction of mutations averaged ~50%, consistent with contamination-free colonies derived from a single bronchial cell (Extended Figure 2C). To remove variants possibly acquired in vitro, we excluded mutations with variant allele fraction <30% that were present in only a single colony (Extended Figure 2C). Occasional colonies had a low mean variant allele fraction (Extended Figure 2D), consistent with seeding by two bronchial cells – these colonies were excluded from downstream analyses. We estimate that sequencing depth of 8x gave sensitivity for variants of 70-75%, rising to >95% at 15x (Extended Figure 2E). The majority of colonies had depth >15x, and we set a minimum cut-off of 8x for inclusion.
The final dataset comprises somatic mutation catalogues from whole genomes of 632 single bronchial cells. Five patients had squamous cell carcinomas or carcinoma in situ, three of which we also sequenced. Normal basal cells from these patients shared no clonal relationships with the carcinomas, and we found no systematic differences in mutation burden between normal cells in the vicinity of carcinoma in situ lesions and histologically normal regions (Extended Figure 2F).
Mutation burden
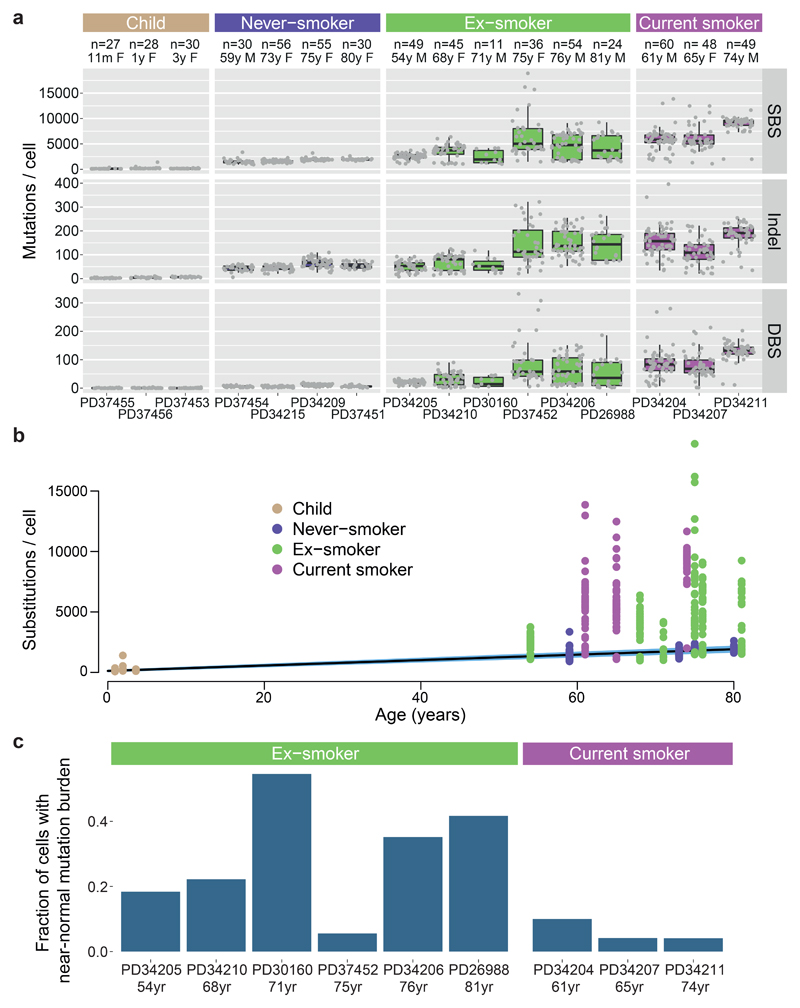
The burden of somatic substitutions per cell showed considerable heterogeneity both across the cohort and even within individual patients (Figure 1A). Using linear mixed effects (LME) models, we assessed factors influencing mutation burden (Supplementary Code). Single base substitutions increased significantly with age, at an estimated rate of 22/cell/year (CI95%=20-25; p=10-8; Figure 1B). Previous or current smoking significantly increased mean burden of substitutions (p=0.0002) by an estimated 2330/cell (CI95%=1180-3480) in ex-smokers and 5300/cell (CI95%=3660-6930) in current smokers.
Figure 1. Mutation burden in normal bronchial epithelium.
(A) Burden of single base substitutions (SBS), small insertion-deletions (indels) and double base substitutions (DBS) across patients in the cohort. Box-and-whisker plots show each subject, with the boxes indicating median and interquartile range, and the whiskers denoting the range. The overlaid points are the observed mutation burden of individual colonies.
(B) Relationship of burden of substitutions per cell with age, with points representing individual colonies (n = 632), coloured by smoking status. The black line represents the fitted effect of age on substitution burden, estimated from linear mixed effects models after correction for smoking status and within-patient correlation structure. The blue shaded area represents the 95% confidence interval for the fitted line.
(C) Fraction of cells with near-normal mutation burden in current and ex-smokers.
While the effects of age and smoking are expected, what was more surprising was that smoking massively increased the variability in mutation burden from cell to cell, even within the same individual. Among closely collocated cells from a given subject’s tiny biopsy of normal airway, the estimated standard deviation was 2350/cell in ex-smokers and 2100/cell for current smokers compared with 140/cell for children and 290/cell for adult never-smokers (p<10-16 for within-subject heterogeneity in variance across smoking categories; LME). There was also heterogeneity across individuals, with standard deviation in mean substitution burden estimated at 1200/cell for ex-smokers and 1260/cell for current smokers, compared to 90/cell for non-smokers (p=10-8 for between-subject heterogeneity of variance; LME).
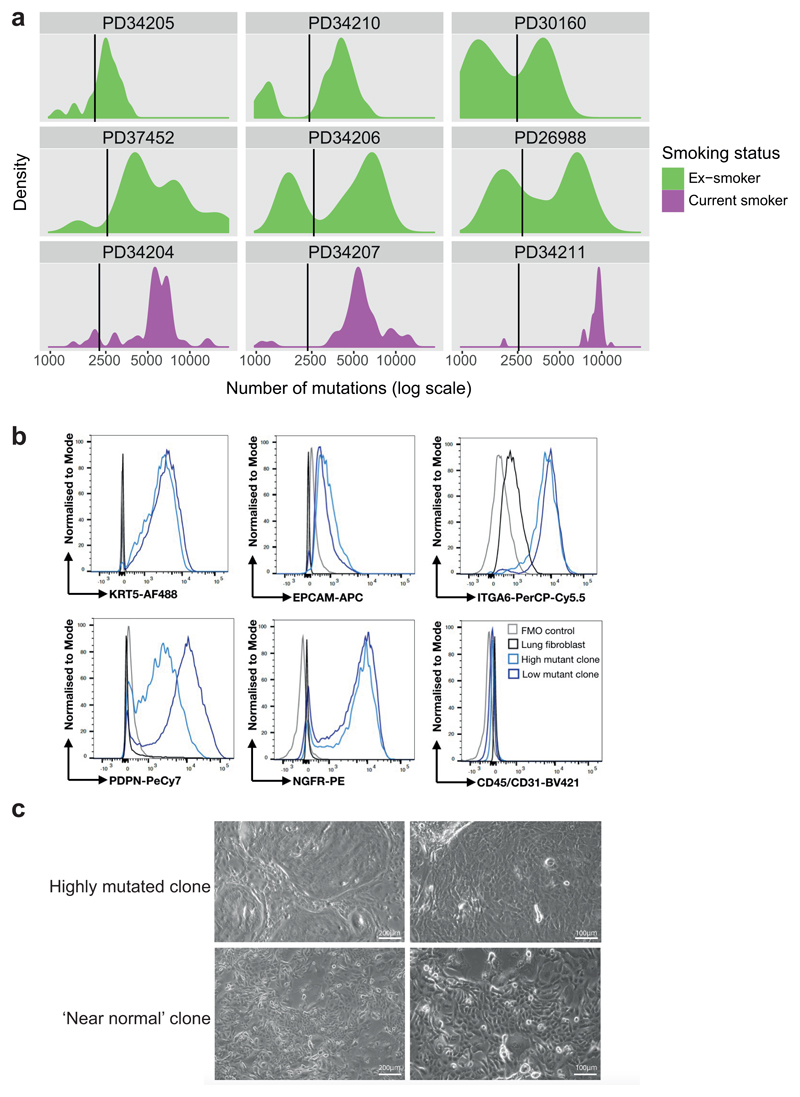
While most of the cells in ex- or current smokers had considerably elevated substitution burden, a fraction of cells in these patients had burdens within the range expected for never-smokers of an equivalent age (Figure 1C). For many of these patients, the distribution of mutation burden was distinctly bimodal, with one mode in the near-normal range and the other mode having substantially elevated mutation burden (Extended Figure 3A). Strikingly, although cells with near-normal mutation burden were rarely present in current smokers, their relative frequency was on average four-fold higher in ex-smokers (CI95%=2.0-7.9x; p=3x10⁻⁶; log-linear model), typically accounting for 20-40% of all cells studied. Colonies with near-normal mutation burden expressed the same set of airway basal cell genes as colonies with elevated mutation burden, and had the same tightly associated, cobbled architecture in culture (Extended Figure 3B-C), confirming they did indeed derive from bronchial epithelial cells.
Among current and ex-smokers, we found no significant correlation of mutation burden with duration of cigarette smoking or the number of cigarettes smoked per day, even if near-normal cells are excluded. However, the small numbers of subjects and large within-subject heterogeneity limits our statistical power for this analysis, and definitive analysis will require much larger sample size.
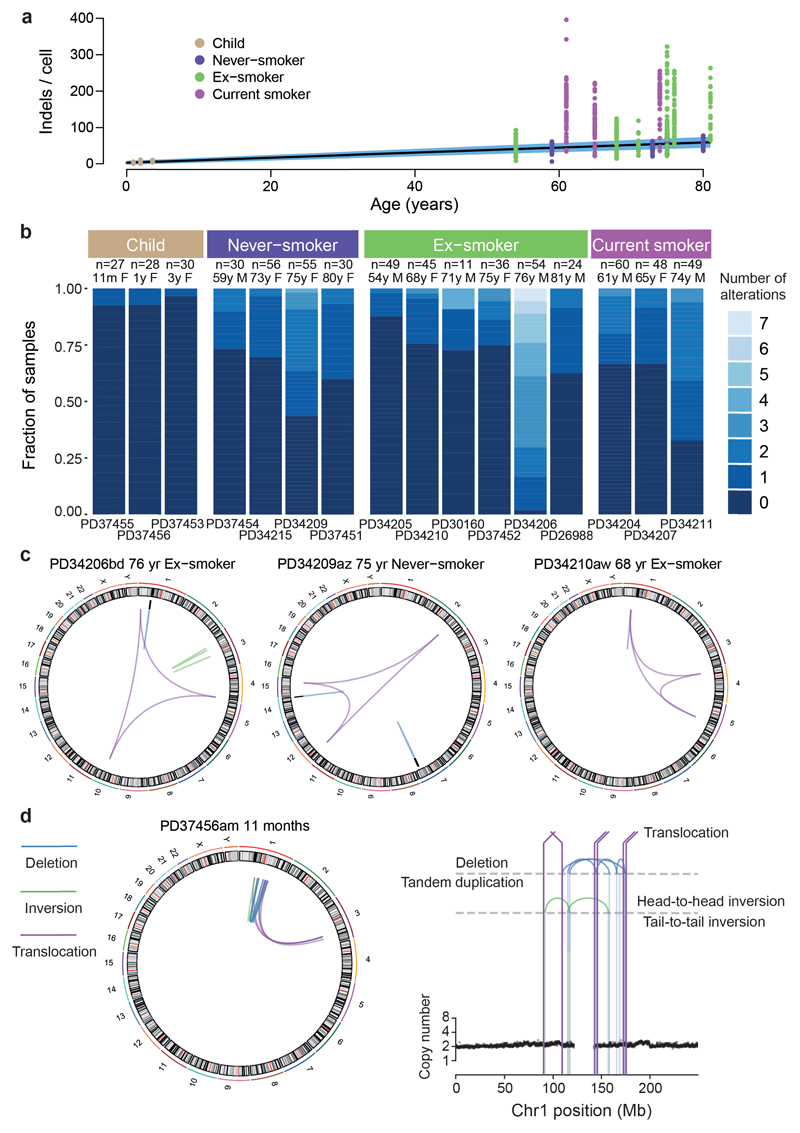
Indels showed similar associations as substitutions, increasing steadily with age (0.7 indels/cell/year; CI95%=0.6-0.8; p=10-6) and tobacco smoking (101 extra indels/cell in smokers; 51 in ex-smokers; p=0.001; Extended Figure 4A). Generally, the normal bronchial epithelial cells had few copy number changes or structural variants (Extended Figure 4B) – this represents a qualitative difference from lung cancers, which tend to have large numbers of structural abnormalities6,7,9,17. Interestingly, there were occasional examples of more complex structural events in the bronchial epithelial cells, including chromoplexy (Extended Figure 4C) and even chromothripsis in a cell from a child (Extended Figure 4D). The latter is particularly interesting, given recent data suggesting driver gene fusions in lung adenocarcinoma can arise through complex structural events early in life17.
Mutational signatures
A range of mutational processes operate in lung cancers, driven by both the exogenous carcinogens present in tobacco smoke and endogenous DNA damage – these processes leave characteristic signatures in the genome8. We built phylogenetic trees for each patient, and applied a Bayesian de novo mutational signature discovery algorithm to mutations assigned to each branch, together with samples from squamous cell lung cancers18 and in vitro cell culture controls19 to maintain comparability with previous analyses8 (Figure 2). Reassuringly, few mutations in our samples, typically <10-30/cell, were attributed to SBS-18, the signature that accounted for all variants in the cell culture controls19, confirming that mutations acquired in vitro are minimal in our dataset. Similar results emerged using a different mutational signature algorithm20 (Extended Figure 5A-C).
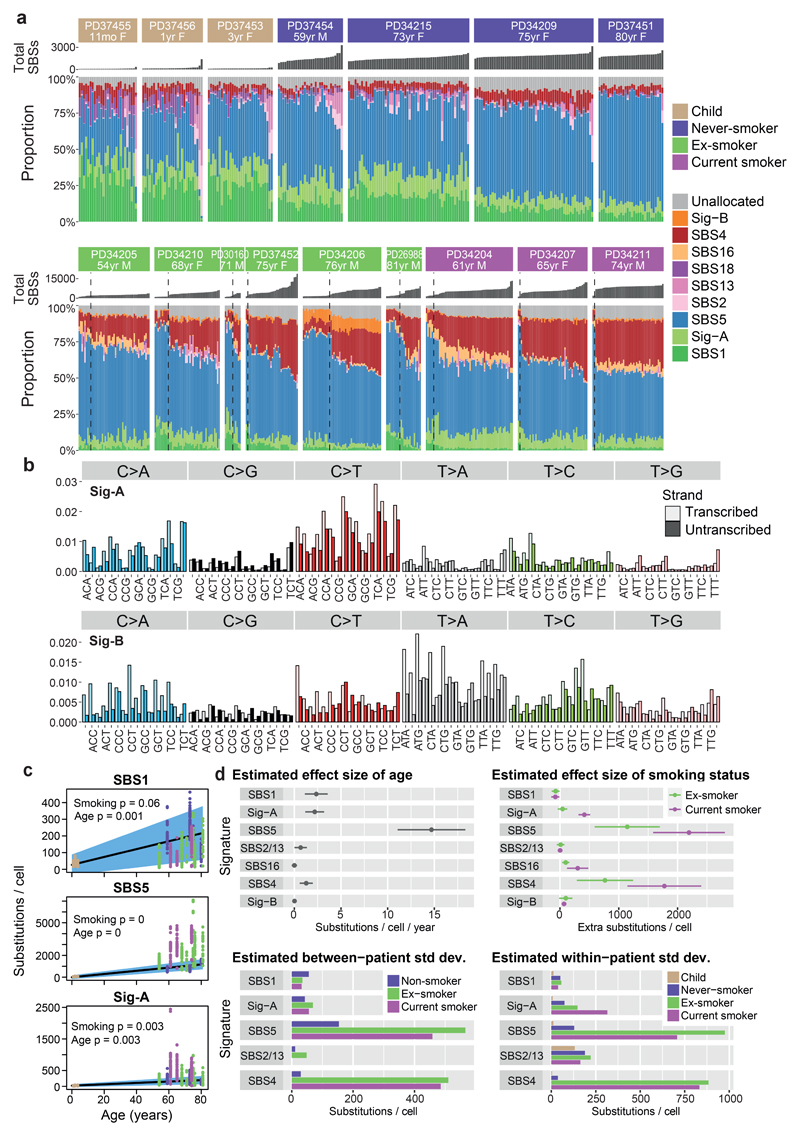
Figure 2. Mutation signatures in normal bronchial epithelium.
(A) Stacked bar-plot showing the proportional contribution of mutational signatures to single base substitutions across the n=632 colonies from normal bronchial cells, extracted using a hierarchical Dirichlet process. Within each patient, colonies are sorted from left to right by increasing mutation burden (bar chart in dark grey above coloured signature attribution stacks). Dashed black vertical lines in current and ex-smokers denote the cut-off between cells with near-normal and elevated mutation burden.
(B) Trinucleotide context spectrum on transcribed and untranscribed strands of two new single base substitution (SBS) signatures. The six substitution types are shown in the panel across the top. Within each panel, the trinucleotide context is shown as four sets of eight bars, grouped by whether an A, C, G or T respectively is 5’ to the mutated base, and within each group of eight by whether A, C, G or T is 3’ to the mutated base. Activity of the mutational signature on the untranscribed strand is shown in pale colour; on the transcribed strand in darker colour.
(C) Numbers of base substitutions attributed to the 3 endogenous signatures (y axis) across the cohort (n = 632 colonies) shown according to age of subject (x axis). Black line represents the fitted effect of age, estimated from linear mixed effects models after correction for smoking status and within-patient correlation structure. The blue shaded area represents the 95% confidence interval for the fitted line. The quoted p values for the fixed effects of age and smoking derive from the full linear mixed effects models.
(D) Estimated effect size of age, smoking status, between-patient and within-patient standard deviation of 7 signatures (points) with 95% confidence intervals (horizontal lines). Estimates are derived from linear mixed effects models (n = 632).
The endogenous mutational signature SBS-5 contributed a large proportion of mutations in all subjects, accumulating linearly with age (Figure 2C-D). As previously reported7,8, the absolute number of mutations attributed to this signature is higher in those with a smoking history (ex-smokers 1140/cell, CI95%=590-1700; current smokers 2200/cell, CI95%=1590-2810; p<10-16). Signature SBS-1, comprising C>T mutations at CpG dinucleotides, contributed larger proportions of mutations in the young children than the adults, but absolute numbers continued to increase linearly with age through adulthood (Figure 2C-D). Presumably, then, SBS-1 is enriched during early lung development and continues steadily throughout life, but other signatures become proportionally more active in adulthood. A novel signature (Sig-A; Figure 2B) was universally present across samples. It has some resemblance to SBS-5, and likewise increased linearly with age.
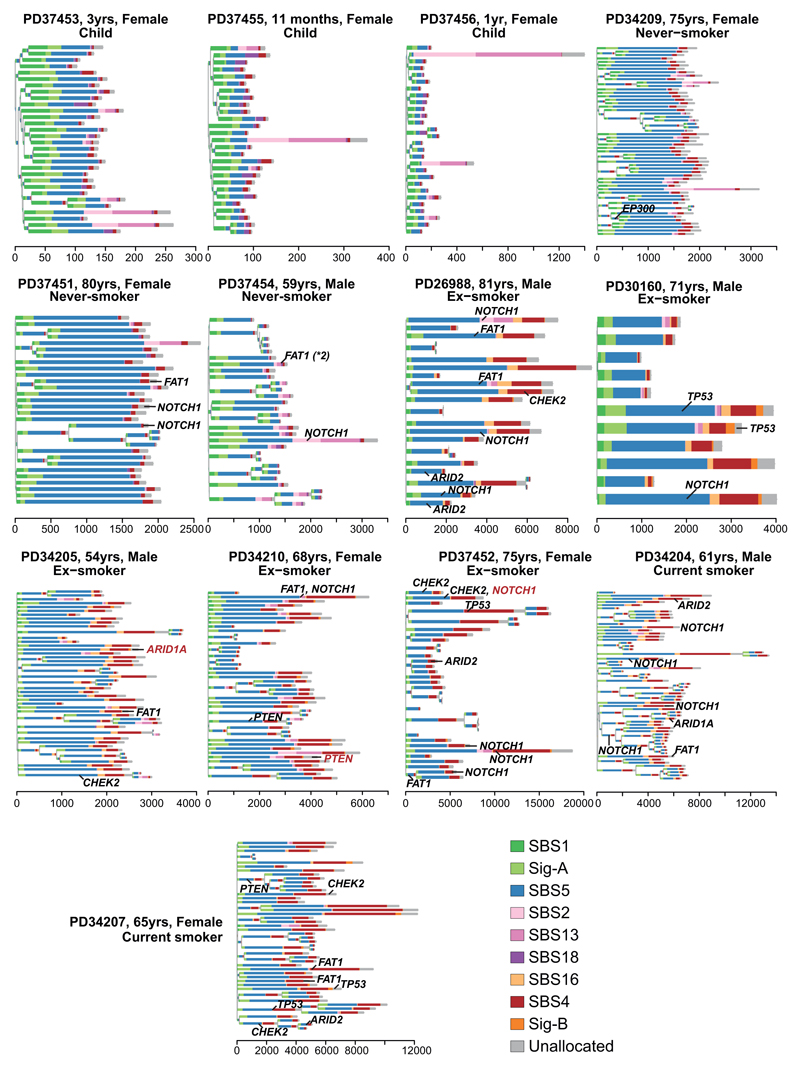
Signatures SBS-2 and SBS-13, caused by APOBEC3A/B mutagenesis, showed striking heterogeneity – mostly absent from bronchial cells, but occasionally contributing hundreds of mutations in an individual cell, even in children. This activity appears temporally restricted: individual branches of a phylogenetic tree had high proportions of SBS-2/13 despite their absence from antecedent and descendent branches (Figure 3A; Extended Figure 6). This implies that the episodic activity of APOBEC mutagenesis observed in cell lines21 extends to somatic cells in vivo – the proportion of mutations attributed to APOBECs on a given branch of the phylogenetic tree does not predict past or future mutagenesis rates in that lineage.
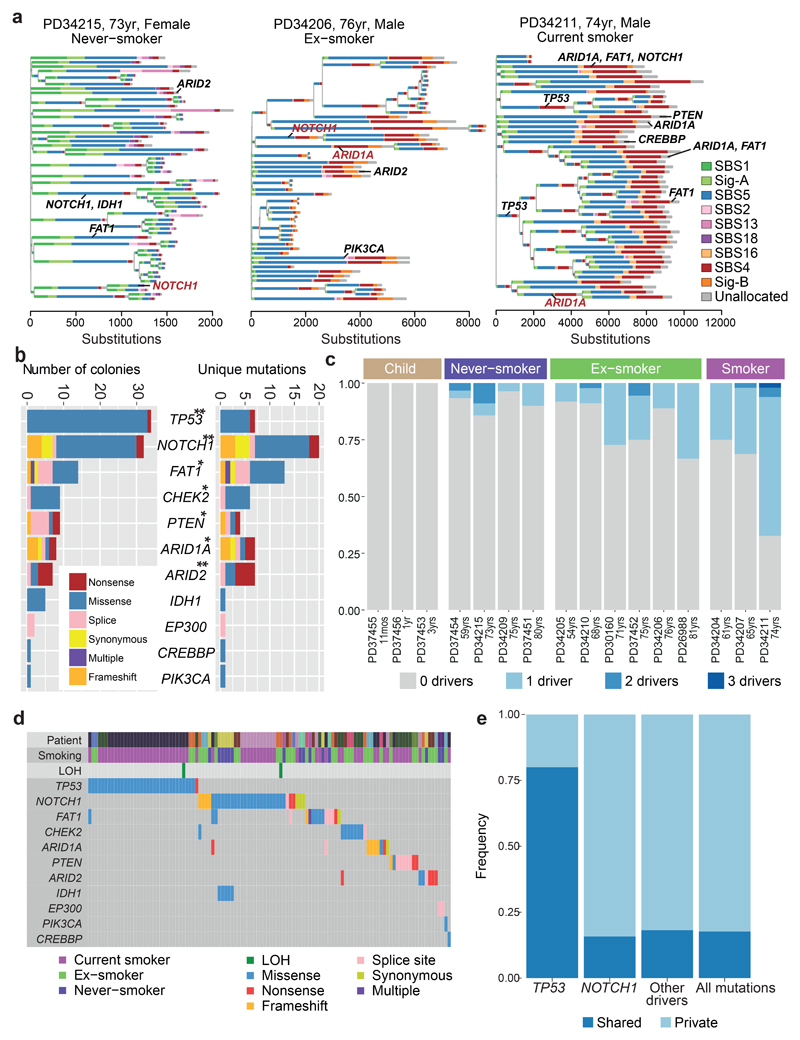
Figure 3. Driver mutations in normal bronchial epithelial cells.
(A) Phylogenetic trees showing clonal relationships among normal bronchial cells in 3 representative subjects. Branch lengths are proportional to the number of mutations (x axis) specific to that clone/subclone. Each branch is coloured by the proportion of mutations on that branch attributed to the various single base substitution signatures. Driver mutations identified in each branch (black: SBS, red: indel) are also shown.
(B) Total number of colonies with mutations (left panel) and number of unique mutations (right panel) in key cancer genes across the sample set (n = 632). ** represents genes significant (q<0.05 by dNdScv) when correction for multiple hypothesis testing is applied across all coding genes; * represents genes significant (q<0.05 by dSNdScv) when correction for multiple hypothesis testing is applied across known driver genes in lung cancers and normal squamous tissues (exact q values in Supplementary Table 4).
(C) Fraction of colonies with 0, 1, 2 or 3 driver mutations across the 16 subjects.
(D) Distribution of driver mutations across colonies in the cohort, coloured by type of mutation. Loss of heterozygosity (LOH) affecting driver mutations are also shown.
(D) The frequency of driver mutations shared by more than 1 colony in a patient (dark blue) versus found in a single colony (light blue) across different cancer genes.
Three substitution signatures were largely restricted to current or ex-smokers. Signature SBS-4 was expected since it is the predominant signature in lung cancers from smokers7,8 and is recapitulated by in vitro exposure to polycyclic aromatic hydrocarbons19. Second, SBS-16 comprised 5-15% mutations in several current or ex-smokers, but was absent from never-smokers. This signature, with its distinctive pattern of transcription-coupled damage and repair22 (Extended Figure 5D), correlates with alcohol and tobacco exposure in hepatocellular carcinomas8,23, but has not been linked with tobacco exposure in lung cancers previously.
A new mutational signature was extracted, comprising predominantly T>A and T>C mutations (Sig-B; Figure 2B), that was evident only in patients with a smoking history. The signature was mostly present at low rates, but in one ex-smoker it contributed up to 15% of mutations per cell. We find a strong transcriptional strand bias, with the transcribed strand showing decreased rates of mutation at the adenine in the T:A pairing. This is consistent with in vitro data that purines are more reactive with mutagens in tobacco smoke than pyrimidines5.
As described above, an unexpectedly high fraction of cells in ex-smokers had near-normal mutation burden. These cells had considerably lower proportions of SBS-4 mutations than cells in the same patients with elevated mutation burden. Instead, the distribution of signatures in these near-normal cells resembled that seen in never-smokers, with prominent endogenous signatures such as SBS-5, SBS-1 and Sig-A. Phylogenetically, cells with near-normal mutation burden showed polyclonal origins (Figure 3A, Extended Figure 6), suggesting they do not arise from expansion of a single ancestral cell.
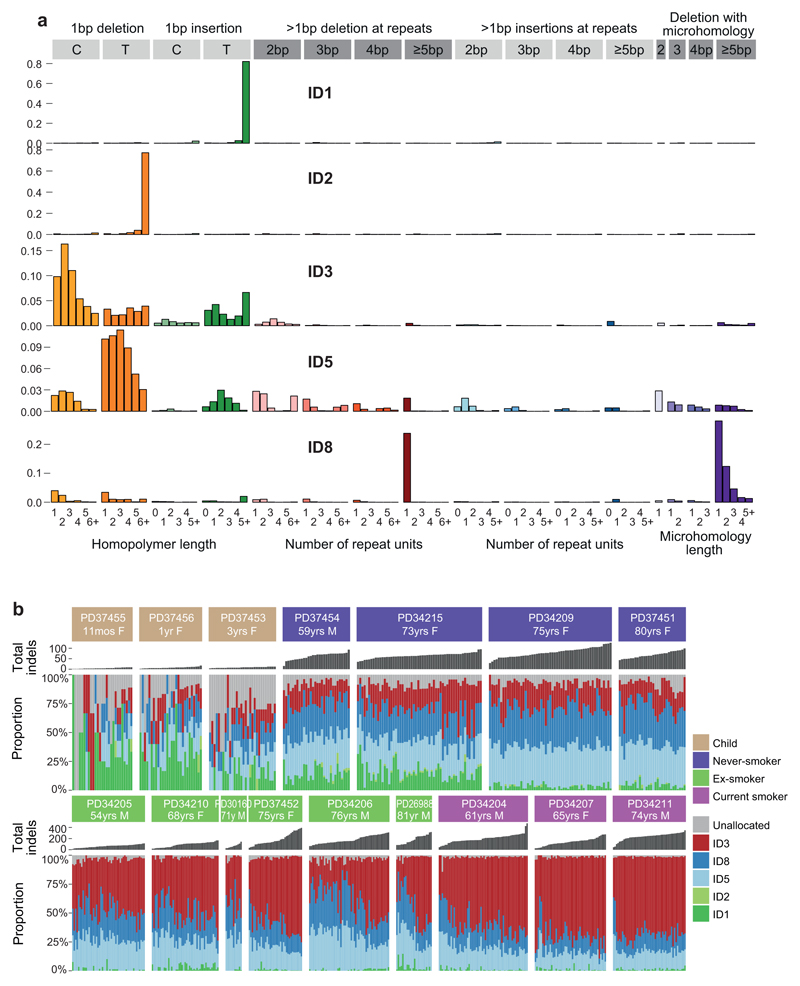
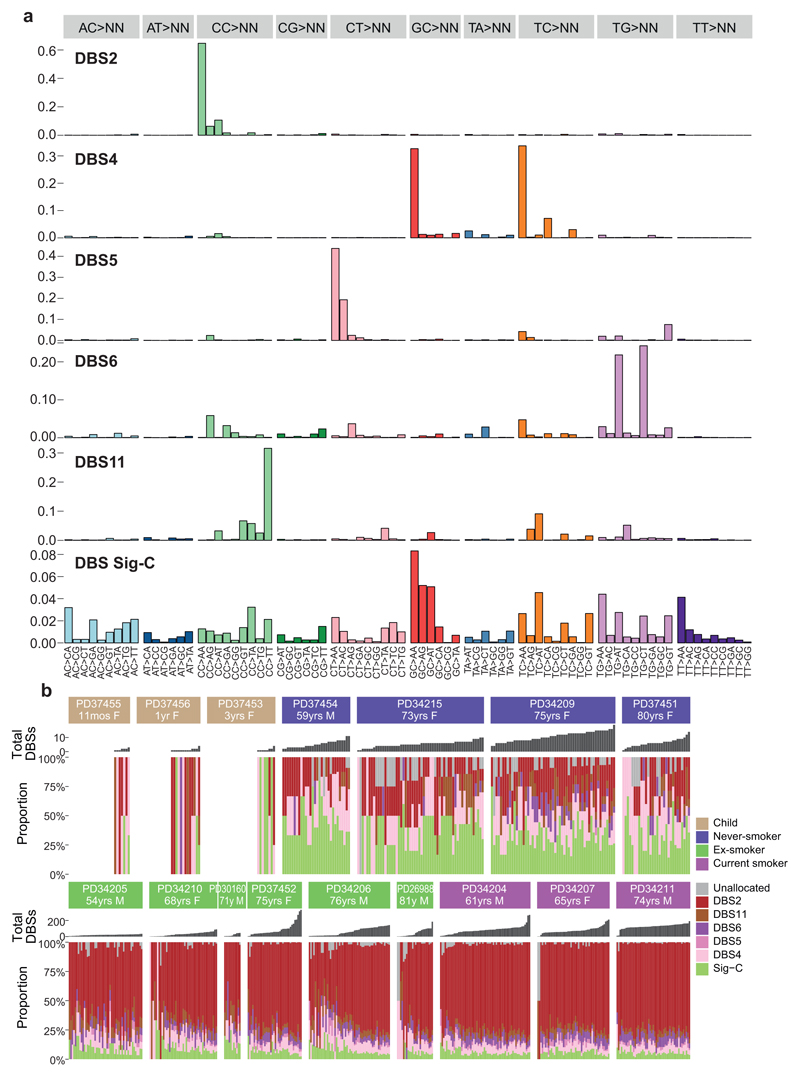
Signatures of indels and double-base substitutions observed in normal bronchial epithelium matched those extracted from lung cancers24 and generated in vitro by exposure of cells to polycyclic aromatic hydrocarbons19 (Extended Figures 7-8). A history of tobacco smoking was particularly associated with a signature of double-base substitutions at CpC/GpG dinucleotides – this accords with the high rates of C>A/G>T single-base substitutions in SBS-4. Likewise, tobacco exposure was associated with an indel signature of single-base deletions of cytosines/guanines in our dataset. Taken together, these data suggest that the predilection of polycyclic aromatic hydrocarbons in tobacco smoke to bind guanine nucleotides can result in a range of mutation types, even in normal bronchial epithelial cells, including single base substitutions, dinucleotide substitutions and small indels.
Driver mutations
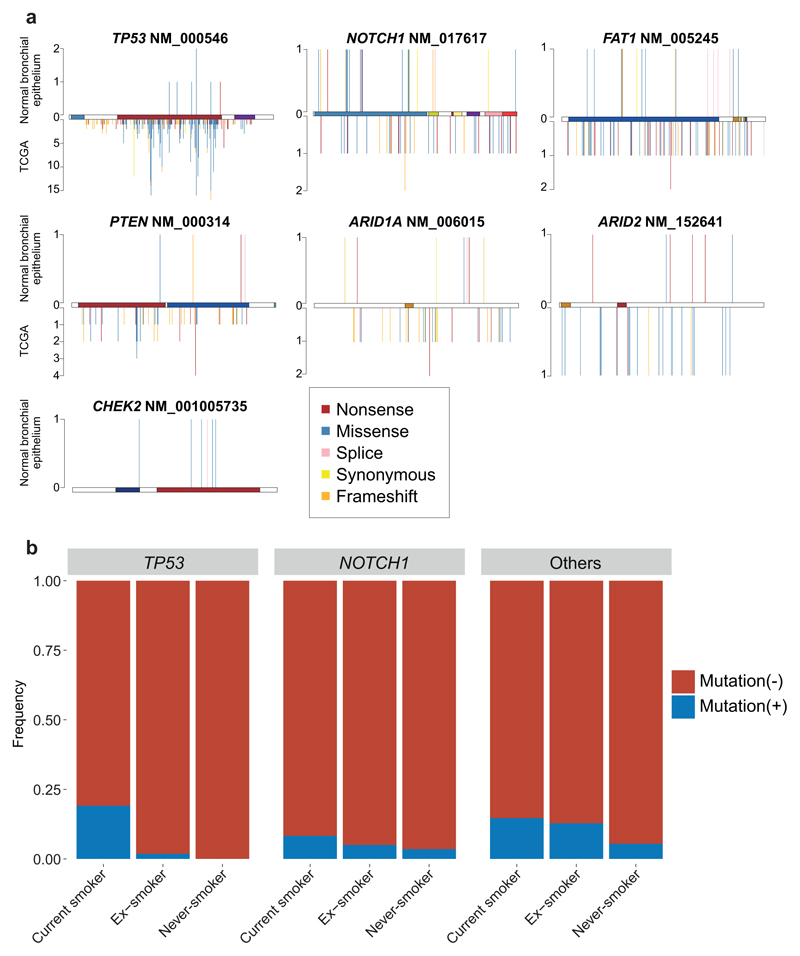
To assess whether any mutations are under positive selection in normal bronchial epithelium, we applied an algorithm, dNdScv, that identifies and quantifies excess non-synonymous mutations compared with that expected from synonymous (neutral) variants, correcting for local variation in mutation rates12. With hypothesis testing across all coding genes, three were significant: NOTCH1 (20 unique non-synonymous variants; q=1x10⁻⁵); TP53 (7; q=2x10⁻⁴); and ARID2 (7; q=4x10⁻⁴; Figure 3B). With hypothesis-testing restricted to genes mutated in lung cancers12,13,18,25,26 and normal squamous tissues27–29, FAT1, PTEN, CHEK2 and ARID1A were also significant, showing the expected patterns of protein-truncating mutations (Supplementary Tables 3-5; Extended Figure 9A). This closely resembles genes under positive selection in squamous cell lung cancers13,18 and other normal squamous tissues27–30.
Driver mutations were more frequent in patients with a tobacco-smoking history (Figure 3C, Extended Figure 9B). No candidate driver mutations were identified in cells from children; 4-14% cells in adult never-smokers had drivers, whereas in current smokers, ≥25% of cells carried at least one driver. Furthermore, a small fraction of cells in smokers had 2 or even 3 coding driver point mutations (Figure 3D), as many as seen in some lung cancers12. We used generalised linear mixed effects models to quantify these effects (Supplementary Code). Driver mutations were significantly more frequent in those with a smoking history, increased 2.1-fold in current smokers compared to never-smokers (CI95%=1.0-4.4; p=0.04). The number of driver mutations also independently increased with age, with every decade of life increasing the number of drivers per cell 1.5-fold (CI95%=1.2-2.1; p=0.004), reminiscent of the increasing number of driver mutations with age in oesophagus28,29. Finally, the number of driver mutations doubled on average for every 5,000 extra somatic mutations per cell, independent of the other variables (CI95%=1.4-2.7; p=0.0003).
Layering driver mutations onto phylogenetic trees revealed that driver mutations occurred throughout molecular time (Figure 3A; Extended Figure 6). TP53 mutations were much more likely to be shared by 2 or more cells sequenced (Figure 3E), though, suggesting that they either occur earlier in molecular time or drive larger clonal expansions.
Telomere lengths
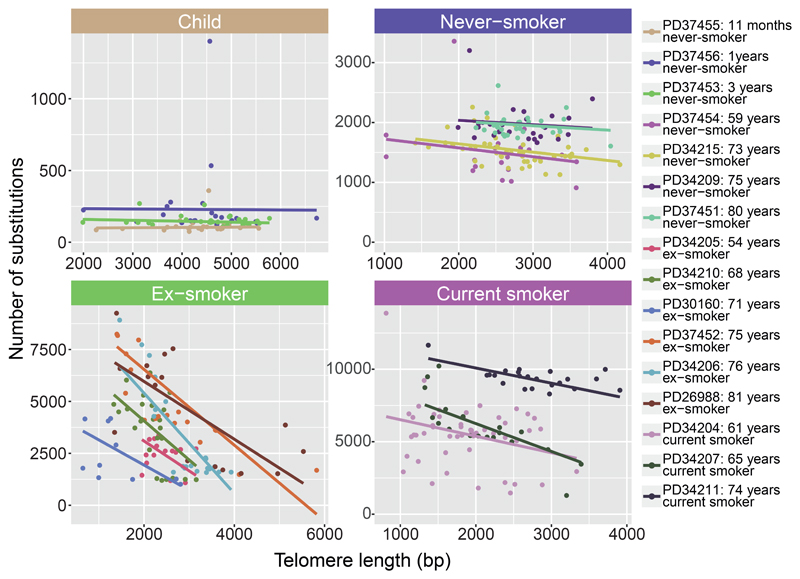
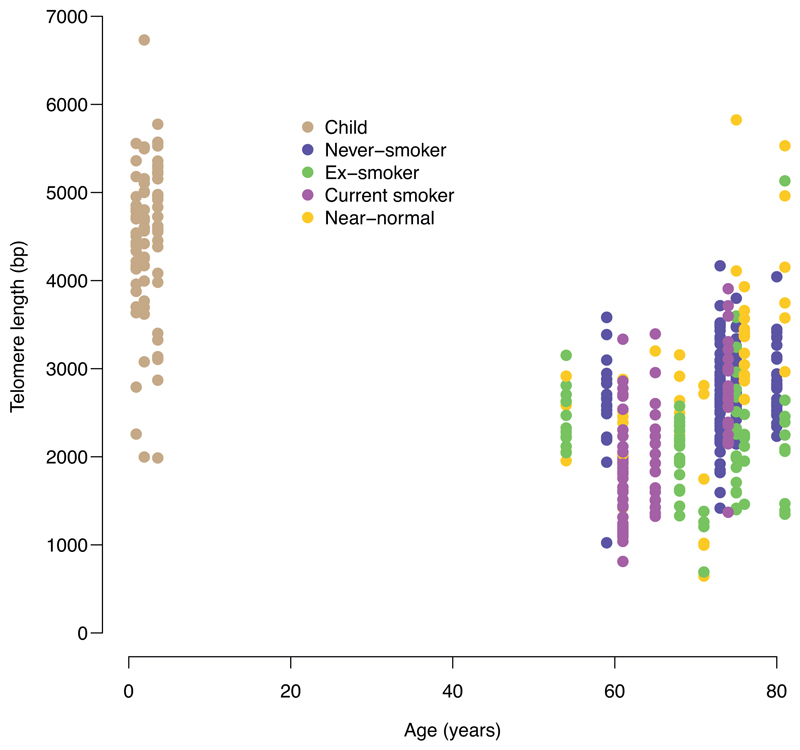
To assess historic mitotic activity, we estimated telomere lengths from the sequencing data (Figure 4). Bronchial cells from children had longer telomeres than those in adults (Extended Figure 10), as expected, and telomere lengths showed no correlation with mutation burden in children. Among never-smokers, there was also minimal correlation between mutation burden and telomere length. In current smokers, and especially in ex-smokers, however, there was a strong inverse relationship between telomere length and mutation burden, independent of the number of driver mutations (p=0.0009 for interaction between smoking status and telomere length; LME models; Supplementary Code). In particular, the cells with near-normal mutation burden in ex-smokers had considerably longer telomeres than their more mutated counterparts, suggesting they have historically undergone fewer cell divisions.
Figure 4. Relationship of telomere lengths with mutation burden.
Split by smoking status, panels show the relationship between telomere lengths (x axis) and mutation burden (y axis) for colonies with <10% contamination from the mouse feeder cells (n = 398 colonies). Individual cells are shown as points and fitted lines for each patient as coloured lines (slopes estimated using linear mixed effects models). The difference in slopes according to smoking status is highly significant (p=0.0009 for interaction term; LME models). One outlying cell in an ex-smoker with >10,000 mutations is excluded from the plot to improve visualisation.
Discussion
The simplicity of the notion that cigarette smoking causes lung cancer through its mutagenic effects belies the underlying complexity of how tobacco fashions clonal dynamics, mutation acquisition and the selective environment in the bronchus. Yes, exposure to tobacco smoke increases the number of somatic mutations, by an average of a few thousand mutations per normal bronchial cell, with the excess mutations attributable to signatures of carcinogens in cigarette smoke. Yes, this increased mutation burden generates more driver mutations. What is unexpected, though, is the massive within-patient variation in mutation burden among smokers – cells from the same tiny biopsy of bronchial epithelium can vary 10-fold in mutation burden, from 1,000/cell to over 10,000/cell.
Our cohort does potentially suffer from recruitment bias, since samples could only ethically be obtained from individuals undergoing a clinically indicated bronchoscopy. Nonetheless, such a recruitment bias could not explain the considerable within-patient variance in mutation burden, and we believe this finding will therefore apply to smokers more generally. Understanding how heterogeneity in mutation burden among competing cells contributes to clonal evolution will be important for refining our models of lung cancer development, which usually assume homogeneous effects of carcinogens across a population of cells. We recently described similar heterogeneity in tobacco mutagenesis among neighbouring clones within non-malignant liver31, suggesting that this phenomenon is not restricted to bronchial epithelium.
We find a qualitatively distinct population of bronchial epithelial cells with near-normal mutation burden in subjects with a smoking history. These cells have the same mutation burden as age-matched never-smokers; low proportions of signatures from tobacco carcinogens; longer telomeres than more mutated cells; and fourfold higher frequency in ex-smokers compared with current smokers. These cells are clearly cancer-protective – lung cancers that emerge in ex-smokers do not have near-normal mutation burden, typically showing high mutation burden associated with active tobacco signatures.
Two puzzles emerge – how have these cells avoided the mutational ravages suffered by their neighbours, and why do they expand after smoking cessation? Their longer telomeres imply that cells with near-normal burden have undergone fewer cell divisions, potentially representing recent descendants of quiescent stem cells. Although they remain elusive in human lung32, quiescent stem cells have been identified through lineage tracing in mouse models, and have been shown to occupy a protected niche in submucosal glands and expand after lung injury33–35. A physically protected niche could explain how such stem cells would avoid exposure to tobacco carcinogens, but so too could mitotic quiescence itself, since replication is required to convert adducted DNA bases to mutations.
It may be tempting to assume the expansion of cells with near-normal burden after smoking cessation arises through better fitness in the altered selection landscape – perhaps because they have longer telomeres, or fewer mutations, or aberrant NOTCH/TP53 signalling confers less advantage in the absence of tobacco smoke. These explanations notwithstanding, the near-normal cells’ apparent expansion could represent the expected physiology of a two-compartment model in which relatively short-lived proliferative progenitors are slowly replenished from a quiescent stem cell pool, but the progenitors are more exposed to tobacco carcinogens. Only in ex-smokers would the difference in mutagenic environment be sufficient to distinguish newly produced progenitors from long-term occupants of the bronchial coalface.
Epidemiological studies show the health benefits of stopping smoking begin immediately, accrue with time since cessation and are evident even after quitting late in life2. That these benefits could be facilitated by replenishment of bronchial epithelium with cells essentially impervious to decades of sustained cigarette smoking attests to the lung’s remarkable resilience and regenerative capacity. The public health message has an appealing quality of absolution – stopping smoking, at any age, does not just slow the accumulation of further damage, but can reawaken cells unscathed by past lifestyle choices.
Methods
Subjects
Subjects were recruited at University College London Hospitals (UCLH) or Great Ormond Street Hospital (GOSH) and gave written informed consent with approval of the Research Ethics Committee (REC reference 06/Q0505/12 and 11/LO/152, respectively). Details of the patients studied are listed in Supplementary Table 1. All patients underwent bronchoscopy as part of their clinical care. In adults, the bronchoscopy procedure was performed for diagnostic or surveillance indications; in children, it was undertaken for investigational procedures on congenital tracheal abnormalities. For five patients with squamous cell carcinomas or carcinoma in situ, biopsy of normal bronchial tissue was taken from a site distant from the tumour.
Single-cell-derived colonies
Endobronchial biopsies were dissociated using 16 U/ml dispase in RPMI for 20 minutes at room temperature. The epithelium was dissected away from the underlying stroma and foetal bovine serum (FBS) was added to a final concentration of 10%. Both the epithelium and stroma were combined and digested in 0.1% trypsin/EDTA at 37°C for 30 minutes. The solution was neutralised with FBS to a final concentration of 10% and added to the neutralised dispase solution36. Cells were passed through a 100 μm cell strainer and stained in sorting buffer (1x PBS, 1% FBS, 25 mM HEPES and 1 mM EDTA) with anti-CD45-PE (BD Pharminogen 555483, 1:200), anti-CD31-PE (BD Pharminogen 555446, 1:200), anti-EPCAM-APC (Biolegend 324208, 1:50) antibodies and DAPI (1 μg/ml). For endobronchial brushings, no dissociation was carried out, the cell suspension was passed through a 100 μm cell strainer prior to staining.
Cells were single cell sorted based on expression of CD45, CD31 and EPCAM, using a BD FACSAria Fusion. Each DAPI-CD45-CD31-EPCAM+ cell was sorted into 1 well of a 96-well plate, pre-coated with collagen I and mitotically inactivated 3T3-J2 feeder cells. Feeder cells were authenticated by whole genome sequencing, and were screened for Mycoplasma contamination by PCR. Cells were grown in fresh epithelial growth medium37 (DMEM: F12 at a 3:1 ratio with penicillin-streptomycin, 5% FBS, 5 μM Y-27632, 5 μg/ml insulin, 25 ng/ml hydrocortisone, 0.125 ng/ml epidermal growth factor, 0.1 nM cholera toxin, 250 ng/ml amphotericin B and 10 μg/ml gentamicin), which was supplemented for the first week of culture with epithelial growth medium that had been conditioned on growing epithelial cells and a final concentration of 10 μM Y-27632. Epithelial cells were grown in 96-well plates for 2 weeks before being passaged into 24-well plates and then into T25s. Epithelial cells were in culture for a total of about 25 days at 37°C and 5% CO2 with 3 changes of medium per week. When cells reached 70-80% confluence in T25s, they were differentially trypsinised, making use of the greater sensitivity of feeder cells to trypsin compared with epithelial cells, generating a mostly pure population of epithelial cells. DNA was then extracted using the PureLink Genomic DNA Mini Kit (Invitrogen).
Whole-genome sequencing
Paired-end sequencing reads (150bp) were generated using the Illumina Hiseq X-Ten platform for 662 samples of 16 patients. Target coverage was 15x per sample, except for 30x for 26 pilot samples derived from the first patient (PD26988). For 10 patients, blood DNA samples were also sequenced as germline controls. For 3 patients, bulk squamous cell carcinoma or carcinoma in situ (CIS) samples, which were collected at the same or nearby timepoints (~4 months after), were sequenced, including 2 CIS samples used in a previous study38 (PD38326a and PD38327a, which are CIS derived from PD30160 and PD34210, respectively). We also sequenced the whole genome of the pure mouse feeder cell layer.
Discrimination of human and mouse sequences
Bronchial epithelium samples were cultured on J2 mouse embryonic feeder fibroblast cells, which caused various degrees of contamination of mouse DNA in the samples from bronchial cell colonies. To remove mouse-derived sequencing reads, we used the Xenome algorithm39 with default setting (k-mer size = 25). The Xenome algorithm classifies fastq files into five categories: graft (human), host (mouse), ambiguous, both and neither. We confirmed that most of sequencing reads of a pure human DNA sample were classified as human (98%) and those of the mouse feeder cell-derived DNA sample were rarely (2.8%) classified as human (Extended Figure 2A). In addition, we mapped sequencing reads of mouse feeder fibroblast DNA sample to the human genome reference, and confirmed that most of mouse-derived mutations have been successfully removed using Xenome for selected samples with mouse contamination (Extended Figure 2B). Although all samples were negative for Mycoplasma using standard laboratory PCR testing, Xenome identified sequencing reads derived from the Mycoplasma genome in a subset of samples, assigning them to the “neither” classification.
With testing complete, we ran Xenome for all bronchial epithelium samples, and aligned only reads classified as human to the human reference genome (NCBI build 37d5) using BWA-MEM. Metrics of sequencing coverage and proportion of human-derived reads are listed in Supplementary Table 2, and 20 samples with less than 8X average sequencing depth were excluded from further analysis due to lower estimated sensitivity, as described later (Extended Figure 2E).
Clonality of samples
To ensure that each sample was single–cell-derived, we visually inspected the distribution of variant allele fractions (VAFs) of mutations: 632 clones had VAFs distributed around 50%, confirming that they were derived from a single cell, but 10 clones had lower allele fractions, suggesting that these colonies were oligoclonal (Extended Figure 2D). These samples were removed from further analyses (Supplementary Table 2).
Single base substitution calling
Single base substitution (SBSs) were called using the Cancer Variants through Expectation Maximisation (CaVEMan) algorithm40 with copy number options of major copy number 5, minor copy number 2 and normal contamination 0.1. In order to allow the discovery of early embryonic mutations, we ran CaVEMan using an unmatched normal control. In addition to the default “PASS” filter, we removed variants with <120 median alignment score (ASMD) and those with >0 for the clipping index (CLPM) to remove mapping artefacts. Also, variants identified in the mouse feeder fibroblast DNA sample were removed, if they persisted in the call-set. Subsequently, for every mutation identified in any colonies from each patient, we counted the number of mutant and wild-type reads in all bronchial samples from the same patient using bam2R function of R package deepSNV41, where bases with ≥30 base quality and sequencing reads with ≥30 mapping quality were used. Further filters described below were applied to identify true somatic mutations and separate them from either germline variants or recurrent sequencing errors.
To remove germline variants (binomial filter)
We fitted a binomial distribution to the total variant counts and total depth at each SBS site across all samples from one patient. To differentiate somatic variants from germline variants, we used a one-sided exact binomial test, with the null hypothesis that these variants were drawn from a binomial distribution with a success probability of 0.5 (0.95 for sex chromosomes in males). The alternative hypothesis was that these variants were drawn from distributions with lower success probabilities. Variants with p-value >10-10 were considered as germline variants.
To remove errors (beta-binomial filter)
We fitted a beta-binomial distribution to the variant counts and depths of all SBSs across samples from the same patient for the remaining somatic variants. The beta-binomial was used as it captures the difference between artefactual variant sites and true somatic variants. Many artefacts appear to be randomly distributed across samples and can be modelled as drawn from a binomial distribution. True somatic variants will be present at high VAF in some samples, but absent in others, and are hence best captured by a highly over-dispersed beta-binomial. For each variant site, the maximum likelihood of the over-dispersion factor (ρ) was calculated using a grid-based method (ranging from a value of 10-6 to 10-0.05). Variants ρ>0.1 were filtered out and considered to be artefactual. The code for this filter is based on the Shearwater variant caller41.
To remove mutations induced in vitro
We observed peaks of lower VAFs in a subset of samples (Extended Figure 2C), suggesting the existence of mutations arising during the in vitro expansion of the single cell. These peaks were more prominent in samples from children, suggesting that the number of this kind of mutation is relatively small – they would, however, be more prominent in samples with low true mutation burden, such as in children. We discarded mutations with median VAF ≤0.3 for autosomal regions and ≤0.6 for sex chromosomes across all samples from the same patient – these cut-offs were determined based on the observed distribution of VAFs here and a previous report20.
We quantified sensitivity by measuring how well our algorithms called heterozygous germline polymorphisms in the colonies depending upon sequencing depth – since our colonies are single cell-derived, we would expect heterozygous germline SNPs to have the same variant allele fraction distribution as true somatic mutations in that original single cell. We find that a sequencing depth of 8x leads to an estimated sensitivity of 70-75%, rising to >95% at a sequencing depth of 15x. The majority of colonies we sequenced had depths of >15x, and we set a minimum cut-off of 8x depth for inclusion of a colony within the study (Extended Figure 2E). Finally, we visually inspected allelic counts of removed germline variants with ≥2 samples without any mutant reads, and rescued embryonic mutations. Somatic variants were annotated using ANNOVAR42.
Indel calling
Indels were called using cgpPindel43, and an unmatched normal sample was used as the germline control. Indels detected in mouse fibroblast feeder cells were removed as mouse-derived artefacts. For all indels, indel-positive or negative sequencing reads were counted using cgpVAF across all samples of each patient.
To remove germline variants and recurrent sequencing errors, the same binomial and beta-binomial filters were used as described above for single base substitutions. We discarded mutations with median VAF ≤0.25 for autosomal regions and ≤0.5 for sex chromosomes across all samples from the same patient to remove mutations induced in vitro.
Double-base substitution calling
We first identified candidate double-base substitutions (DBSs) based on side-by-side SBSs called using CaVEMan for each patient, and ran cgpVAF across all samples of each patients to remove those called in independent reads. DBSs with ≥3 mutant reads in at least one sample were considered as true positives. Germline variants, errors and mutations induced in vitro were filtered as for single base substitutions and indels.
Structural variant calling
Structural variants (SVs) were called using the BRASS algorithm44, and matched normal samples, including blood samples and normal bronchial samples assigned on distantly located branches in phylogenetic trees, were used as controls. To remove germline SVs, we filtered SVs detected in the descendant colonies of both of the earliest two branches at the top of phylogenetic tree for each patient. If the earliest branch had ≥3 branches (polytomy), those detected in both descendent and non-descendent samples of the earliest branch with highest number, were removed. We further filtered SVs not identified using unmatched normal control, to remove SVs not filtered due to lower sequencing coverage of matched normal control sample. In addition, SVs detected in other patients were also removed as germline variants or errors. Finally, remaining all SV calls were manually inspected using IGV to confirm somatic variants.
Copy number calling
Copy number changes were called using the ASCAT algorithm45,46, and the same matched normal control samples as those used in SV analysis were used as germline controls. Copy number gains, losses and copy neutral LOHs were visually confirmed LogR and BAF plots by ascatNgs. For amplification, those with >100kb were visually confirmed using ascatNgs and JBrowse47.
Mutational burden and estimation of effect of age, smoking
For SBS, indels, DBSs, samples with ≥3 mutant reads and ≥0.2 VAF were considered to be mutated, and the number of each class of genetic lesions were counted for all bronchial cells. For SV, chromoplexy48 (Extended Figure 4C), chromothripsis49 (Extended Figure 4D) and translocation pairs with similar breakpoints were considered as single SVs. Genetic lesions identified both as SV and copy number changes were also considered as single events.
Subsequently, a linear mixed-effect model was fitted to estimate the effect of age and smoking status on the number of SBSs or indels using ‘nlme’ R package (Supplementary Code). In addition to the fixed effects of age and smoking, patient was used as a grouping variable in the random effect, in which smoking status was used as a modifier of between-patient difference. Difference of within-group heterogeneity (heteroscedasticity) according to smoking status was also fitted in this model. The intercept of this model was likely to be derived from embryonic mutations and mutations introduced in vitro. Models were fitted using maximum likelihood estimation, and nested models compared using likelihood ratio tests.
Identification of near-normal lung cells
We define cells as having a near-normal mutation burden if they have a mutation burden that is less than 2 non-smoker within-patient standard deviations (SDs) plus 2 non-smoker between-patient SDs above the estimated number of mutations accumulated at the age of that patient using LME model (Supplementary Code). The fraction of cells with near-normal mutation burden was compared between current smokers and ex-smokers with log-linear regression using the logarithm of the total number of cells sequenced per patient as an offset.
Phylogenetic tree construction
Phylogenetic trees were built using maximum parsimony using substitutions for each patient. First, the input matrix of mutations was made, in which samples with ≥0.2 VAF and ≥3 mutant reads were considered as mutated samples and labelled as “1”, and remaining samples were labelled as “0”. Among samples labelled as “0”, samples (i) with ≤6X sequencing depth for each mutated base and (ii) ≥1 mutant reads were considered as undetermined and labelled “?”. For every individual, phylogenetic trees were constructed using the Camin-Sokal method of the Mix program of RPhylip package, and subsequently consensus trees of all the trees were constructed using the Consensus program of RPhylip.
Subsequently, all mutations were reassigned to branches in the phylogenetic trees. If mutations were called in all the descendants of a given branch and in no samples that were not descendants of the branch, mutations were perfectly assigned to those branches. Given the existence of samples with relatively lower sequencing depth for each mutated position, we also assigned mutations to branches if mutations were called in all but one undetermined descendant labelled as “?” of a given branch, and all samples that were not descendants of the branch were wild-type (“0”). Given the smaller number of indels and DBSs, these were assigned to each branch using the tree defined from SBSs, rather than generating new trees for the other mutation types.
Extraction of mutational signatures
Extraction of SBS signatures
To analyse mutational signatures for SBS, SBSs assigned to each branch of the phylogenetic trees were categorised into 288 subtypes, consisting of 6 mutation classes by 16 5’ and 3’ base contexts on transcribed strand, non-transcribed strand or intergenic region. Mutational signatures were extracted using the HDP package50 relying on the hierarchical Bayesian Dirichlet process (https://github.com/nicolaroberts/hdp). Due to the lack of reference signatures categorized into 288 subtypes, we conducted a de novo signature extraction. We included somatic mutations from squamous cell lung carcinomas sequenced by TCGA and from in vitro single cell culture controls as separate samples to maintain comparability with signatures already established in previous studies. For identified SBS signatures, signatures with ≥0.90 cosine similarity with reported signatures in terms of distribution to 96 or 192 subtypes24, were considered as same signatures, including SBS1, SBS4, SBS5, SBS16 and SBS18. For the remaining new signatures, the expectation-maximisation algorithm was used to deconvolute these signatures into above five signatures and other known signatures in lung cancers (SBS2, SBS8 and SBS13), because it is difficult to separate signatures that are strongly correlated across samples. If a signature reconstituted from the components that expectation-maximisation extracted (only including signatures that accounted for at least 10% of mutations in each sample to avoid over-fitting) had a ≥0.90 cosine similarity to the original HDP signature, the signature was presented as its expectation-maximisation deconvolution. Two HDP signatures met these criteria: one new signature was deconvoluted into a mixture of SBS4 and SBS5; another new signature was deconvoluted in SBS2 and SBS13. After these analyses, 7 known and 2 new SBS signatures were identified.
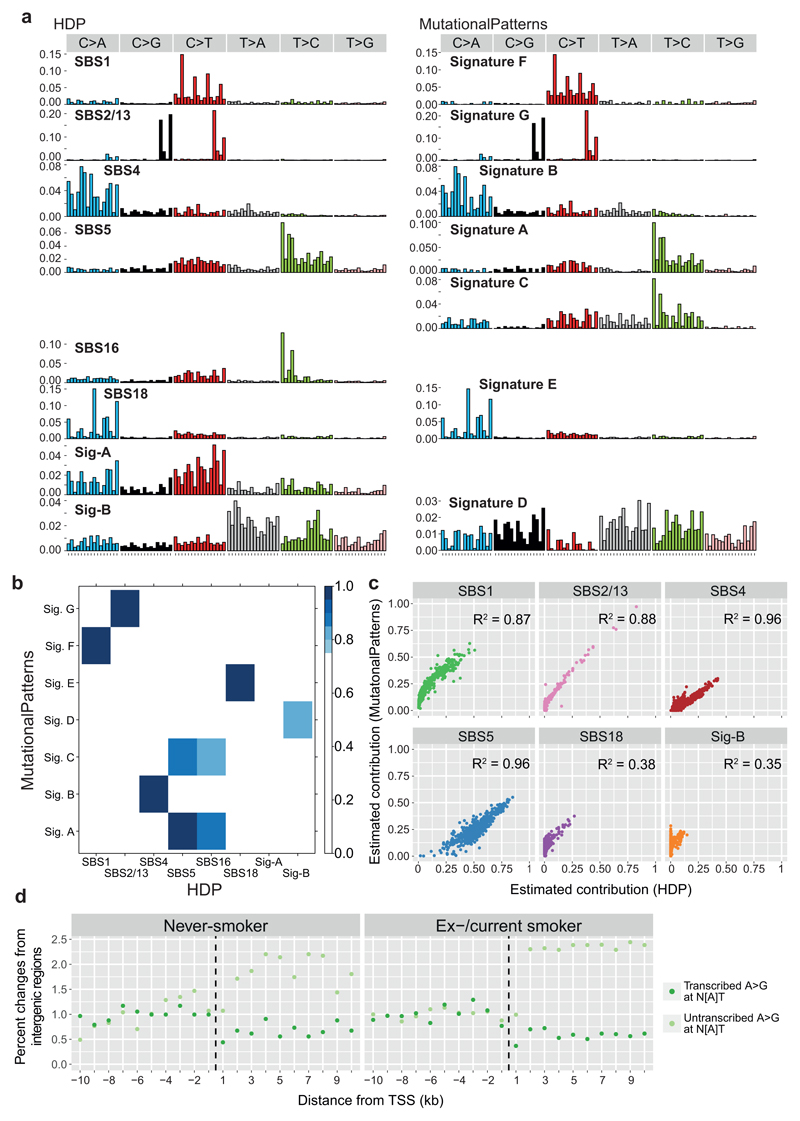
To validate these signatures identified using HDP, we also analysed SBS signatures using the ‘MutationalPatterns’ package20, which relies on Non-negative Matrix Factorisation (NMF). Optimal factorisation rank (rank = 7) was determined based on the slope of cophenetic correlation coefficient. MutationalPatterns identified similar signatures with SBS5 (Signature A), SBS4 (Signature B), Sig-B (Signature D), SBS18 (Signature E), SBS1 (Signature F), SBS2, SBS13 (Signature G), (Extended Figure 5A-B).
Extraction of indel and DBS signatures
For indels and DBS, each type of genetic alteration assigned to each branch of the phylogenetic trees was categorised into 83 and 78 subtypes as previously reported24. First, the algorithm was conditioned on the set of mutational signatures that have been detected in lung cancers (ID1, ID2, ID3, ID5, ID6, ID8, ID9, DBS2, DBS4, DBS5, DBS6, DBS11). This allows simultaneous discovery of known and new signatures. For known signatures, signatures identified by HDP with ≥0.90 cosine similarity with corresponding reported signatures were accepted as known signatures. Deconvolution of new signatures to above known signatures was also performed, and one new indel signature was deconvoluted in ID5 and ID8. Finally, 10 known and 1 new signatures were identified.
Analysis of A>G transcription strand bias
First, we measured distance from mutations to nearest transcription start sites (TSSs) of the all expressed genes in lung, which was defined as those with median of ≥1 Transcripts Per Million (tpm) in lung samples in GTEx database (https://gtexportal.org/home/). Mutations in regions of bidirectional transcription were excluded from the further analysis. We tiled 10 kilobases up and downstream of the TSSs into 1kbp bins, and counted the number of A>G mutations on transcribed and untranscribed regions in each tile, which were further divided by average of bins in intergenic regions.
Analysis of driver variants
To systematically identify genes under positive selection in normal bronchial epithelium, we used the dN/dS method12. We performed exome-wide dN/dS analysis and also analysed global dN/dS ratios for driver genes (n = 86) reported in lung cancer12,13,18,26 or normal skin/oesophagus tissues27–29 using dNdScv (Supplementary Table 3). Genes with q-value ≤0.05 were reported as driver genes (Supplementary Tables 4-5). Finally, hot-spot mutations reported in COSMIC for ≥4 patients were also considered as driver mutations, in addition to those in the 7 driver genes identified by dNdScv (Figure 3B). Proportion of shared/private mutations was calculated for patients other than PD30160 (which had a low number of sequenced samples (n = 13)). For TP53 and NOTCH1 genes, distributions of mutations were compared between bronchial cells and lung squamous cell carcinoma13 (Extended Figure 9B).
To estimate the effect of smoking status on the number of driver mutations, a generalized linear mixed-effects model was fitted using ‘lme4’ R package (Supplementary Code). Patient was modelled as a random effect, and fixed effect of age, smoking status and total mutation burden were fitted into the model.
Telomere length estimation
The average telomere length of bronchial epithelium cells were estimated from the whole-genome sequencing data using Telomerecat51. Considering the similarity of telomere sequences between human and mouse, we aligned all sequencing reads to the human reference genome using BWA-MEM without using Xenome, and subsequently ran Telomerecat on the bam files. Samples with more than 10% reported mouse contamination were excluded from further analysis to prevent a possible effect of mouse cells on telomere length. The average telomere length for the mouse fibroblast feeder samples was estimated at 1745bp, which is in range with human telomere length estimates, so a low level of mouse contamination will not affect the estimates substantially.
Subsequently, a linear mixed-effect model was fitted to estimate the effect of telomere length on the number of SBSs using ‘lme4’ R package (Supplementary Code). Patient was modelled as a random effect, and fixed effect of telomere length and its interaction with smoking status as well as fixed effect of age and smoking status were fitted into the model.
Extended Data
Extended Data Figure 1. Flow-sorting strategy of single basal bronchial epithelial cells.
(A) Sorting of EpCam+ epithelial cells from human airway biopsies. Human hematopoietic and endothelial cells were stained with antibodies against CD45 and CD31, respectively. Within the population of cells negative for those markers, EpCam-expressing cells were gated. Single, live (DAPI-negative) cells were flow sorted from this population into individual wells of 96-well plates.
(B) qPCR analysis of clonally derived airway epithelial cell cultures. Airway basal cells express integrin alpha 6 (ITGA6), keratin 5 (KRT5), e-cadherin (CDH1) and TP63. Expression is shown in clonally derived cell cultures (n = 13 from 3 donors, coloured blue, green and orange) compared to a control bulk human bronchial epithelial cell culture expanded in the same culture conditions and a lung fibroblast cell culture that served as a negative control. Centre values and error bars indicate mean and standard error of the mean, respectively. Conditions in which no expression was detected are shown as 0.
(C) Colony-forming efficiency of CD45-/CD31-/EPCAM+ cells after single cell sorting from endobronchial biopsy samples (n = 16). For one ex-smoker, EPCAM was not used to select cells: only CD45-/CD31- cells were sorted – as expected, this is the patient with the lowest colony-forming efficiency.
Extended Data Figure 2. Quality assurance of mutation calls.
(A) Stacked bar chart showing the proportion of reads attributed to the human genome, mouse genome, both, neither or with ambiguous mapping for the pure mouse fibroblast feeder line (left) or a pure human sample (right), assessed with the Xenome pipeline.
(B) Clean-up of mutation calls using the xenome pipeline for one of the samples more heavily contaminated by the mouse feeder layer. The Venn diagram on the left shows the overlap in mutation calls before and after removing non-human reads by xenome.
(C) Histograms of variant allele fraction (VAF) for two representative colonies in the sample set. The plot on the left shows a tight distribution around 50%, as expected for a colony derived from a single cell without contamination. The plot on the right shows a bimodal distribution with one peak at 50% (mutations present in the original basal cell) and a second peak at ~25%, likely representing mutations acquired in vitro during colony expansion. These second peaks at <50% are more evident in colonies from the children, due to the low number of mutations in the original basal cell.
(D) Histogram of variant allele fraction (VAF) for a colony seeded by more than one basal cell, leading to a peak <<50%.
(E) Estimated sensitivity of mutation calling according to sequencing depth. Heterozygous germline polymorphisms were identified in each subject – for each colony sequenced, we calculated the fraction of these polymorphisms recalled by our algorithms.
(F) Comparison of mutation burden in normal bronchial epithelial cells that neighbour a carcinoma in situ (CIS) versus distant from it in 5 patients. Box-and-whisker plots show distribution of mutation burden per colony within each subject, with the boxes indicating median and interquartile range, and the whiskers denoting the range. The overlaid points are the observed mutation burden of individual colonies.
Extended Data Figure 3. Colonies with near-normal mutation burden.
(A) Density distribution of mutation burden in cells from ex-smokers (green) and current smokers (purple). The black vertical line shows the threshold for near-normal mutation burden derived for each patient. The x axis is on a log scale. Note the frequently bimodal distribution of mutation burden, especially in the ex-smokers, with the modes separated at the threshold for near-normal mutation burden.
(B) Flow cytometric analysis of clones for expression of keratin 5 (KRT5), EPCAM, integrin α6 (ITGA6), podoplanin (PDPN), NGFR and CD45/CD31. Lung fibroblasts are included as a comparison. Fluorescence minus one (FMO) shown. Plots for one clone with near-normal mutation burden and one with increased burden are shown, representative of 5 clones from 1 patient.
(C) Brightfield image of expanded clones at passage 3, showing cobblestone epithelial morphology, representative of 5 clones from 1 patient. A clone with elevated mutation burden is shown in the top panels; a clone from an ex-smoker with near-normal mutation burden is shown in the bottom panels. Left image x10 magnification, scale bar = 200 μm and right image x20 magnification, scale bar = 100 μm.
Extended Data Figure 4. Indels, copy number changes and structural variants in normal bronchial epithelial cells.
(A) Relationship of burden of indels per cell with age, with points representing individual colonies (n = 632), coloured by smoking status. The black line represents the fitted effect of age on indel burden, estimated from linear mixed effects models after correction for smoking status and within-patient correlation structure. The blue shaded area represents the 95% confidence interval for the fitted line.
(B) Stacked bar plot showing the distribution of colonies with 0-7 copy number changes and structural variants across the 16 subjects.
(C) Three examples of chromoplexy in normal bronchial cells. Structural variants are shown as coloured arcs joining two positions in the genome around the circumference. The chromoplexy instances all consist of 3 translocations, in purple.
(D) An example of chromothripsis in a cell from an 11-month old infant. The plot on the right shows copy number of genomic windows in the relevant region of chromosome 1 (black points), with the lines and arcs denoting positions of observed structural variants.
Extended Data Figure 5. Comparison of mutational signatures extracted using two algorithms.
(A) Trinucleotide contexts for the signatures extracted by the hierarchical Dirichlet process (HDP) on the left and MutationalPatterns non-negative matrix factorisation on the right. The six substitution types are shown in the panels across the top of each signature. Within each panel, the trinucleotide context is shown as four sets of four bars, grouped by whether an A, C, G or T respectively is 5’ to the mutated base, and within each group of four by whether A, C, G or T is 3’ to the mutated base. Where signatures show high cosine similarity scores between algorithms, they are lined up horizontally. We note that MutationalPatterns’ Signature C does not have a match in the signatures extracted by the hierarchical Dirichlet process algorithm, but appears very similar to Signature A in MutationalPatterns (or SBS-5 from the hierarchical Dirichlet process). This means it likely represents over-splitting of the signatures.
(B) The heatmap shows the cosine similarities of signatures extracted by MutationalPatterns with those extracted by the hierarchical Dirichlet process (HDP). Only cosine similarity scores >0.75 are coloured.
(C) Scatterplots showing the fraction of mutations in each colony (n = 632) assigned to each signature by the hierarchical Dirichlet process (HDP; x axis) versus the MutationalPatterns algorithm (y axis). Correlation values quoted are Pearson’s correlation coefficients, R2.
(D) Transcription strand bias of A>G mutations in N[A]T context before and after transcription start sites. Note the absence of transcriptional strand bias in intergenic regions, but evidence for both transcription-coupled damage and repair after the transcription start site, applying similarly in both never smokers and ex-/current smokers.
Extended Data Figure 6. Phylogenetic trees of 13 subjects.
Phylogenetic trees showing clonal relationships among normal bronchial cells in the 13 subjects not shown in Figure 3A. Branch lengths are proportional to the number of mutations (x axis) specific to that clone/subclone. Each branch is coloured by the proportion of mutations on that branch attributed to the various single base substitution signatures.
Extended Data Figure 7. Indel signatures in the sample set.
(A) Five indel signatures were extracted by the hierarchical Dirichlet process. Contribution of different types of indels to each signature are shown, grouped by whether variants are deletions or insertions; size of event; whether they occur at repeat units; and the sequence content of the indel.
(B) Stacked bar-plot showing the proportional contribution of mutational signatures to indels across the 632 colonies derived from normal bronchial cells, extracted using a hierarchical Dirichlet process. Within each patient, colonies are sorted from left to right by increasing indel burden (bar chart in dark grey above coloured signature attribution stacks).
Extended Data Figure 8. Double base substitution signatures in the sample set.
(A) Six double base substitution (DBS) signatures were extracted by the hierarchical Dirichlet process. Contribution of different types of DBS to each signature are shown, grouped by the sequence that is mutated, and what it is mutated to. Five of the signatures have been observed in cancer genomes24, with one (DBS Sig-C) a novel signature extracted here.
(B) Stacked bar-plot showing the proportional contribution of mutational signatures to double base substitutions across the 632 normal bronchial cells, extracted using a hierarchical Dirichlet process. Note that some of the colonies in children have no double base substitutions. Within each patient, colonies are sorted from left to right by increasing DBS burden (bar chart in dark grey above coloured signature attribution stacks).
Extended Data Figure 9. Driver mutations in normal bronchial epithelium.
(A) Stick plots showing distribution of mutations in TP53, NOTCH1 and other genes that were significantly mutated in our sample set – mutations are coloured by type. The gene structure is shown horizontally in the centre of each plot with domains as coloured bars. Above the gene are mutations in this sample set; below the gene are the mutations found in squamous cell carcinomas from the TCGA sample set.
(B) Fraction of cells with driver mutations in TP53 (left), NOTCH1 (middle) or all other significant cancer genes (right), split by smoking status.
Extended Data Figure 10. Relationship of telomere lengths with age.
Scatter-plot of estimated telomere lengths (y axis) against age of subject (x axis). Individual points represent colonies (n = 398 colonies with <10% DNA deriving from the mouse feeder layer). Cells with near-normal mutation burden are identified in a gold colour.
Supplementary Material
Acknowledgements
This work was supported by a Cancer Research UK Grand Challenge Award (C98/A24032) and the Wellcome Trust. P.J.C. and S.M.J. are Wellcome Trust Senior Clinical Fellows (WT088340MA). S.M.J. receives funding as a member of the UK Regenerative Medicine Platform (UKRMP2) Engineered Cell Environment Hub (MRC; MR/R015635/1) and the Longfonds BREATH lung regeneration consortium. S.M.J. is further supported by The Rosetrees Trust, the Stoneygate Trust, the British Lung Foundation and The UCLH Charitable Foundation. K.Y. is supported by a Japan Society for the Promotion of Science (JSPS) Overseas Research Fellowship and The Mochida Memorial Foundation for Medical and Pharmaceutical Research. S.M.J. and R.E.H. are supported by the Roy Castle Lung Cancer Foundation. R.E.H. is a Wellcome Trust Sir Henry Wellcome Fellow (WT209199/Z/17/Z). I.M. is funded by Cancer Research UK (C57387/A21777).
Footnotes
Data Availability
Sequencing data have been deposited at the European Genome-Phenome Archive (http://www.ebi.ac.uk/ega/) under accession numbers EGAD00001005193. Somatic mutation calls, including single base substitutions, indels and structural variants, from all 632 samples have been deposited on Mendeley Data with the identifier: http://dx.doi.org/10.17632/b53h2kwpyy.2.
Code Availability
- R: version 3.5.1
- BWA-MEM: version 0.7.17-r1188 (https://sourceforge.net/projects/bio-bwa/)
- CaVEMan: version 1.11.2 (https://github.com/cancerit/CaVEMan)
- Pindel: version 2.2.5 (https://github.com/cancerit/cgpPindel)
- Brass: version 6.1.2 (https://github.com/cancerit/BRASS)
- ASCAT NGS: version 4.1.2 (https://github.com/cancerit/ascatNgs)
- deepSNV: version 1.28.0 (https://bioconductor.org/packages/release/bioc/html/deepSNV.html)
- ANNOVAR: (http://wannovar.wglab.org/)
- JBrowse: (https://jbrowse.org/)
- cgpVAF: (https://github.com/cancerit/vafCorrect)
- RPhylip: version 0.1.23 (http://www.phytools.org/Rphylip/)
- hdp: version 0.1.5 (https://github.com/nicolaroberts/hdp)
- MutationalPatterns: version 1.8.0 (https://bioconductor.org/packages/release/bioc/html/MutationalPatterns.html)
- dNdScv: version 0.0.1 (https://github.com/im3sanger/dndscv)
- Telomerecat: version 3.1.2 (https://github.com/jhrf/telomerecat)
Author Contributions
S.M.J., P.J.C., K.Y., K.H.C.G. and H.L.-S. designed the experiments. K.H.C.G performed all of the sample collection, cell isolation, clonal expansion and DNA extraction, with help from D.P.C., E.F.M. and F.R.M. E.F.M and C.R.B. collected the paediatric samples, and E.F.M., D.P.C. and R.M.T. collected the adult samples. E.A. made sequencing libraries. K.Y. performed most of the data curation and statistical analysis, with H.L.-S., T.C., K.B., A.M., N.K. and T.H. providing assistance and advice. S.E.C. oversaw all of the clinical data collection and curation, and performed the flow cytometry characterisation of the clones. R.E.H. and K.H.C.G. performed the qPCR characterisation of the clones. M.R.S. oversaw the analysis of mutational signatures. P.J.C and I.M. oversaw statistical analyses. R.E.H., A.P., K.H.C.G., K.Y., S.M.J. and P.J.C. performed data interpretation and together with D.P.C. helped draft and revise the manuscript.
Competing Interests
The authors declare no competing interests.
References
- 1.Alberg AJ, Brock MV, Ford JG, Samet JM, Spivack SD. Epidemiology of lung cancer: Diagnosis and management of lung cancer, 3rd ed: American College of Chest Physicians evidence-based clinical practice guidelines. Chest. 2013;143:e1S–e29S. doi: 10.1378/chest.12-2345. [DOI] [PMC free article] [PubMed] [Google Scholar]
- 2.Peto R, et al. Smoking, smoking cessation, and lung cancer in the UK since 1950: combination of national statistics with two case-control studies. BMJ. 2000;321:323–9. doi: 10.1136/bmj.321.7257.323. [DOI] [PMC free article] [PubMed] [Google Scholar]
- 3.International Agency for Research on Cancer. Tobacco Smoke and Involuntary Smoking. 2004;83 [Google Scholar]
- 4.Hecht SS. Progress and challenges in selected areas of tobacco carcinogenesis. Chem Res Toxicol. 2008;21:160–171. doi: 10.1021/tx7002068. [DOI] [PMC free article] [PubMed] [Google Scholar]
- 5.Pfeifer GP, et al. Tobacco smoke carcinogens, DNA damage and p53 mutations in smoking-associated cancers. Oncogene. 2002;21:7435–7451. doi: 10.1038/sj.onc.1205803. [DOI] [PubMed] [Google Scholar]
- 6.Pleasance ED, et al. A small-cell lung cancer genome with complex signatures of tobacco exposure. Nature. 2010;463:184–190. doi: 10.1038/nature08629. [DOI] [PMC free article] [PubMed] [Google Scholar]
- 7.Imielinski M, et al. Mapping the hallmarks of lung adenocarcinoma with massively parallel sequencing. Cell. 2012;150:1107–1120. doi: 10.1016/j.cell.2012.08.029. [DOI] [PMC free article] [PubMed] [Google Scholar]
- 8.Alexandrov LB, et al. Mutational signatures associated with tobacco smoking in human cancer. Science (80-. ) 2016;354:618–622. doi: 10.1126/science.aag0299. [DOI] [PMC free article] [PubMed] [Google Scholar]
- 9.Field JK, et al. Comprehensive genomic profiles of small cell lung cancer. Nature. 2015;524:47–53. doi: 10.1038/nature14664. [DOI] [PMC free article] [PubMed] [Google Scholar]
- 10.Jamal-Hanjani M, et al. Tracking the Evolution of Non-Small-Cell Lung Cancer. N Engl J Med. 2017;376:2109–2121. doi: 10.1056/NEJMoa1616288. [DOI] [PubMed] [Google Scholar]
- 11.Tomasetti C, Marchionni L, Nowak MA, Parmigiani G, Vogelstein B. Only three driver gene mutations are required for the development of lung and colorectal cancers. Proc Natl Acad Sci. 2015;112:118–123. doi: 10.1073/pnas.1421839112. [DOI] [PMC free article] [PubMed] [Google Scholar]
- 12.Martincorena I, et al. Universal Patterns of Selection in Cancer and Somatic Tissues. Cell. 2017;171:1029–1041. doi: 10.1016/j.cell.2017.09.042. [DOI] [PMC free article] [PubMed] [Google Scholar]
- 13.Campbell JD, et al. Distinct patterns of somatic genome alterations in lung adenocarcinomas and squamous cell carcinomas. Nat Genet. 2016;48:607–616. doi: 10.1038/ng.3564. [DOI] [PMC free article] [PubMed] [Google Scholar]
- 14.Garfinkel L, Stellman SD. Smoking and lung cancer in women: Findings in a prospective study. Cancer Res. 1988;48:6951–6955. [PubMed] [Google Scholar]
- 15.Armitage P. Response to Richard Doll: The age distribution of cancer. J R Stat Soc Ser A. 1971;134:155–156. [Google Scholar]
- 16.Doll R, Peto R. Cigarette smoking and bronchial carcinoma: dose and time relationships among regular smokers and lifelong non-smokers. J Epidemiol Community Health. 1978;32:303–313. doi: 10.1136/jech.32.4.303. [DOI] [PMC free article] [PubMed] [Google Scholar]
- 17.Lee JJ-K, et al. Tracing Oncogene Rearrangements in the Mutational History of Lung Adenocarcinoma. Cell. 2019:1–16. doi: 10.1016/j.cell.2019.05.013. [DOI] [PubMed] [Google Scholar]
- 18.The Cancer Genome Atlas Research Network. Comprehensive genomic characterization of squamous cell lung cancers. Nature. 2012;489:519–525. doi: 10.1038/nature11404. [DOI] [PMC free article] [PubMed] [Google Scholar]
- 19.Kucab JE, et al. A Compendium of Mutational Signatures of Environmental Agents. Cell. 2019:1–16. doi: 10.1016/j.cell.2019.03.001. [DOI] [PMC free article] [PubMed] [Google Scholar]
- 20.Blokzijl F, Janssen R, van Boxtel R, Cuppen E. MutationalPatterns: comprehensive genome-wide analysis of mutational processes. Genome Med. 2018;10:33. doi: 10.1186/s13073-018-0539-0. [DOI] [PMC free article] [PubMed] [Google Scholar]
- 21.Petljak M, et al. Characterizing Mutational Signatures in Human Cancer Cell Lines Reveals Episodic APOBEC Mutagenesis. Cell. 2019;176:1282–1294.e20. doi: 10.1016/j.cell.2019.02.012. [DOI] [PMC free article] [PubMed] [Google Scholar]
- 22.Haradhvala NJ, et al. Mutational Strand Asymmetries in Cancer Genomes Reveal Mechanisms of DNA Damage and Repair. Cell. 2016;164:538–549. doi: 10.1016/j.cell.2015.12.050. [DOI] [PMC free article] [PubMed] [Google Scholar]
- 23.Letouzé E, et al. Mutational signatures reveal the dynamic interplay of risk factors and cellular processes during liver tumorigenesis. Nat Commun. 2017;8 doi: 10.1038/s41467-017-01358-x. [DOI] [PMC free article] [PubMed] [Google Scholar]
- 24.Alexandrov L, et al. The Repertoire of Mutational Signatures in Human Cancer. Nature. 2019 doi: 10.1038/s41586-020-1943-3. XXX, XXX. [DOI] [PMC free article] [PubMed] [Google Scholar]
- 25.The Cancer Genome Atlas Research Network. Comprehensive molecular profiling of lung adenocarcinoma. Nature. 2014;511:543–550. doi: 10.1038/nature13385. [DOI] [PMC free article] [PubMed] [Google Scholar]
- 26.Lawrence MS, et al. Discovery and saturation analysis of cancer genes across 21 tumour types. Nature. 2014;505:495–501. doi: 10.1038/nature12912. [DOI] [PMC free article] [PubMed] [Google Scholar]
- 27.Martincorena I, et al. High burden and pervasive positive selection of somatic mutations in normal human skin. Science (80-. ) 2015;348:880–886. doi: 10.1126/science.aaa6806. [DOI] [PMC free article] [PubMed] [Google Scholar]
- 28.Martincorena I, et al. Somatic mutant clones colonize the human esophagus with age. Science (80-. ) 2018;917:911–917. doi: 10.1126/science.aau3879. [DOI] [PMC free article] [PubMed] [Google Scholar]
- 29.Yokoyama A, et al. Age-related remodelling of oesophageal epithelia by mutated cancer drivers. Nature. 2019;565:312–317. doi: 10.1038/s41586-018-0811-x. [DOI] [PubMed] [Google Scholar]
- 30.Yizhak K, et al. A comprehensive analysis of RNA sequences reveals macroscopic somatic clonal expansion across normal tissues. Science (80-. ) 2019;364 doi: 10.1126/science.aaw0726. eaaw0726. [DOI] [PMC free article] [PubMed] [Google Scholar]
- 31.Brunner SF, et al. Somatic mutations and clonal dynamics in healthy and cirrhotic human liver. Nature. 2019;574:538–542. doi: 10.1038/s41586-019-1670-9. [DOI] [PMC free article] [PubMed] [Google Scholar]
- 32.Teixeira VH, et al. Stochastic homeostasis in human airway epithelium is achieved by neutral competition of basal cell progenitors. Elife. 2013;2:e00966. doi: 10.7554/eLife.00966. [DOI] [PMC free article] [PubMed] [Google Scholar]
- 33.Hegab AE, et al. Novel stem/progenitor cell population from murine tracheal submucosal gland ducts with multipotent regenerative potential. Stem Cells. 2011;29:1283–1293. doi: 10.1002/stem.680. [DOI] [PMC free article] [PubMed] [Google Scholar]
- 34.Tata A, et al. Myoepithelial Cells of Submucosal Glands Can Function as Reserve Stem Cells to Regenerate Airways after Injury. Cell Stem Cell. 2018;22:668–683.e6. doi: 10.1016/j.stem.2018.03.018. [DOI] [PMC free article] [PubMed] [Google Scholar]
- 35.Lynch TJ, et al. Submucosal Gland Myoepithelial Cells Are Reserve Stem Cells That Can Regenerate Mouse Tracheal Epithelium. Cell Stem Cell. 2018;22:653–667.e5. doi: 10.1016/j.stem.2018.03.017. [DOI] [PMC free article] [PubMed] [Google Scholar]
- 36.Gowers KHC, et al. Optimized isolation and expansion of human airway epithelial basal cells from endobronchial biopsy samples. J Tissue Eng Regen Med. 2018;12:e313–e317. doi: 10.1002/term.2466. [DOI] [PMC free article] [PubMed] [Google Scholar]
- 37.Butler CR, et al. Rapid expansion of human epithelial stem cells suitable for airway tissue engineering. Am J Respir Crit Care Med. 2016;194:156–168. doi: 10.1164/rccm.201507-1414OC. [DOI] [PMC free article] [PubMed] [Google Scholar]
- 38.Teixeira VH, et al. Deciphering the genomic, epigenomic, and transcriptomic landscapes of pre-invasive lung cancer lesions. Nat Med. 2019;25:517–525. doi: 10.1038/s41591-018-0323-0. [DOI] [PMC free article] [PubMed] [Google Scholar]
- 39.Conway T, et al. Xenome-a tool for classifying reads from xenograft samples. Bioinformatics. 2012;28:172–178. doi: 10.1093/bioinformatics/bts236. [DOI] [PMC free article] [PubMed] [Google Scholar]
- 40.Jones D, et al. cgpCaVEManWrapper: Simple Execution of CaVEMan in Order to Detect Somatic Single Nucleotide Variants in NGS Data. Current Protocols in Bioinformatics. 2016:15.10.1–15.10.18. doi: 10.1002/cpbi.20. [DOI] [PMC free article] [PubMed] [Google Scholar]
- 41.Gerstung M, Papaemmanuil E, Campbell PJ. Subclonal variant calling with multiple samples and prior knowledge. Bioinformatics. 2014;30:1198–204. doi: 10.1093/bioinformatics/btt750. [DOI] [PMC free article] [PubMed] [Google Scholar]
- 42.Yang H, Wang K. Genomic variant annotation and prioritization with ANNOVAR and wANNOVAR. Nat Protoc. 2015;10:1556–1566. doi: 10.1038/nprot.2015.105. [DOI] [PMC free article] [PubMed] [Google Scholar]
- 43.Raine KM, et al. cgpPindel: Identifying Somatically Acquired Insertion and Deletion Events from Paired End Sequencing. Curr Protoc Bioinformatics. 2015;52:15.7.1–15.7.12. doi: 10.1002/0471250953.bi1507s52. [DOI] [PMC free article] [PubMed] [Google Scholar]
- 44.Campbell PJ, et al. Identification of somatically acquired rearrangements in cancer using genome-wide massively parallel paired-end sequencing. Nat Genet. 2008;40:722–9. doi: 10.1038/ng.128. [DOI] [PMC free article] [PubMed] [Google Scholar]
- 45.Raine KM, et al. ascatNgs: Identifying Somatically Acquired Copy-Number Alterations from Whole-Genome Sequencing Data. Current Protocols in Bioinformatics. 2016:15.9.1–15.9.17. doi: 10.1002/cpbi.17. [DOI] [PMC free article] [PubMed] [Google Scholar]
- 46.Van Loo P, et al. Allele-specific copy number analysis of tumors. Proc Natl Acad Sci U S A. 2010;107:16910–16915. doi: 10.1073/pnas.1009843107. [DOI] [PMC free article] [PubMed] [Google Scholar]
- 47.Buels R, et al. JBrowse: A dynamic web platform for genome visualization and analysis. Genome Biol. 2016;17:1–12. doi: 10.1186/s13059-016-0924-1. [DOI] [PMC free article] [PubMed] [Google Scholar]
- 48.Baca SC, et al. Punctuated evolution of prostate cancer genomes. Cell. 2013;153:666–677. doi: 10.1016/j.cell.2013.03.021. [DOI] [PMC free article] [PubMed] [Google Scholar]
- 49.Stephens PJ, et al. Massive genomic rearrangement acquired in a single catastrophic event during cancer development. Cell. 2011;144:27–40. doi: 10.1016/j.cell.2010.11.055. [DOI] [PMC free article] [PubMed] [Google Scholar]
- 50.Li Y, et al. Patterns of somatic structural variation in human cancer genomes. Nature. 2019 doi: 10.1038/s41586-019-1913-9. In press. [DOI] [PMC free article] [PubMed] [Google Scholar]
- 51.Farmery JHR, et al. Telomerecat: A ploidy-agnostic method for estimating telomere length from whole genome sequencing data. Sci Rep. 2018;8:1–17. doi: 10.1038/s41598-017-14403-y. [DOI] [PMC free article] [PubMed] [Google Scholar]
Associated Data
This section collects any data citations, data availability statements, or supplementary materials included in this article.


