Abstract
The biology of hematopoietic stem cells (HSCs) has predominantly been studied under transplantation conditions1,2. Particularly challenging has been the study of dynamic HSC behaviors given that live animal HSC visualization in the native niche still represents an elusive goal in the field. Here, we describe a dual genetic strategy in mice that restricts reporter labeling to a subset of the most quiescent long-term HSCs (LT-HSCs) and that is compatible with current intravital imaging approaches in the calvarial bone marrow (BM)3–5. We find that this subset of LT-HSCs resides in close proximity to both sinusoidal blood vessels and the endosteal surface. In contrast, multipotent progenitor cells (MPPs) display a broader distance distribution from the endosteum and are more likely to be associated with transition zone vessels. LT-HSCs are not found in BM niches with the deepest hypoxia and instead are found in similar hypoxic environments as MPPs. In vivo time-lapse imaging reveals that LT-HSCs display limited motility at steady-state. Following activation, LT-HSCs display heterogenous responses, with some cells becoming highly motile and a fraction of HSCs expanding clonally within spatially restricted domains. These domains have defined characteristics, as HSC expansion is found almost exclusively in a subset of BM cavities exhibiting bone-remodeling activities. In contrast, cavities with low bone-resorbing activities do not harbor expanding HSCs. These findings point to a new degree of heterogeneity within the BM microenvironment, imposed by the stages of bone turnover. Overall, our approach enables direct visualization of HSC behaviors and dissection of heterogeneity in HSC niches.
Current live animal HSC tracking studies require transplantation of the HSCs that are imaged, typically in the calvarium of an irradiated recipient whose BM microenvironment is severely altered4,6. Therefore, while engraftment biology can be studied in these models, stem cell and progenitor’s behavior is likely different than in a fully unperturbed state1,2,4. The recent description of HSC-reporter lines in mice has facilitated the identification of these cells in bone sections and after tissue clearing; nevertheless, these reporters are still not fully HSC specific and require the use of additional markers for their identification7–9. Despite these advances there is still considerable uncertainty about the exact localization of HSC and progenitor cells. Even less is known about the nature of distinct niches that support HSC proliferation or maintain HSC quiescence7.
Characterization of an HSC-specific reporter mouse line
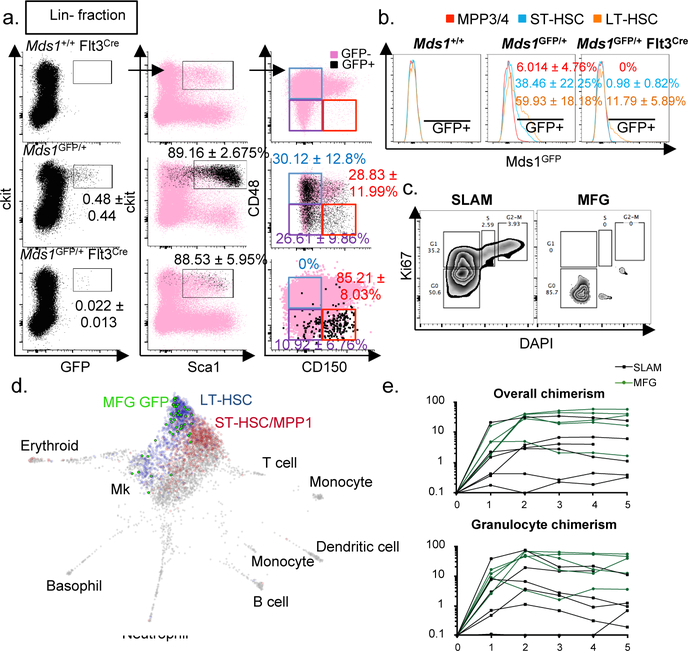
Our previous work demonstrated that the expression of the Myelodysplastic syndrome 1 (Mds1) gene is highly enriched in LT-HSCs10. Mds1 is transcribed from its own promoter in the MECOM locus, which also produces the well-known Evi1 gene product and the Mds1-Evi1 gene fusion product11. We targeted an EGFP expression cassette to the first transcriptional start site of Mds1 (Extended data figure 1a). The resulting allele is predicted to be a hypomorph for Mds1 and Mds1-Evi1 but have no effect on the expression of Evi1. Mds1GFP/+ mice displayed normal hematopoietic parameters, HSC frequencies and cell cycle properties, and response to myelosuppression (Extended data figure 1b–f). Flow cytometric characterization of these mice confirmed the complete absence of GFP expression in any mature lineage positive (Lin+) hematopoietic cells (Extended data figure 2a and Supplementary File 2). GFP expression was predominantly restricted to a small fraction of cKit+ Sca1+ cells (Figure 1a). Using standard phenotypical parameters12,13, we found that 28.83 ± 11.99% of BM cells gated solely on GFP could be categorized as LT-HSCs, 26.61 ± 9.86% as short-term HSCs (ST-HSCs) and 30.12 ± 12.8% as MPPs (Figure 1a and Supplementary File 1). Within the phenotypic LT-HSC compartment, approximately 60% of cells expressed GFP, compared to 6% of MPPs (Figure 1b). We refer to this mixed population as hematopoietic stem and progenitor cells (HSPCs). Importantly, the reporter is not expressed in non-hematopoietic compartments of the BM (Extended data figure 2b, c and Supplementary File 3).
Figure 1. Generation and characterization of Mds1GFP/+ Flt3Cre (MFG) mice.
a, b, Flow cytometric analysis of Mds1GFP/+ only (N=10 mice) and Mds1GFP/+ Flt3-Cre (N=13 mice), mean ± SD. c, Cell cycle analysis of GFP+ cells from MFG mice vs. HSCs isolated based on SLAM immunophenotype. Representative analysis shown, depicting data from multiple mice (MFG=7 mice) or (SLAM=2 mice) which were pulled together to acquire the displayed data. d, SPRING plot layout of transcriptomes of 50 single MFG+ HSCs projected in published scRNA dataset of HSCs and MPPs (from Rodriguez-Fraticelli et al). Blue=LT-HSCs (789 cells), Red=ST-HCSs (742 cells), Grey=other cells, Bright Green=MGF HSCs (46 cells). e, Overall and granulocyte chimaerism post-transplantation in primary lethally-irradiated recipients transplanted with 25 MFG+ or SLAM cells from Mds1GFP/+ Flt3Cre mice. Each line represents an individual mouse. N=6 mice for SLAM group, N=5 mice for MFG sorted group. Only engrafted mice are represented.
With the aim of eliminating the labeling of MPPs in the Mds1GFP/+ model, we reasoned that the additional expression of a gene associated with early differentiation could facilitate exclusive LT-HSC identification. We noticed increased brightness of the reporter in phenotyical LT-HSCs, which was inversely correlated with the expression of Flt3, a gene whose expression has been associated with loss of long-term self-renewal14,15 (Extended data figure 2d). Taking advantage of the fact that the GFP coding sequences in the Mds1GFP/+ allele are flanked by loxP sites (Extended data figure 1a), we introduced a Flt3-Cre allele into our model (Extended data figure 3a). This allele drives Cre-recombination in cells beginning in the ST-HSC compartment14,15 (Extended data figure 3b). Characterization of Mds1GFP/+ Flt3-Cre mice revealed an extremely rare GFP+ population (to be referred as MFG) that corresponds to only 0.022 ± 0.013% of the lineage negative BM (Figure 1a, b). Remarkably, approximately 85% of cells gated solely on the basis of GFP reside in the phenotypically defined LT-HSC fraction (Figure 1a, Extended data figure 3e). Another 10% of MFG GFP+ cells display slightly lower levels of CD150 and might be classified as ST-HSCs (Figure 1a), while the other 5% represents CD150+ CD48- cells that express lower levels of Sca-1, and likely represent megakaryocyte progenitors (MkPs) (Extended data figure 3c and Supplementary File 1). MFG cells constituted only about 12% of the phenotypical LT-HSC population (Figure 1b). The specificity of LT-HSC labeling in MFG mice is recapitulated in BM from multiple locations (Extended data figure 3d). MFG cells represented a largely quiescent population (Figure 1c, Extended data figure 3g) expressing relatively high levels of Sca1, EPCR, and are CD34-/low (Extended data figure 3e, f), consistent with previously described dormant HSCs16.
To further validate our combined Mds1GFP/+ Flt3-Cre model, we performed single cell RNAseq in cells isolated exclusively on the basis of GFP expression17. The resulting transcriptomes were then extrapolated to a published single cell transcriptional map of LT-HSCs, ST-HSCs, and multiple MPP populations (MPP2/3/4)18. Strikingly, virtually all MFG+ transcriptomes map to the most unprimed cluster of cells where phenotypic LTHSCs also reside (Figure 1d and Extended data figure 4a). A small fraction of MFG+ cells display megakaryocyte lineage priming (Figure 1d and Extended data figure 3c), a feature recently described in multipotent HSCs18,19. This analysis also highlights the efficiency of our approach in restricting GFP expression to Mds1+Flt3- cells (Extended data figure 4b). MFG cells expressed transcripts also enriched in dormant HSCs16 (Extended data figure 4c, d). Additionally, single cell FLUIDIGM analysis for a 280-gene hematopoietic gene panel20, demonstrates clustering of MFG cells with LT-HSCs but no other progenitor signatures (Extended data figure 4e). Finally, we performed long-term reconstitution assays to assess the potency of MFG+ cells in comparison to cells isolated based on traditional SLAM parameters. Limiting dilution transplants using 3 to 25 cells suggest that MFG HSCs are at least as enriched as SLAM cells in transplantation capacity (Figure 1e, Extended data 4f). MFG cells also repopulated secondary recipients (Extended data figure 4g). In addition, within the SLAM compartment, long-term repopulating activity is enriched in cells expressing GFP (Extended data figure 4h). Thus, our MFG animal model allows the isolation of a highly quiescent sub-population of LT-HSCs with potent repopulation potential.
Localization of MFG-HSCs in the calvaria
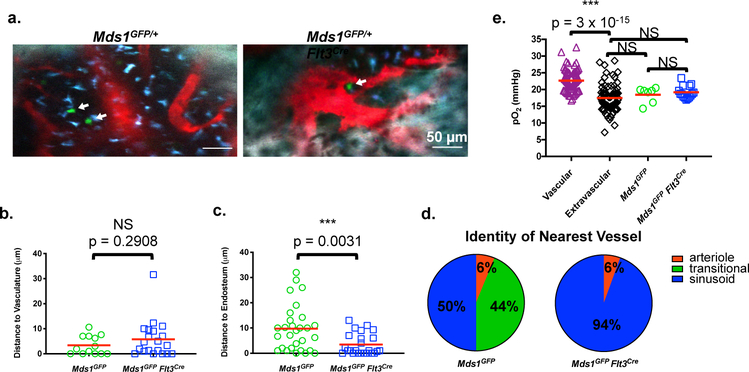
Using these two reporter models, we performed live animal imaging of GFP+ cells in the calvarium3,4. As expected, Mds1-only HSPCs are more prevalent than MFG-HSCs (Figure 1a, b and 2a). Both cell types were found to be in a peri-vascular location of average distance less than ~10 μm from the closest vessel (Figure 2b, Videos 1,2). MFG-HSCs were also found in a similarly close distance to the endosteum (Figure 2c), pointing to a possible dual endosteal-vascular niche as suggested previously3,21,22. However, we found the MFG-HSCs to be almost exclusively associated with sinusoids rather than arterioles (Figure 2d). While HSPCs also predominantly localized close to sinusoids, a significant fraction of these were also nearby transition zone vessels (Figure 2d) and displayed a broader distance distribution from the endosteum (Figure 2c), suggesting different micro-niches for MFG-HSC and downstream HSPCs.
Figure 2. Steady-state localization and oxygen levels around MFG-HSCs and HSPCs.
a, Representative intravital images of HSPCs (left image, N=8 mice) and an MFG-HSC (right image, N=10 mice) in the calvaria of Mds1GFP/+ and Mds1GFP/+ Flt3Cre mice, respectively. GFP cells (white arrows) are shown in green, vasculature (Angiosense 680EX) in red, auto-fluorescence in blue, and bone (second harmonic generation) in white. Scale bars ~50 μm. b, c, Distance of each HSPC (n=13 and 29 cells from 3 and 4 mice for b and c, respectively) and MFG-HSC (n=20 and 24 cells from 6 and 8 mice for b and c, respectively) to the nearest vessel and endosteal surface are displayed, respectively. P values were calculated using two-tailed unpaired T tests. Red bar represents mean. d, Identity of nearest vessel for each HSPC (n=16 cells) and MFG-HSC (n=18 cells). e, Graph of in vivo oxygen measurements around individual HSPCs (N=2 mice, 7 cells) and MFG-HSCs (N=2 mice, 15 cells). P values were calculated using two-tailed unpaired T tests. Red bar represents mean.
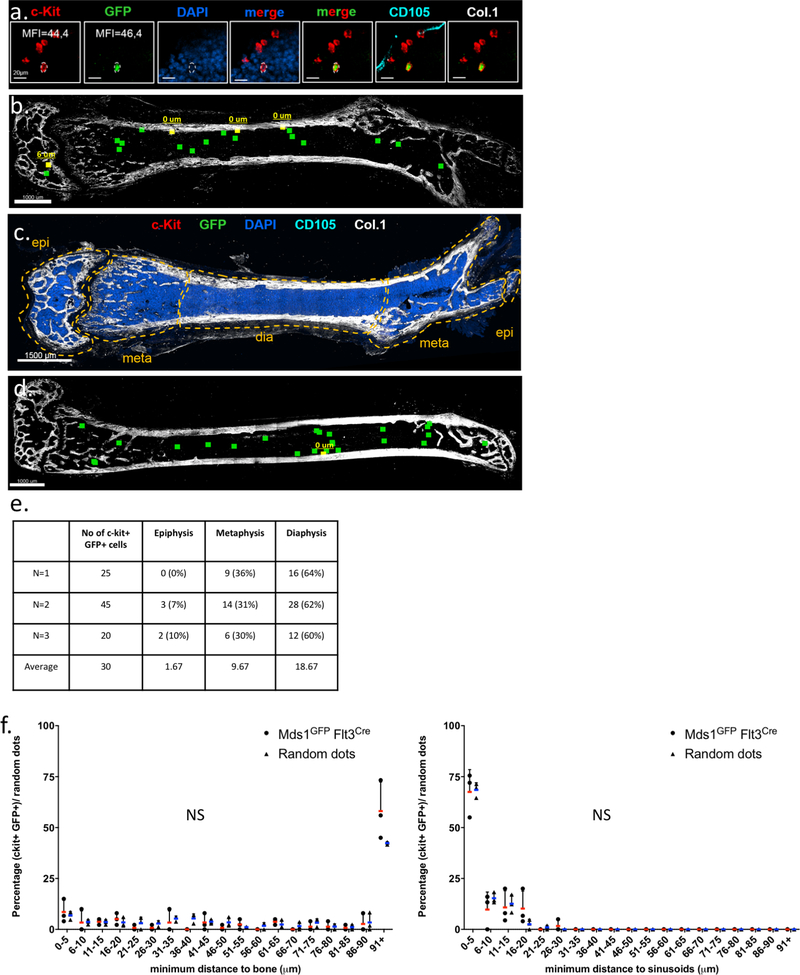
Given the known developmental and structural differences between flat and long bones23, we also imaged femurs using a recently described quantitative deep-imaging protocol24. We identified a very small number of GFP+ c-Kit+ HSCs in 250 μm thick, whole-bone femoral sections of MFG mice (Extended data figure 5a–e). Approximately 70% of MFG HSCs are located within 5 μm from sinusoidal CD105-expressing cells, but are not statistically significant in comparison to random dots (Extended data figure 5f). In addition, MFG-HSCs did not significantly differ from random spots in their distance to the endosteum, (~12% were within 10 μm while >50% were more than 50 μm away, Extended data figure 5b, d, f), underscoring the difference between the calvarium and the long bone, particularly the diaphysis.
MFG-HSCs are found in similar hypoxic environments as MPPs
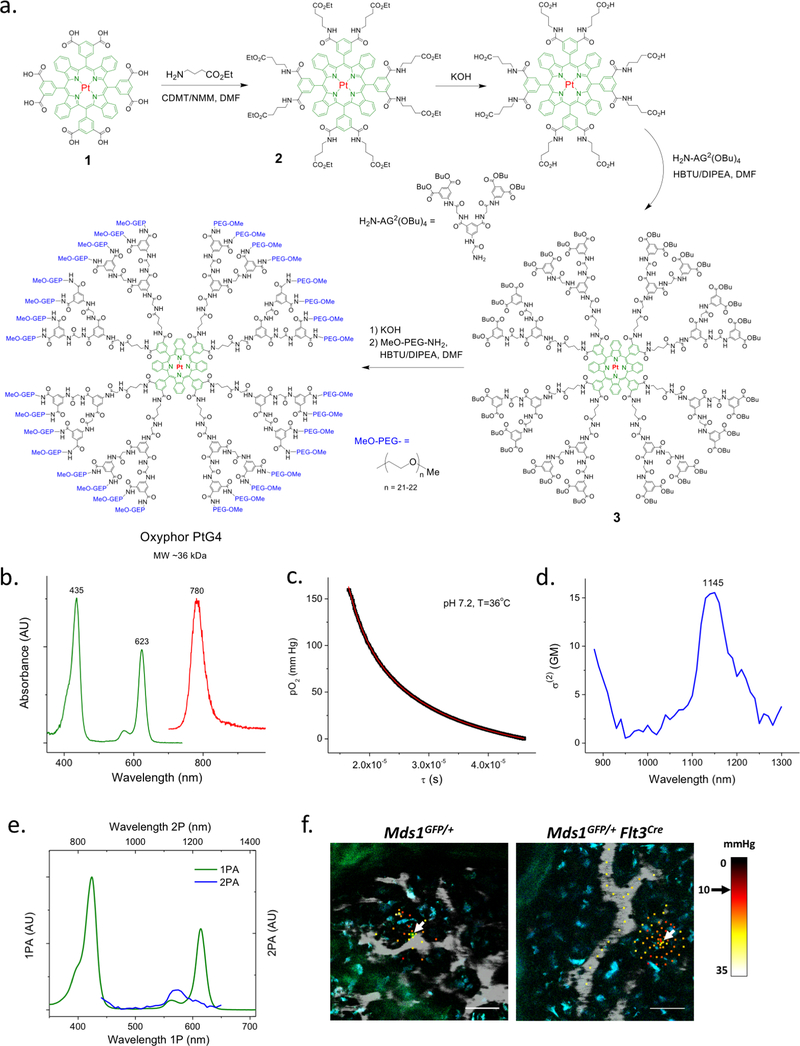
Low oxygen tension (hypoxia) has been historically thought to be a shared niche characteristic that is critical for maintaining stem cell quiescence25. However, support for the existence of a hypoxic niche has largely come from indirect evidence and measurements lacking spatial resolution26. Using a novel oxygen sensor and two-photon phosphorescence lifetime microscopy27, we measured the local pO2 surrounding individual HSPCs and MFG-HSCs in their native microenvironment (Extended data figure 6a–f). First, we confirmed the overall hypoxic status of the calvarial BM27, with intravascular pO2 in the range of 15–30 mmHg (mean ~23 mmHg, about 3% O2) and extravascular pO2 in the range of 10–25 mmHg (mean ~17 mmHg, about 2% O2) (Figure 2e). We then measured pO2 around individual HSPCs and MFG-HSCs, and found, surprisingly, similar oxygen levels (~18 and ~19 mmHg) as the average extravascular pO2 in the BM (Figure 2e). Thus, while we detected regions in the BM with pO2 as low as 10 mmHg, the HSPCs and MFG-HSCs were not found in these regions, suggesting that localization to regions of deepest hypoxia is not a prerequisite for maintenance of MFG-HSC quiescence.
Heterogeneous response following activation of LT-HSCs
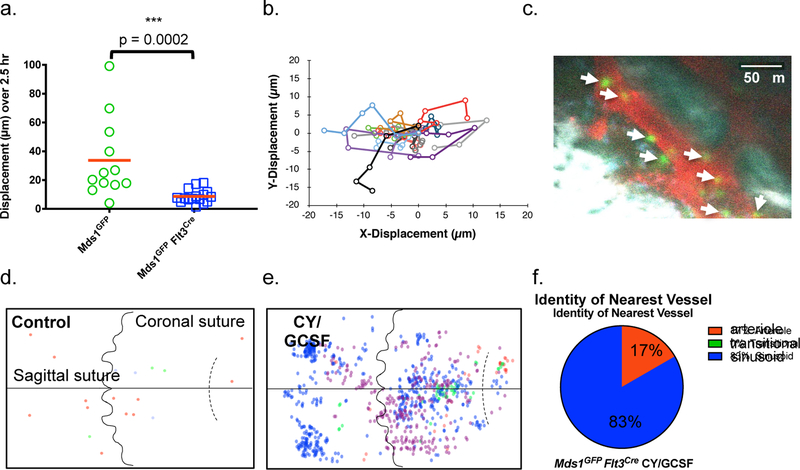
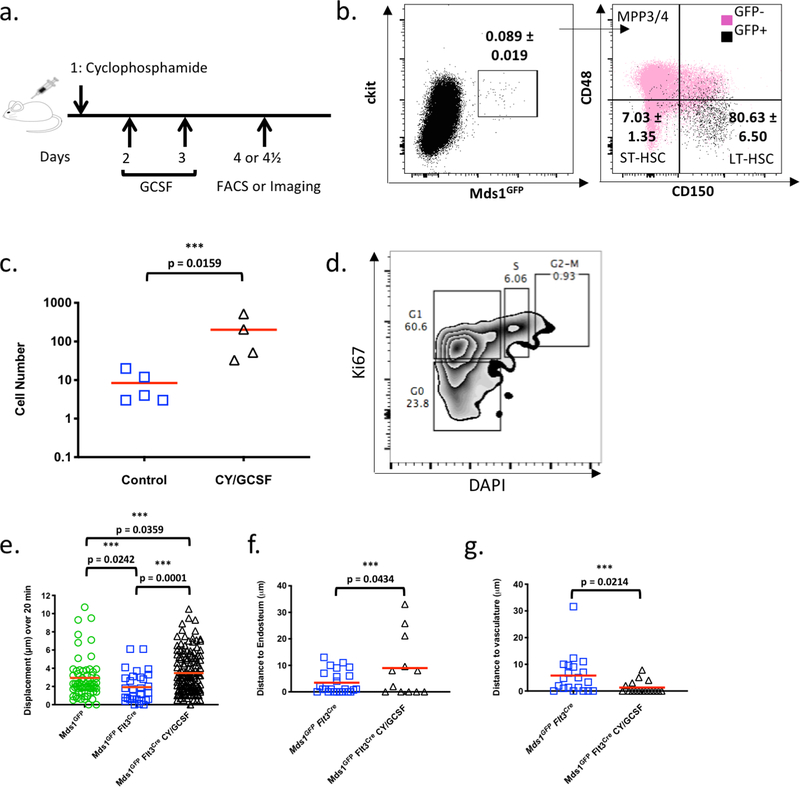
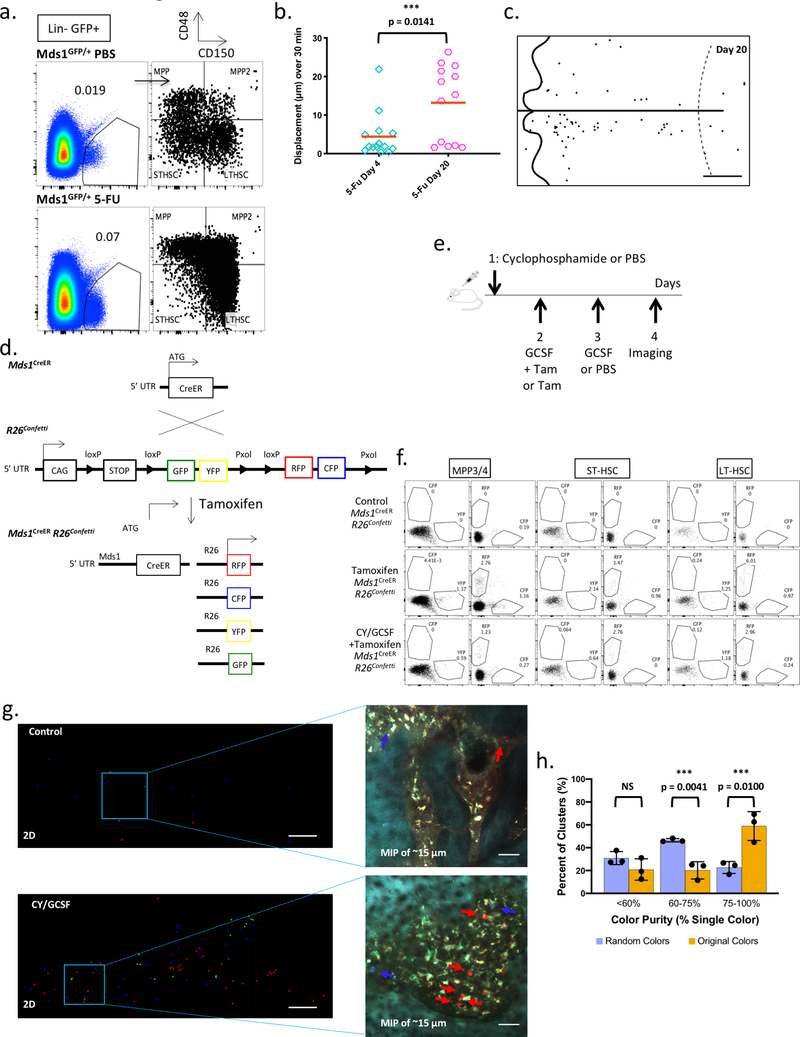
We next examined the dynamic behaviors of HSPCs and LT-HSCs in their native niche. In vivo time-lapse imaging of the calvarium revealed that MFG-HSCs displayed low baseline motility while HSPCs showed enhanced motility (Figure 3a, b and Videos 3–6). To assess whether HSC behaviors would be affected in the context of activation, we used a cyclophosphamide/G-CSF protocol that leads to LT-HSCs expansion and subsequent mobilization28 (Extended data figure 7a). FACS and imaging analysis demonstrated a 10-fold increase in the number of MFG+ cells post-treatment (Figure 3 c–e, video 7, and Extended data figure 7b, c). Importantly, MFG+ cells are equally enriched in the phenotypical LT-HSC fraction in this activated state (Extended data figure 7b) and display a concomitant increase in cell cycle activity (Extended data figure 7d). Time-lapse imaging of treated animals for ~6 hrs after the third G-CSF dose (Figure 3c and Videos 8) showed that, on average, MFG-HSCs became significantly more motile, with displacement measurements even higher than steady-state HSPCs (Extended data figure 7e and Video 8) but the response was heterogeneous, ranging from cells displaying limited displacement to a small number of cells that fully exited the BM into the blood stream (Video 8 and Extended data table 1). Similarly, following treatment with the myeloablative agent 5-Fluorouracil (5FU), we observed larger numbers of MFG+ cells (Extended data 8a and Videos 9, 11) and a subset exhibiting higher motility, particulary at day 20 following (Extended data figure 8b and Videos 10, 12), suggesting that enhanced motility is a common feature of the HSC response to injury, although we cannot rule out that the response is a result of indirect action on the niche by Cy/G-CSF or 5-FU.
Figure 3. Increased motility, expansion, and localization of activated MFG-HSC s.
a, In vivo motility measurements of HSPCs (n=12 cells) and MFG-HSCs (n=16 cells) at steady-state over a 2.5 hr imaging period. Red bars indicate the mean. P value was calculated using a two-tailed Mann-Whitney test. b, Cell tracks for 16 MFG-HSCs over a 2.5 hr imaging period. Images were acquired every 30 minutes. c, Representative intravital image of a Cy/GCSF treated MFG mouse 4.5 days after the beginning of treatment. MFG cells (green), vasculature (red, Angiosense 680EX), auto-fluorescence (blue), and bone (white, second harmonic generation). Scale bar ~50 μm. Arrows point at GFP cells. The experiment was performed four times with similar results. d, e, Graphical map of the location of MFG-HSCs in the calvaria of untreated and Cy/GCSF treated mice (N=3 and 4, respectively). Location data from individual mice are indicated by different colors. f, Identity of nearest vessel for each MFG+ cell (n=12 cells) after treatment with Cy/ GCSF. Compare to untreated mice in Figure 2d.
Activated MFG-HSCs were found, on average, to be further away from the endosteum compared to native MFG-HSCs (Extended data figure 7f). Interestingly, they are found even closer to the vasculature, with an average distance of ~1 μm (Extended data figure 7g), and importantly, maintain their sinusoidal proximity (Figure 3f). By assessing the distribution of activated MFG HSCs in the entire calvarial region, unique patterns of HSC proliferation emerge. First, native MFG-HSCs are found as rare single cells within the BM, while activated MFG-HSCs appear as clusters (Figure 3c, d, e), suggesting that that MFG-HSC proliferation occurs within spatially restricted domains. Second, a subset of MFG+ cells remained as single cells while others form clusters in both the Cy/GCSF and 5FU models (Figure 3e and Extended data figure 8c), suggesting that the proliferative response is heterogeneous among HSCs. To assess if these clusters are clonal, we generated Mds1CreER/+ Rosa26Confetti/+mice29 (Extended data figure 8d, e, f). Imaging of untreated mice revealed that labeled cells are usually found as rare single cells of different colors dispersed throughout the BM (Extended data figure 8g). Following Cy/GCSF treatment, we observed labeled cell clusters made up predominantly of cells of a single color (Extended data figure 8g, h). Quantitative analysis confirmed the increased likelihood of labeled nearby cells to be of the same color (Extended data figure 8h), providing support for clonal HSPC proliferation within confined physical domains.
Marrow cavities with bone remodeling activity correlate with HSC expansion
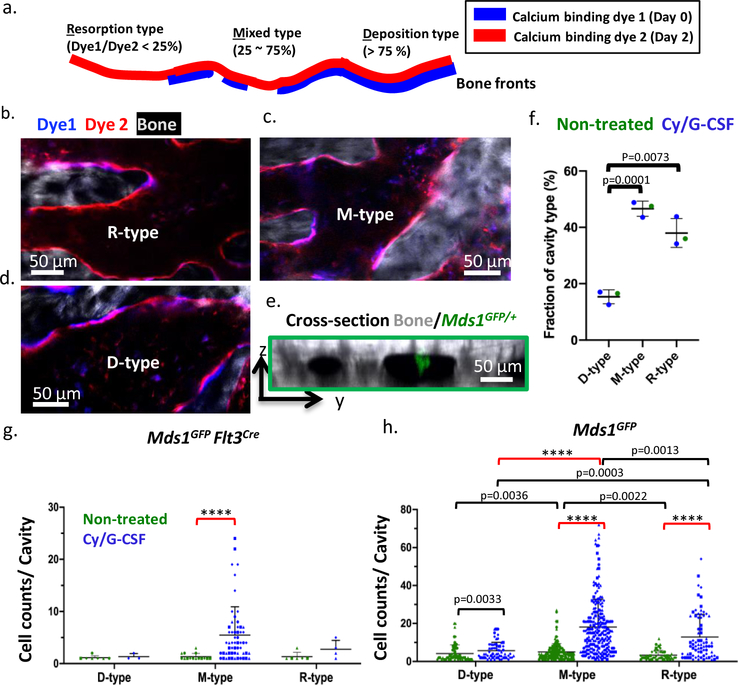
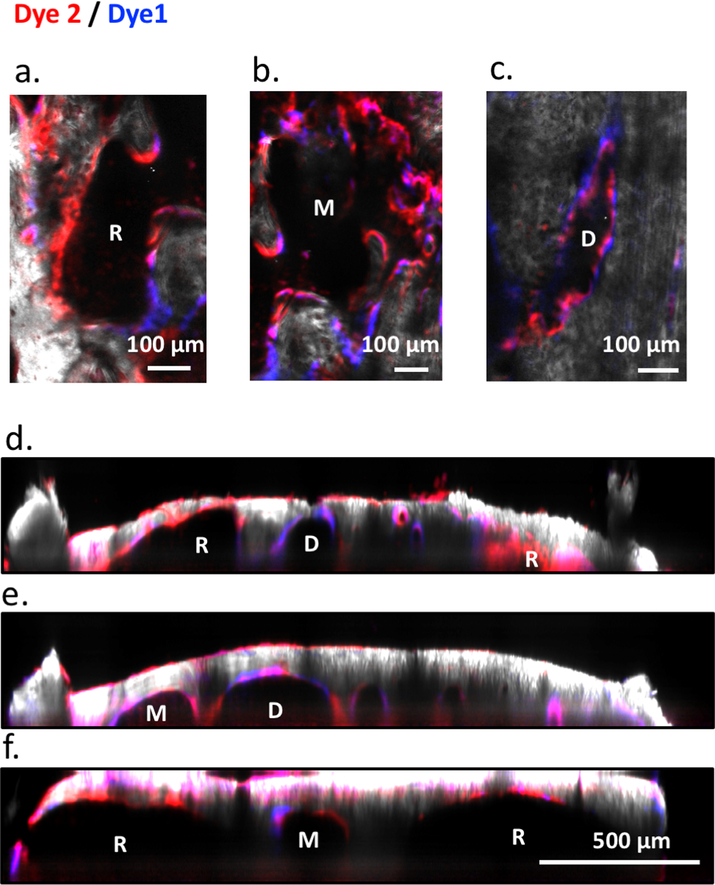
The observation of heterogeneous HSC proliferation in restricted physical domains prompted us to re-examine the characteristics of the microenvironment that either support clonal expansion or maintain cell quiescence. Recognizing that the bone is constantly undergoing remodeling, we hypothesized that the stages of bone turnover impose an additional degree of heterogeneity in the BM microenvironment not captured by the prevailing view centered on the endosteal vs. perivascular duality. To visualize the stages of bone turnover, we administered two (spectrally distinct) calcium binding dyes30 48 hours apart, and imaged the calvarium immediately after the second dye injection. The two dyes mark the positions of the old and new bone fronts, respectively, and reveal where the old bone front has been eroded (Figure 4a). We quantify the ratio of the two dyes and classify the cavities as D-type (undergoing predominantly bone deposition), R-type (predominantly bone resorption), and M-type (mixed). We confirmed that osteoblasts are biased toward D-type cavities while osteoclasts are biased toward R-type cavities. A mixture of osteoblasts and osteoclasts are found at intermediate levels in M-type cavities (Extended data figures 9a–g). Using this double-staining scheme (Figures 4b–e), we quantified the fraction of D-, M-, R- cavities in the calvaria (Fig 4f), as well as the spatial distribution of native MFG-HSCs and HSPCs. During steady state, MFG-HSCs are found in baseline numbers in all cavity types, while the HSPCs tend to be enriched in M-type cavities (Figures 4g, h). Remarkably, after activation with Cy/GCSF, expanded MFG cells are found almost exclusively in a subset of M-type cavities (Figure 4g, Video 13, and Extended data figure 10a). Although less pronounced, HSPCs are also found to expand preferentially in M-type cavities after activation (Figure 4h, Video 14 and Extended data figure 10b). Evidence of heterogeneity in the BM cavity types, and of a subset of M-type cavities favoring HSC expansion, lends support to the earlier observation that HSCs clonally expand in restricted physical domains.
Figure 4. Heterogeneity of bone remodelling stages governs proliferation of MFG-HSCs (Mds1GFP/+ Flt3Cre mice) and HSPCs (Mds1GFP/+ mice).
a, The double calcium staining strategy that identifies D, M, and R- type cavities. Dye 1, delivered 48 hours before imaging, shows the old bone front that has been eroded to varying extent, while Dye 2 delivered before imaging shows the new bone front. b-d, zoomed in regions, showing distinct cavity types defined by the Dye1 to Dye2 pixel ratios. e, A sagittal section of bone marrow cavities containing Mds1GFP/+ cells. f, Fractions of D, M, R-type cavities in the calvaria of non-treated or treated mice (two-tailed t-test, n=155 cavities from non-treated and 80, 73 bone marrow cavities from treated animals (N=3 mice), black line represents mean, error bars represent SD). g, Quantification of MFG-HSCs in D-, M-, or R-type cavities at steady-state and after Cy/G-CSF activation. N=4 mice per group, plotted as different symbols. Black line represents mean, error bars represent SD. h, Quantification of HSPCs in D-, M-, or R-type cavities at steady-state and after Cy/G-CSF activation. N=4 mice per group, plotted as different symbols. Two-sided Mann-Whitney test was used in all graphs unless otherwise specified, ****p<0.0001. Black line represents mean, error bars represent SD.
Discussion
Our work here describes the generation and characterization of a novel animal model where a single-color reporter can be used for the identification of LT-HSCs and their live imaging in the native niche without transplantation (Extended data table 2). We found new evidence of heterogeneity in both the HSC response to injury and the BM microenvironment, coupled to the stages of bone remodeling, that has not been recognized previously3,27,31. Notably, distinct cavity types are also observed in the metaphysis of lone bones (Extended data figures 11 a–f and Video 15). The existence of distinct BM cavity types implies that the traditional way of characterizing the HSC niche as endosteal or perivascular is inadequate, as the microenvironment, including the perivascular niches, contained within these cavities are likely to be different, subject to local calcium gradient32 and downstream effects of osteoclast degradation33. Development of molecular profiling technology34 capable of spatially mapping distinct bone cavities will be needed to fully characterize the regulatory factors that govern HSC quiescence versus proliferation.
METHODS
Mice and genotyping
The targeting construct of Mds1GFP/+ mice was generated by cloning and homologous recombination of the linearized targeting vector via electroporation into v6.5 ES cells. Upon selection using neomycin and clonal screening using PCR, correctly targeted ES cell clones were injected into C57Bl/6 blastocysts. Derived chimeras were initially bred to C57Bl/6 to obtain germline transmission, followed by crossing with FLPe mice35 to remove the Frt-Neo-Frt cassette that was part of the original targeting vector. Derived mice were backcrossed onto a C57Bl/6 background for >6 generations and mice were analyzed via PCR to identify their genotype (‘5- AGAGTGAAAGACCGAGTGTGTG-3’, ‘5- GTACAGGGTAGGCTGCTCAACT-3’, ‘5- CTCCCTCCCAGCTTTTTGCT-3’). Some of the displayed data comes from animals that still carried the Frt-Neo-Frt cassette which showed slightly lower mean fluorescence intensity in BM cells. A similar strategy was used to generate Mds1CreER. For all experiments 2–12 months adult mice of both sexes were used while wild type littermates were used as controls. Flt3Cre mice14,15, Rosa26-CAG-loxp-stop-loxp-tdTomato reporter mice36 and Rosa26-CAG-loxp-stop-loxp-Confetti reporter mice29 were previously described. For identification of Flt3Cre and Mds1CreER, Cre primers were used (‘5-TTACTGACCGTACACCAAAATTTGCC-3’, ‘5- CCTGGCAGCGATCGCTATTTTCCATG-3’). Mice were bred and housed according to NIH guidelines in our AAALAC-accredited, specific-pathogen-free animal care facilities at Boston Children’s Hospital or Massachusetts General Hospital. 2.3Col1-GFP mice37 were generously provided by Dr. Jayaraj Rajagopal (Massachusetts General Hospital). All animal protocols were approved by the Animal Resources at Children’s Hospital Boston, Boston Children’s Hospital Institutional Animal Care and Use Committee, and Massachusetts General Hospital Institutional Animal Care and Use Committee.
HSC isolation, flow cytometry and cell sorting
BM cells were isolated by crushing of the bones using a mortar and pestle in Ca2+ and Mg2+ free phosphate-buffered saline (D-PBS) supplemented with 2% fetal bovine serum (FBS) and 1X penicillin/streptomycin (Pen/Strp) (Invitrogen). Viable cell number was calculated by manually counting with a hemocytometer or using a TC20 Automated Cell Counter (Bio-Rad). The cell suspension was filtered through a 70 μm strainer. For HSC identification via flow cytometry, the cells were stained for c-kit (eBioscience), Sca-1 (eBioscience, BioLegend), CD48 (BD Pharmingen) and CD150 (BioLegend) as well as a lineage marker cocktail consisted of B220, Ter-119, Gr-1, CD4 and CD8α (eBioscience). For experiments requiring lineage depletion, antibody staining for B220, Ter119, Gr-1, CD4, CD8α biotin conjugated antibodies was first performed followed by anti-biotin beads (Miltenyi Biotec) and depletion using magnetic separation columns (Miltenyi Biotec). For megakaryocyte progenitor staining the cells were stained for Lineage marker cocktail, c-kit, Sca-1, CD150, CD41 (BioLegend) and FcγR (eBioscience). For CMP/GMP/MEP identification cells were stained for Lineage marker cocktail, c-kit, Sca-1, CD34 (eBioscience) and FcγR. For mesenchymal stem cells, cell suspension was stained for the lineage cocktail, CD45, PDGFRα and Integrin-αV (eBioscience). For endothelial cells, lineage cocktail, CD45, CD31 and VE-Cadherin (eBioscience) were used. For pre/pro B, immature and mature B cell identification B220 and IgM (eBioscience) were used. For erythroid cells Ter-119 (eBioscience) was the primary marker, for monocytes and neutrophils Mac-1 (eBioscience) and Ly6-G (BD Pharmingen) were used while for T cells CD4 and CD8 were used. Antibody staining of cell suspension was always performed on ice for 45min. 4’,6-diamidino-2-phenylindole (DAPI, 10 μg / ml in PBS, Invitrogen) was used for exclusion of dead cells during flow cytometry. Relevant flow cytometry gating strategies for the identification of different mature cell populations, LT-HSC / MPP1 / MPP2 / MPP3/4 and endothelial cells are available in the supplementary file. Transplanted cells were double sorted to increase purity. For low cell number transplantations, all secondary sorts were performed in a plate using the automated plate reader sorting function. For FACS analysis BD LSRII Flow Cytometer was used while cell sorting was performed using a BD FACSAria II sorter (BD Biosciences). Flow cytometry data were analyzed with FlowJo (Tree Star).
Cell cycle analysis
As each animal only contains an average of 600–700 GFP+ sorted cells, the cell cycle analysis demonstrated in Figure 1c and extended data figure 3g represent GFP cells isolated from 7 Mds1GFP/+ Flt3Cre mice, thus the data represent an average from 7 mice that were pooled together. Upon identification and sorting purification of corresponding cellular populations as described above, cells were fixed in ice cold 70% ethanol. Cells were then washed and stained with Ki67 (BioLegend) for distinction of G0/G1 phase for 30 min on ice. DAPI was finally used for staining and analysis of G1/G2-M/S phase. Cell cycle analysis was performed using BD FACSAria II sorter.
Competitive reconstitution assays in irradiated mice and peripheral blood analysis
8–12-week-old B6.SJL-PtprcaPepcb/BoyJ (CD45.1) were used as BM transplant recipients. Prior transplantation mice were lethally irradiated using a gamma irradiator with a split dose of 11 Gy with 3 hr interval time between the two doses. Cells were transplanted via retro-orbital injection in anesthetized mice. 100,000 whole BM CD45.1 cells were used as competitors unless stated otherwise. For limiting dilution studies, HSC frequency was calculated using Extreme Limiting Dilution Analysis software (http://bioinf.wehi.edu.au/software/elda/ )38 with data at 4 months post transplant. The lower stem cell frequency reported here might be due to the incomplete backcrossing of MFG mice (6 generations), presence of constitutive CRE in hematopoietic cells and/or technical reasons. For secondary transplants, 2 million whole BM cells from primary recipients were transplanted in lethally-irradiated secondary recipients. For blood analysis of transplanted recipients, blood was collected at 4-week intervals at least for 16 weeks after transplantation. Peripheral blood was first treated with red blood cell lysis buffer to remove red blood cells followed by antibody staining for B cells (CD19, eBioscience), T cells (CD4, CD8α) and granulocytes (Ly6-G). The percentage chimerism was estimated using CD45.1 (BioLegend) and CD45.2 (eBioscience) antibody staining.
Blood cell counts, 5-fluorouracil, cyclophosphamide / GCSF and tamoxifen treatments
Blood samples were collected via the retro-orbital vein in EDTA coated tubes. Blood cell counts were performed using HEMAVET®950 (Drew Scientific) cell blood counter. For blood cell kinetic analysis upon 5-fluorouracil treatment, cell counts were performed on day 0, 3, 7, 10, 13 and 17. 5-fluorouracil was delivered via retro-orbital injection as single dose of 150 mg/kg immediately after day 0 bleeding sample was collected while control mice were injected with PBS. In addition, BM of treated mice was analyzed using flow cytometry or imaging was performed at the indicated time points. For Cyclophosphamide / GCSF experiments cyclophosphamide was delivered via intraperitoneal injection as single dose of 200 mg/kg on day 1, followed by GCSF subcutaneous injection on day 2, 3, 4 at 250 μg/kg dose per day followed by BM flow cytometry analysis or live animal imaging of the calvarial BM. For Mds1CreER/+ Rosa26Confetti/+ mouse experiments cyclophosphamide or PBS were administrated on day 1 followed by GCSF and tamoxifen injection on day 2 and further GCSF or PBS administration on day 3 and 4 according to each experiment. Tamoxifen was administrated at 2 mg dose via intraperitoneal injection to target labeling to the LT-HSC compartment. BM analysis of femurs and calvaria was performed 24 hrs after final GCSF dose administration according to each experiment.
Single Cell inDrops RNA sequencing
GFP cells were sorted from Mds1GFP/+ Flt3Cre mice and single cells were encapsulated using droplet microfluidic technology as previously described17. While 1200 GFP+ cells were sorted only ~400 cells were encapsulated; loss of more than half of the population is quite standard for low cell number populations in the inDrop platform. Upon library preparation of barcoded single cells, RNA sequencing was performed. To process the data, we used a previously published workflow and code available on https://github.com/AllonKleinLab/SPRING. Ensembl release 81 mouse mm10 cDNA plus the sequence of loxP-IRES-GFP-polyA-loxP was used as reference. SPRING plots were generated using the next four-step process. Initially, the cells with few mRNA counts (< 1000 UMIs) and stressed cells (mitochondrial gene-set Z-score > 1) were filtered out. The remaining high-quality cells were total-counts normalized. We next filtered genes, keeping those that were well detected (mean expression > 0.05) and highly variable (CV > 2). Finally, the data were normalized by Z-scoring each gene and applying principal components analysis (PCA), retaining the top 50 PCs. Following filtration and bioinformatics analysis, only 50 GFP+ cells passed quality control and were used for plotting. These acquired data from the GFP cells were then plotted into previously published data for LSK cells18 upon transformation in the PCA space of the previously published data. Briefly, the two datasets were integrated using the library sklearn.decomposition.PCA (python 2.7). The fit function was used to calculate the first 50 principal components for the single cell LSK dataset18. Then, the normalized and filtered count matrices of the GFP and LSK were vertically combined. Before combining the two matrices, the GFP matrix was scaled in order to have a comparable amount of normalized counts in correlation to the LSK matrix. The resulting z-score combined matrix was used as input for the transform function to project the combined dataset on the original LSK dataset. The output generated by the transform function and the corresponding distance matrix that was obtained using the SPRING function get_distance_matrix, were used to generate the final SPRING plot. All data were visualized as previously described18. This reduced any batch effects between the two experiments. The coordinates generated by the SPRING plots were plotted using R.
Data availability
The GEO accession number for GFP cells is: GSE115908. The GEO accession number for LSK cells used for overlay was previously published (GSE90742)18.
Single cell fluidigm analysis
GFP cells were primarily sorted from Mds1GFP/+ Flt3Cre mice followed by secondary single cell sort directly in 96-well plates containing PCR buffer. Sorted plates were frozen on dry ice followed by reverse transcription, pre-amplification and high-throughput microfluidic real-time PCR for 180 transcription factors as previously described20. Data analysis and hierarchical clustering was performed using MultiExperiment Viewer (MeV) program. Previously published data for CMP, GMP, MEP, CLP, MPP and LT-HSC20 using the same 180 real-time PCR platform were overlaid for comparison to the GFP cells.
Synthesis and characterization of phosphorescent Oxyphor PtG4 probe
Oxyphor PtG4 has an almost identical structure to the previously published Oxyphor PdG4 probe39. The synthesis of the core porphyrin as well as the synthesis of a dendritic probe similar to Oxyphor PtG4, has been published previously40. All synthesis steps were identical to those developed for the synthesis of PdG440. MALDI-TOF was used to confirm the identity of the intermediate products and of the target probe molecule. Calibration, assessment of phosphorescence oxygen quenching and absorption spectra measurements for Oxyphor PtG4 probe were performed as previously described39,41.
In Vivo and Ex Vivo Imaging
All in vivo imaging experiments were performed according to procedures approved by the Institutional Animal Care and Use Committee at Massachusetts General Hospital. Briefly, mice were anesthetized with either an induction dose of 3–4% isoflurane (96% O2) and maintenance dose of 1.25–2% or were given an intraperitoneal bolus injection of Ketamine (100 mg/kg) and Xylazine (15 mg/kg). Animals were deemed anesthetized by the toe pinch method. To minimize pain, mice were treated with buprenorphine (0.05–0.1 mg/kg). The hair on the calvarium was removed with scissors or mechanical trimmer and then the skin was wiped with alcohol. Next, a calvarial skin flap was created by a U-shaped incision to reveal the underlying calvarial bone as previously described27. Mice were injected with imaging agents (e.g. vascular labels) retro-orbitally, mounted in a custom-designed heated mouse holder, and secured to the stage of a home-built multiphoton/confocal laser-scanning video-rate microscope (for z-stack or time-lapse imaging) or an Olympus FVMPE-RS multiphoton imaging platform (for oxygenation measurements)27. A drop of 0.9% saline was applied to the skull to act as the immersion fluid, and a Zeiss 63× 1.15 numerical aperture water-dipping objective, an Olympus 60× 1.0 numerical aperture water-dipping objective, or an Olympus 25× 1.05 numerical aperture water-dipping objective were used for all imaging. For endpoint imaging, mice were sacrificed while under anesthesia using approved procedures. For survival imaging, the skin flap was closed with 6–0 vinyl sutures (Ethicon). Triple antibiotic ointment (Bacitracin, Neomycin, and Polymyxin-B sulfate) was applied to the top of the surgical site to minimize the chance of infection. Mice were put in a heated cage and monitored until fully awake. For 6 hr imaging sessions, mice were given an intraperitoneal injection of ~100 μL of 0.90% saline solution every hour to ensure proper hydration.
GFP was excited at 491 nm (confocal) or 950 nm (two-photon) and collected between ~505–540 using a photomultiplier tube. Angiosense 680EX (~100 μL at 2 nmol/100 μL, Perkin-Elmer) for labeling vasculature was excited at 635 nm (confocal only) and collected between ~665–725 using a photomultiplier tube. Autofluorescence generated from the 491 nm or 950 nm excitations was collected between ~570–610 nm using a photomultiplier tube. Second Harmonic Generation (SHG) from collagen in the bone was excited at 775 nm or 840 nm (two-photon only) and collected between ~340–460 nm with a photo-multiplier tube. Phosphorescence was excited at 1150 nm by a Ti:Sa femtosecond laser (Insight, Spectra-Physics) and collected above 750 nm with a photomultiplier tube. For calcium staining of endosteal bone fronts, Calcein blue (30mg/Kg), Tetracycline (35mg/Kg, Sigma), and Alizarin Red S (40mg/Kg), were excited at 775 nm and collected between 415–455 nm, 500–550 nm, and 580–650 nm, respectively. Rhodamine B dextran 70 kDa (0.5 mg/50 μL, Sigma) was used as vascular contrast with Cat K 680 FAST (2 nmol/100 μL injected 6 hours before imaging, Perkin-Elmer) for labeling osteoclasts, excited simultaneously at 532 nm and 638 nm and collected between 570–620 nm and 665–745 nm.
For steady-state in vivo imaging, 15–60 frames from the live video mode were averaged to acquire single 500 × 500 pixel images. Z-stacks were acquired with 1–2 μm steps and time-lapse images were acquired in 30 second intervals for 20 min or longer. For Cy/GCSF in vivo imaging, z-stacks were acquired with 2 μm steps every 20 minutes for ~6 hours. Calvarial cell location maps in Figures 3d,e were created in Matlab using custom code based on the x,y,z coordinates of each cell. Data from each mouse was aligned and then overlayed based on the location of the coronal and sagittal sutures.
For pO2 measurements, ~75 μL of 1.7 mM Pt-G4 suspended in 0.9% PBS (1X PBS, Invitrogen) was intravenously injected prior to imaging. In each pO2 measurement location, multiple pulse excitation/emisision cycles were used to record the phophorescence lifetime decay. For each cycle, the probe was excited for ~10–20 μs followed by ~150 μs for time-resolved photon collection. Quantitative pO2 values were obtained by fitting the phosphorescence decay with a single exponential to get an average lifetime of phosphorescence. This lifetime value was converted to pO2 using an in vitro calibration curve for the same batch of Pt-G4.
For 5FU imaging experiments, 5FU was delivered via retro-orbital injection as single dose of 150 mg/kg as described above. In vivo BM two-photon imaging was then performed on Day 4 or Day 20 after the 5FU injection. The calvarial cell location map in Extended data figure 8c was made in similar way to the Cy/GCSF cell maps described above.
For Cyclophosphamide/GCSF ex vivo imaging, freshly fixed (4% paraformaldehyde) and excised mouse calvaria were affixed to a plastic dish, immersed in 1X PBS, and immediately imaged for 4–5 hours. Tiled z-stacks were acquired with 3 μm steps and 10% overlap between fields of view. Images were stitched together in three dimensions using Olympus FluoView software or ImageJ scripts.
For examining bone remodeling activities in calvaria (in vivo) and metaphysis (ex vivo), calcium binding dyes were administered 48-hour apart via retro-orbital injection. Calvarial in vivo imaging were performed as described. Mouse tibia was freshly harvested, thinned, and imaged from the bone surface. Tiled z-stacks were acquired with 3 μm steps and stitched using ImageJ.
Image quantification
For distance measurements, the distance of each cell to blood vessels or to the nearest bone surface (i.e. endosteum identified based on SHG) was computed by hand as described previously using the Pythagorean theorem27,42. The bone contains an abundant amount of collagen which enables us to use SHG imaging to identify the inner bone surface (endosteum). We and others have successfully used this technique in many previous manuscripts of live BM imaging3,27,43,44.
The identity of blood vessels (whether arterioles, sinusoids, or transition vessels) within the calvaria were determined by a combination of morphology, location within the vessel network, location within the BM, and blood flow. Briefly, with our blood pool agent the arterioles appear as narrow (~5–10 μm diameter) and generally straight vessels with a smooth surface upstream of sinusoidal vessels, which are larger (~20 μm diameter or greater) with irregular surfaces. This definition was based on our previous work27,44, which confirmed that these small diameter vessels are arterioles with a faster flow speed (~2 mm/s or higher), higher pO2, and increased barrier function in comparison to sinusoidal vessels. They also stain positive for Sca1. At the transition point between arterioles and sinusoids, the vessel diameter increases. It is from this point of increase until the next vessel branching point downstream that we define as transitional vessels.
Distance measurements were performed in ImageJ v.1.51p. For display purposes, the brightness and contrast of images in the figures were adjusted, but all image analysis was performed on raw data. For motility measurements, frame-to-frame drift was corrected in three dimensions using the Template Matching plugin in ImageJ. Next, the centroid of the cell was determined for the first and last image of a 20-minute sequence, and the two-dimensional displacement was calculated using the distance formula.
For cell clustering analysis, the individual tiled z-stack images were reconstructed into a single z-stack for the whole calvaria using ImageJ. Next, each cell was designated as one of three tags (red, green, or blue) based on the color of the cell during imaging, and the x, y, z coordinate was recorded by hand. Using a custom Matlab script similar to ClusterQuant45, we analyzed the spatial clustering (cluster size = 3) of like-colored cells in this model compared to 10,000 randomized samples to determine the statistical likelihood of the color clustering in our samples.
Graphs and statistical analyses were performed using Graph Pad Prism version 6 or higher.
The contrast and/or brightness of figure images and videos were adjusted for display purposes only.
Classification for types of BM cavities
A bone marrow cavity is defined as a 3D inclusion inside bone with a single concave endosteum (Figure 4e, extended data Figures 11d–f), while deeper down all cavities are interconnected. Once a cavity is defined using the bone SHG signal, we then proceed to classify types of BM cavities based on sequential staining of two calcium binding reagents. The first calcium binding dye (Dye1, Tetracycline or Calcein blue, Sigma, at the dose of 35mg/Kg and 30mg/Kg, respectively) was administered 48 hours before imaging to track bone resorption activities based on erosion of Dye1, and the second calcium binding dye (Dye2, Alizarin Red, 40mg/Kg) was administered 30 min before imaging to label high calcium regions, the bone fronts. The 48-hour interval was chosen based on the estimated lifespan of murine active osteoclasts46,47. Therefore, the double staining approach delineated approximately one bone erosion cycle occurred in the BM. As the lack of the Dye1 indicates existence of resorption while strong double staining of both dyes indicates ongoing bone deposition, the dye1/dye2 ratio contained within a single concave endosteum depicts the status of bone remodeling during the 48-hour period. For each cavity, the acquired depth covered the Dye1 and Dye2 labeled regions, typically between 80 to 120 μm beneath endosteum. For quantification of osteoblast or osteoclasts coverage (2.3Col1GFP or Cathepsin K pixels) along endosteum, z-stack double staining, Col1, and Cathepsin K images of 2 μm z-steps were rendered in 2D using maximum intensity projection in ImageJ and then analyzed (Extended data figure 9). As Cathepsin K is also expressed significantly by endothelial cells, a vascular map (Rhodamine B dextran) was acquired simultaneously and subtracted from the Cathepsin K map before retrieving the total pixel counts. For quantifying fractions of cavity types, 3D maps of calvaria were acquired and rendered in 2D using maximum intensity projection then analyzed (Figure 4f). For quantification of cavity types for figures 4g–h, total pixels of Dye1 and Dye2 were retrieved directly from the 3D stacks. Segmentation of Dye1 and Dye2 in each stack was obtained using ImageJ macros combining multiple built-in plugins. Specifically, contrast enhancement was applied consistently (0.1% saturation) for each stack. The images were smoothed using 3D image J suite plugins48 (3D mean filter, kernel size = 1) followed by background subtraction using the rolling ball algorithm with the radius size of 100 and 250 for Dye1 and Dye2, respectively. This background subtraction step removed diffuse signals from bone autofluorescence that is more prominent in blue and green channels (Dye1) but still distinct from structured patterns of bone front staining. Segmentation was then performed using ImageJ built-in global or local thresholding algorithms to render matching binary results compared to raw stacks. The total pixel number of Dye1 and Dye2 were then obtained from the binary images to calculate Dye1 to Dye2 ratio.
For classification purposes, we defined bone cavities as (i) deposition type (D-type), Dye1/Dye2 > 75% (ii) resorption type (R-type), Dye1/Dye2 < 25%, and (iii) mixed type (M-type), Dye1/Dye2 between 25 to 75%. Such definitions emphasize on functional perspectives of bone remodeling along endosteum (dominated by bone deposition or resorption), instead of the presence of osteoblasts or osteoclasts at the time of imaging. This is especially important given that osteoclasts went through apoptosis after each resorption cycle and may not be present at the time of imaging. Of note, bone-lining cells have been reported to occupy the bone fronts of inactive regions that lack both mature osteoblasts and calcium staining49. In the calvarium, as neither MDS-HSPCs nor MFG-HSCs were found in fully inactive regions, we only characterized cell distribution in D, M, and R cavities where small patches of inactive areas may be present but does not alter the distribution of the three cavity types. To quantify the number of cells per BM cavity (Figures 4g,h), Mds1GFP/+ Flt3Cre and Mds1GFP/+ cells were manually counted. A cell is considered belonging to a cavity if it is underneath a concave dome; there is no restriction on its distance to the endosteal surface.
Bone clearing and imaging of femurs
Tissue preparation, multicolor full-bone imaging of thick femoral sections and quantitative analysis were performed as previously described24. Briefly, bones were fixed for 18h in 4% paraformaldehyde before being decalcified using 10% ethylenediaminetetraacetic acid (EDTA, pH=8) for two weeks. 250um-thick longitudinal bone sections were blocked, permeabilized (followed by additional blocking of endogenous avidins and biotins) and stained overnight at RT with primary [anti-GFP (chicken, Aves Labs, GFP-1020), anti-CD117 (goat, R&D, AF1356), anti-CD105 (rat, eBioscience, 14–1051-82) and anti-collagen type I (rabbit, Cedarlane, CL50151AP)], secondary antibodies (Alexa Fluor 555, 680, and CF633) and DAPI (Thermo Fischer Scientific, D1306). GFP signal was amplified using donkey anti-chicken biotin (Jackson Immunoresearch, 703–065-155) followed by streptavidin Alexa 488 (Thermo Fischer Scientific, S32354). Full-bone scans were performed on Leica TCS SP8 confocal microscope equipped with three photomultiplier tubes and two HyD detectors using type F immersion liquid (RI: 1.518) and 20X multiple immersion lens (NA 0.75, FWD 0.680 mm). Images were acquired at 8-bit, 400 Hz and 1024×1024 resolution with 2.49 μm z-spacing. Segmentation and distance quantification analysis was performed with Imaris (version 8.3.1), using the XT and Distance Transformation XTension modules. To avoid data truncation, data were transformed to 16-bit prior to distance quantification and then reverted back to 8-bit. Random dots were generated via a Matlab-based, self-developed software (XiT) as previously described24. Graphs and statistical analyses were performed using Graph Pad Prism version 6.
Extended Data
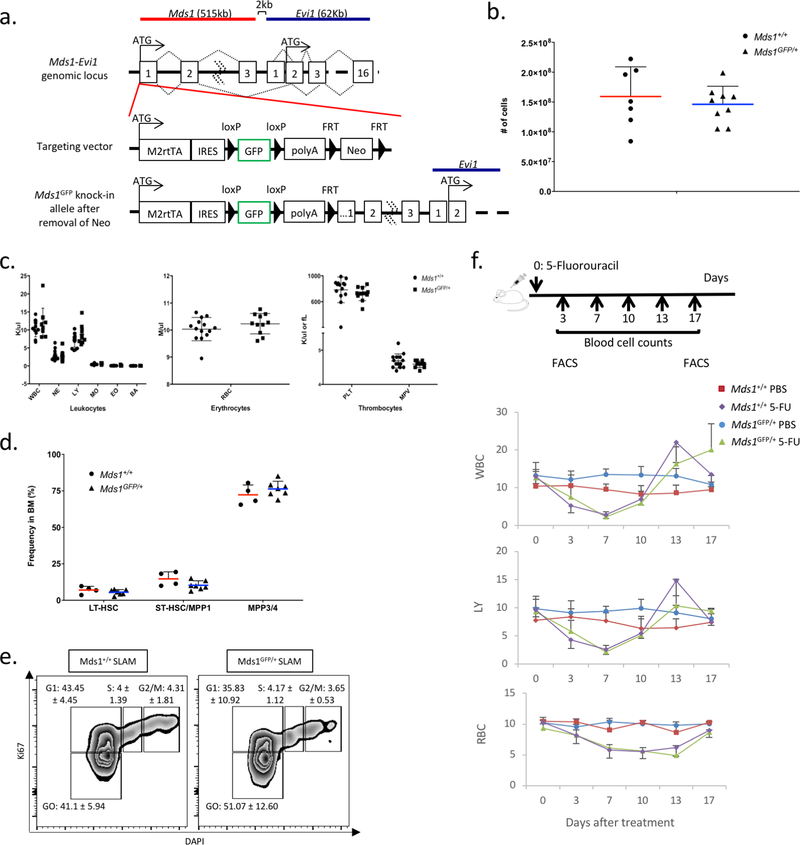
Extended Data Figure 1. Characterization of HSPC (Mds1GFP/+) mice demonstrates normal hematopoiesis, HSC frequency, cell cycle and stimuli recovery response.
a, Targeting strategy for the generation of Mds1GFP//+ mice. b, 8–12 week old Mds1GFP/+ mice (triangles, N=9 mice) displayed similar bone marrow cellularity as control mice (Mds1+/+) (circles, N=7 mice). Middle line represents mean. Error bars demonstrate SD. c, 8–12 week old Mds1GFP/+ mice (N=14 mice) displayed similar peripheral blood parameters as Mds1+/+ control mice (N=11 mice). Middle line demonstrates mean. Error bars demonstrate SD. d, 8–12 week old Mds1GFP/+ mice (triangles, N=7 mice) displayed similar CD150+CD48-LSK (LT-HSC), CD150-CD48-LSK (ST-HSC) and CD150-CD48+LSK (MPP) frequencies as control (circles, Mds1+/+) mice (N=4 mice). Middle line represents mean. Error bars demonstrate SD. e, Cell cycle analysis of SLAM cells from Mds1GFP/+ (N=3 mice) and wild type (Mds1+/+) mice (N=2 mice) in native conditions. Indicated value per gate represents mean ± standard deviation. f, Dynamics of white blood cells (WBC), lymphocytes (LY) and red blood cells (RBC) recovery upon 5-fluorouracil treatment in Mds1GFP/+ and control (Mds1+/+) mice. Middle value represents mean. Error bars represent standard deviation. N=4 mice.
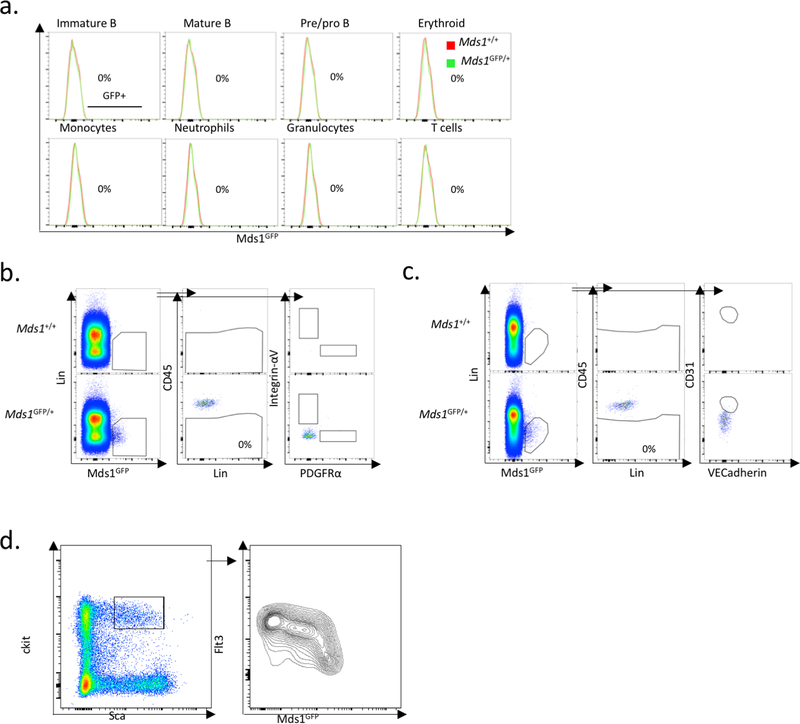
Extended Data Figure 2. Flow cytometric analysis of Mds1GFP/+ expression.
a, GFP+ cells are not present in any mature cellular subpopulations. Green represents Mds1GFP/+ mice while red represents Mds1+/+ control mice. Data shown are from one representative experiment that was repeated three times. b, c, Mds1GFP/+ cells are not present in the CD45 negative bone marrow compartment nor in mesenchymal (Integrin-αV and PDGFRα) and endothelial (CD31 and VE-Cadherin) bone marrow niche components respectively. The experiment was performed one time. d, Flow cytometry analysis reveals an inverse correlation between Mds1-GFP expression and Flt3 staining in Lin-Sca+cKit+ cells. The experiment was performed two times with similar results.
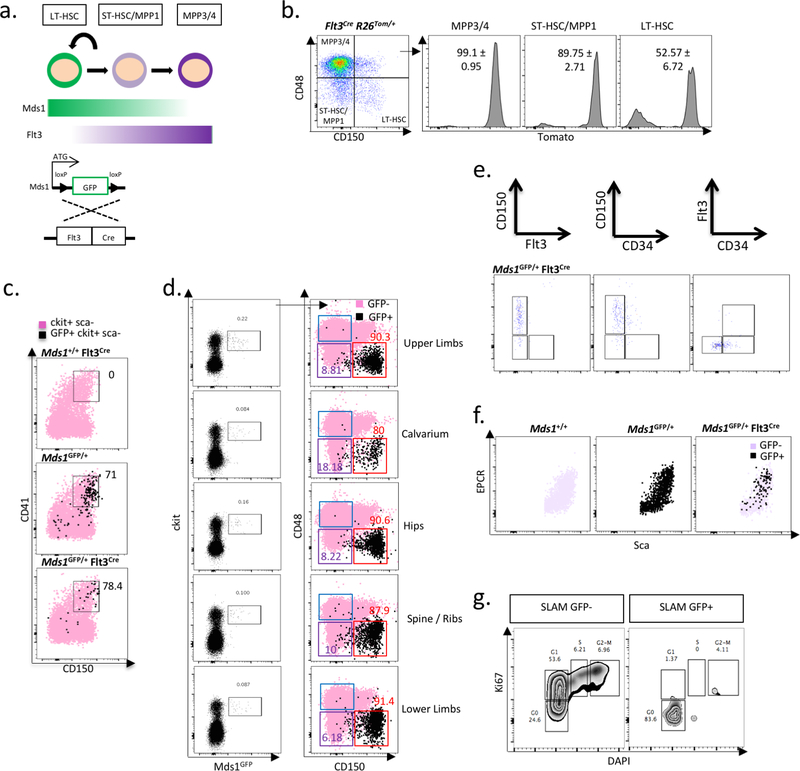
Extended Data Figure 3. Generation of the MFG (Mds1GFP/+ Flt3Cre) mice results in restriction of GFP expression to LT-HSCs.
a, Schematic of genetic strategy to restrict GFP expression to LT-HSC compartment. b, Bone marrow analysis of Flt3Cre R26LSL-Tom shows Flt3-Cre driven activity in compartments downstream of LT-HSCs. N=4 mice, Mean ± SD. c, Further characterization of the cKit+ Sca1- GFP+ cells from MFG mice. CD41+CD150+ represent pre-megakaryocyte cells. The experiment was performed two times with similar results. d, Flow characterization of MFG cell in marrow isolated from multiple bones. The experiment was performed three times with similar results. e, MFG HSCs are predominantly found within the CD34- Flt3- CD150+ BM fraction. The experiment was performed two times with similar results. f, MFG HSCs are predominantly found within the Sca-1 high EPCR+ BM fraction. The experiment was performed one time. g, Cell cycle analysis of SLAM cells that are either GFP+ or GFP- in MFG mice. Experiment represents data from three pulled mice.
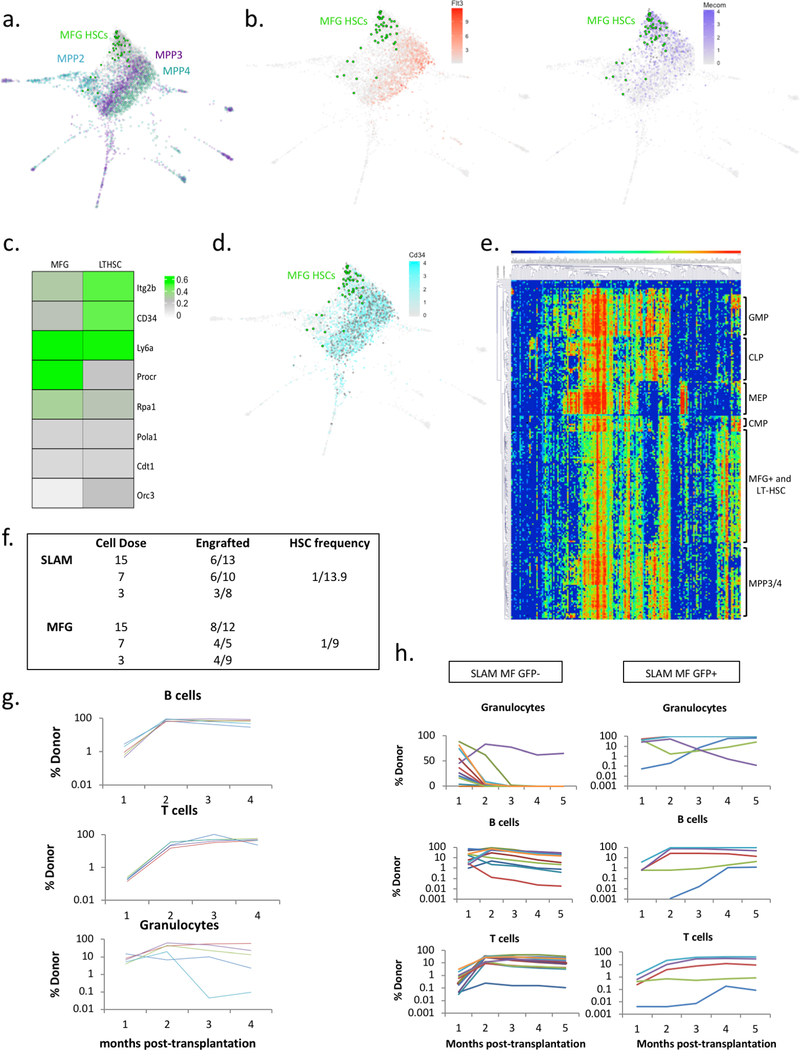
Extended Data Figure 4. Additional characterization of MFG HSCs.
a, b, InDrops single cell RNA-seq analysis of MFG+ cells in comparison to multiple populations of HSC and MPPs. MFG cells (46 cells) are predominantly found areas in which Mecom (purple, n=742 cells), but not Flt3 (orange, n=1111 cells) is expressed Teal=MPP2, Purple=MPP3, Light Green=MPP4, Grey=other cells, Bright Green=Mds1GFP/+ Flt3Cre cells. Gradient color demonstrates normalized read counts. Each dot represents an individual cell. MFG HSCs represent cells from a single mouse, the rest of the cells represent cells from a separate single mouse. c, d, Heatmaps and Spring plot map showing expression levels of previously published ‘dormant’ HSC genes in single cell RNAseq data from LTHSC and MFG cell populations. For the spring plot analysis: MFG=46 cells and CD34=2380 cells (teal), each dot represents an individual cell. MFG HSCs represent cells from a single mouse, the rest of the cells represent cells from a separate single mouse. e, Single-cell transcriptional fluidigm profile of MFG-HSCs demonstrates that they cluster together with SLAM cells. f, Summary of transplants with either 3, 7, and 15 MFG or SLAM HSCs together with 100,000 bone marrow cells, analyzed at 4 months post-transplant. HSC frequencies were calculated using ELDA software (see materials and methods). g, Engraftment analysis following secondary transplantations using whole bone marrow of one primary recipient of 25-cell MFG+ HSCs. Experiment shown is representative out of three independently performed experiments. h, Percentage chimerism at 4, 8, 12, 16 and 20 weeks in primary recipients transplanted with 25 SLAM cells sorted on the basis of GFP expression isolated from Mds1GFP/+ Flt3Cre mice (N=12 GFP- mice, N=5 GFP+ mice). Our data demonstrate that GFP+ cells within the SLAM compartment are more functionally enriched. Each line represents an individual mouse.
Extended Data Figure 5. Multicolor quantitative deep-tissue confocal imaging of complete femoral sections from MFG (Mds1GFP/+ Flt3Cre) mice.
a, Identification of cKit+ GFP+ MFG-HSCs using multicolor quantitative deep-tissue confocal imaging of full bone femoral sections. Pictures are 10 μm xy projections of one area of interest. (N=3 mice). The experiment was performed three times with similar data. b, Example of one full-bone femur section with color-coded visualization of HSCs based on their distance to bone. Yellow squares represent individual HSCs in proximity to cortical or trabecular bone, whereas green dots represent individual HSCs located more than 10 μm away. The picture represents data from an individual mouse. The experiment was performed three times with similar data (refer to panel d). c, Example of full-bone femoral section (only Col.1 and DAPI staining is shown). The experiment was performed three times with similar data. d, Color-coded visualization of HSCs based on their distance to bone. Yellow squares represent individual HSCs in proximity to cortical or trabecular bone, whereas green dots represent individual HSCs located more than 10 μm away. This picture represents an independent mouse from ext. fig 5b. The experiment was performed three times with similar data. e, Quantification of absolute number and anatomical location of c-Kit+ GFP+ MFG-HSCs per individual experiment. (N=3 mice) f, Spatial distribution of HSCs (circles) and random dots (triangles) relative to Col.1 marking bone surfaces and CD105+ vasculature (sinusoids) (N=3 mice). P values were calculated using two-tailed Kolmogorov–Smirnov (distance distributions, upper panel P=0.1516, lower panel P>0.9999) and one-tailed Mann-Whitney (first bin of histograms, upper panel, HSCs: 8.56±5.74, RDs: 6.88±1.94, P=0.50, lower panel, HSCs: 67.52±10.99, RDs: 68.53±3.51, P=0.35) tests. Data points with mean value represented by line (red for HSCs, blue for random dots) and error bars representing standard deviation are shown. N.S., not significant. Epi: epiphysis, meta: metaphysis, dia: diaphysis.
Extended Data Figure 6. Synthesis, structure and characterization of phosphorescent probe Oxyphor PtG4.
The structure of Oxyphor PtG4 is almost identical to that of the previously published probe Oxyphor PdG4 [1], but contains Pt, instead of Pd, at the core of the porphyrin (1: Pt tetra-meso-3,5-dicarboxyphenyl-tetrabenzoporphyrin). a, Synthesis of Oxyphor PtG4. First, eight carboxyl groups on the porphyrin 1 were amended with 4-amino-ethylbutyrate linkers. Upon hydrolysis of the terminal esters in the resulting porphyrin 2, eight aryl-glycine dendrons (H2N-AG2(OBu)4) were coupled to the resulting porphyrin-octacarboxylic acid, giving dendrimer 3. The butyl esters on the latter were hydrolyzed under mild basic conditions, and the resulting free carboxylic acid groups were amidated with mono-methoxypolyethyleneglycol amine (MeO-PEG-NH2, Av MW 1000), giving the target probe Oxyphor PtG4. MALDI-TOF (m/z) was used to confirm the identity of the intermediate products as well as of the target probe molecule. Structure 2 (C116H124N12O24Pt, calculated at MW 2263.85) was found 2264.48 [M]+; structure 3 (C468H540N60O120Pt, calculated at MW 9114.76) was found at 9115.68 [M+H]+ and Oxyphor PtG4 (C1780H3196N92O792Pt, calculated at MW 40538) was found at 35952. For Oxyphor PtG4 we identified an additional peak at MW 66123.6 which is likely due to the presence of dimeric species formed during the ionization process. b, Linear (one photon) absorption (green) and emission spectra (red) of PtG4 in 50 mM phosphate buffer solution (pH 7.2, λex=623 nm. Photophysical constants in PBS, 22oC: e(623)~90,000 M−1cm−1 (molar extinction coefficient), φphos(deox)~0.07 (phosphorescence quantum yield in deoxygenated solution), τair=16μs (phosphorescence decay time on air), tdeox=47ms (phosphorescence decay time in deoxygenated solution). c, Phosphorescence oxygen quenching plot of Oxyphor PtG4. The calibration was performed as previously described [1]. The experimental points were fitted to an arbitrary double-exponential form and thus obtained parametric equation was used to convert the phosphorescence lifetimes obtained in in vivo experiments to pO2 values. d, Two-photon absorption spectrum of PtG4 in deoxygenated dimethylacetamide (DMA, 22oC). e, Arbitrarily scaled one- (green line) and two-photon (blue line) absorption spectra of PtG4. The two-photon absorption (2PA) spectra of PtG4 and of the reference compounds were measured by the relative phosphorescence method, as previously described [2]. The laser source was a Ti:Sapphire oscillator (80 MHz rep. rate) with tunability range of 680–1300 nm (Insight Deep See, Spectra Physics).
All optical spectroscopic experiments and oxygen titrations were performed at least three times, giving highly reproducible results.
f, Representative intravital images of an HSPC (green, left image), MFG-HSC (green, right image), vasculature (gray, Rhodamine-B-dextran 70 kDa), and autofluorescence (blue) overlaid with localized oxygenation measurements. White arrows point at GFP cells. Black arrow points to color representing 10 mmHg. Colored squares represent individual localized oxygen measurement areas. Images represent data from two independent experiments for each mouse model. Scale bars ~50 μm.
[1] Esipova, T. V. et al. Two new “protected” oxyphors for biological oximetry: properties and application in tumor imaging. Anal. Chem. 83, 8756–8765, doi:10.1021/ac2022234 (2011).
[2] Esipova, T. V., Rivera-Jacquez, H. J., Weber, B., Masunov, A. E. & Vinogradov, S. A. Two-photon absorbing phosphorescent metalloporphyrins: effects of p-extension and peripheral substitution. J. Am. Chem. Soc. 138, 15648–15662, doi:10.1021/jacs.6b09157 (2016).
Extended Data Figure 7. Increased motility and expansion of activated MFG-HSCs.
a, Schematic illustration of protocol for activating bone marrow HSC using Cyclophosphamide (Cy) and GCSF. b, Flow cytometry analysis of Cy/GCSF-treated MFG mice (N=3 mice). Data show Lineage- cells. Mean ± SD. c, Number of GFP+ cell identified per calvaria in untreated and Cy/GCSF-treated Mds1GFP/+ Flt3Cre mice (N=5 and 4 mice respectively). Red bars indicate the mean. P value was calculated using a two-tailed Mann-Whitney test. d, Cell cycle analysis of MFG+ cells from Cy/GCSF treated mice. 3 mice were pulled together to acquire the displayed data. e, Graph showing in vivo motility measurements of HSPCs (n=66 cells) and MFG-HSCs (n=30 cells) at steady-state and activated MFG HSCs (n=142 cells) in the calvaria. Red bars indicate the mean. P values were calculated using two-tailed Mann-Whitney tests. f, g, Distance of MFG+ cells to the endosteum (n = 24 and 12 cells for untreated and Cy/GCSF treated, respectively) and to the nearest vessel (n = 20 and 17 cells for untreated and Cy/GCSF treated, respectively), after treatment with Cy/GCSF. Red bars indicate the mean. P values were calculated using two-tailed unpaired T tests.
Extended Data Figure 8. Characterization of MFG HSCs upon activation.
a, Bone marrow analysis of HSPC (Mds1GFP/+) PBS control (N=1 mouse) and HSPC (Mds1GFP/+) 5-FU treated mice (N=2 mice, value represents mean), 17 days after treatment, demonstrates dramatic expansion of HSPCs even after recovery of blood (Extended data figure 1e). b, Graph showing in vivo motility measurements of MFG-HSCs at day 4 (n=14 cells) and day 20 (n=13 cells) after 5-FU treatment. Red bar represents mean. Compare to untreated Mds1GFP/+ Flt3Cre mice in Figure 3a and Extended data figure 7e. P value was calculated using a two-tailed Mann-Whitney test. c, Representative graphical map of the location of MFG-HSCs in the calvaria on day 20 after 5-FU treatment (N=2 mice). Scale bar ~500 μm. d, Generation of Mds1CreER/+ Rosa26Confetti/+ mice. e, Schematic illustration of Cyclophosphamide / GCSF treatment protocol for multi-colored Mds1CreER/+ Rosa26Confetti/+ labeling and activation. Low tamoxifen dosage (2 mg) was used to restrict recombination and expression of fluorescence in LT-HSCs that express higher Mds1 levels. f, Detailed flow cytometry analysis of MPP3/4, STHSC and LT-HSC differential color labeling upon treatment of Mds1CreER/+ Rosa26Confetti/+ mice shows enriched but not fully restricted labelling to LTHSCs. The experiment was performed one time. g, 2D graphical map of the 3D location of activated and labeled HSPCs in the fixed calvaria of control (left top, Tamoxifen only, N=2 mice) and induced (left bottom, Tamoxifen + Cy/GCSF, N=3 mice) mice along with maximum intensity projection (MIP) images (right top and bottom) of the Mds1 labeled cells (red, green, and blue). Scale bar for graphical map and MIP images ~200 μm and 50 μm, respectively. h, Graph showing the color purity of cell clusters (original colors) compared to randomized colors (10,000 cycles) in 3 independent experiments (N=3 mice). P values were calculated using two-tailed unpaired T tests. Bar graphs with error bars represent mean and SD, respectively.
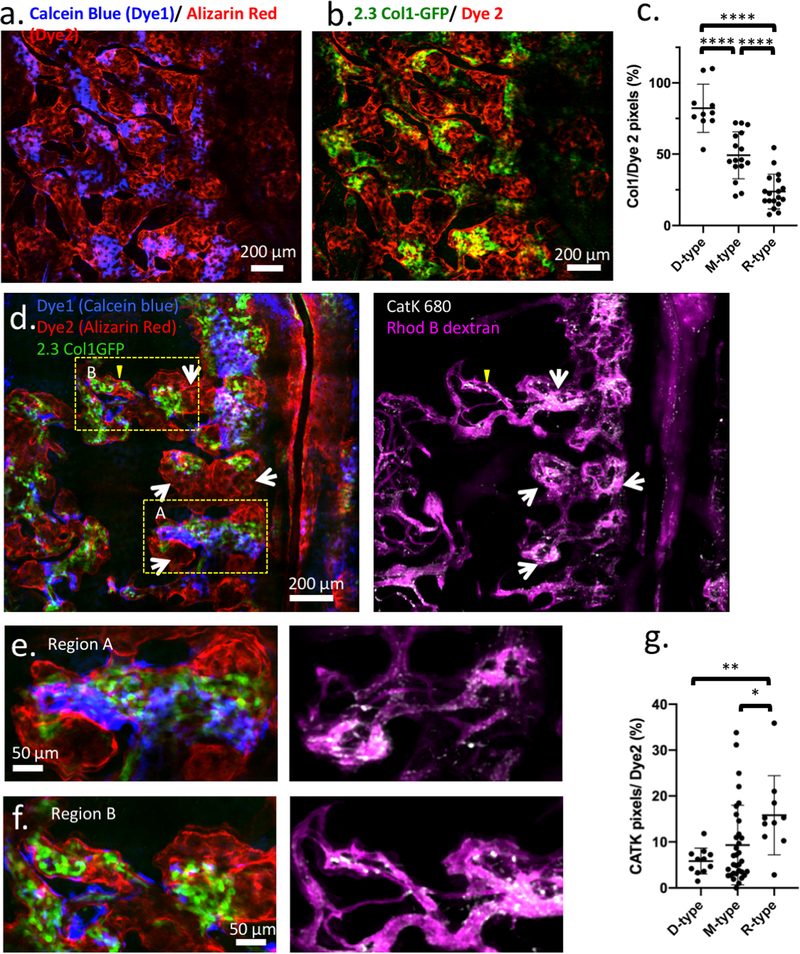
Extended Data Figure 9. Validating bone cavity types using 2.3Col1-GFP (mature osteoblasts) and Cathepsin K activated fluorescent agent (osteoclast).
a, A montage of multiple z-stacks, displayed as the maximum intensity projection, showing the double staining of bone marrow cavities in the calvarium. b, The same area as in extended data figure 9a, showing the locations of 2.3Col1-GFP osteoblasts in areas of the old bone front that has not been eroded (N=3 mice). c, Quantification of 2.3Col1-GFP pixels in D (n = 10 regions), M (n= 16 regions), R (n=18 regions) cavity types. Black line represents mean, error bars represent SD. d, A montage of multiple z-stacks, displayed as the maximum intensity projection, showing the double staining pattern (blue and red), 2.3Col1-GFP cells (green), osteoclasts (white), and bone marrow vasculature (purple). White arrows point to osteoclast clusters. (N=3 mice) e, A zoomed in region from extended figure 9d (box A), showing correlation between 2.3Col1-GFP cells and the remaining Dye1 (blue) in a D-type cavity, and abundant Cathepsin K+ osteoclasts present in the R-type region where Dye1 was eroded. f, Examples of a M-type region from extended figure 9d (box B). In this region, Dye1 was eroded to some extent in spite of abundant 2.3Col1-GFP cells present in the cavity. The corresponding Cathepsin K panel shows co-existence of several cathepsin K+ osteoclasts. g, Quantification of Cathepsin K+ pixels in D (n= 11 regions), M (n= 33 regions), and R-type (n=10 regions) cavities based on maximum intensity projection of montaged z-stacks. Compared to extended figure 9c, Cathepsin K coverage shows a larger spread because it does not stain the cell body uniformly. Instead it frequently shows a punctate staining pattern, likely indicative of the lysosomes/endosomes. (*p < 0.0189; **p = 0.0015,****p< 0.0001 Two-sided Mann-Whitney test. Black line represents mean, error bars represent SD.)
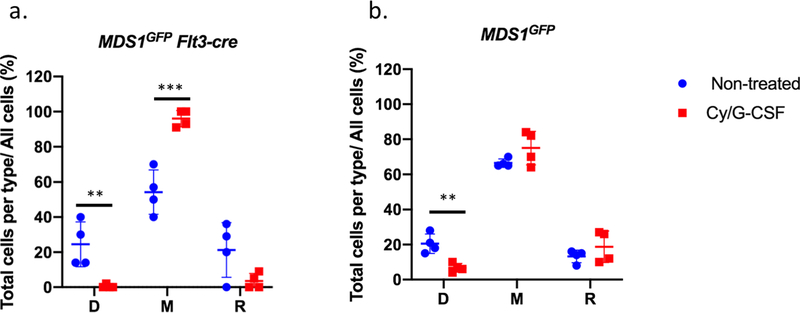
Extended Data Figure 10. Cell distribution before and after treatment (N=4 mice per group).
Graphs show the fractions of MDS or MFG cells distributed in D-M-R-type cavities at the steady state and after Cy/GCSF treatment. The fraction is calculated by the total cells found in each cavity type divided by the total cells found in the calvaria of that mouse. a, The fractions of MFG cells in M-type increased while decreased in the D type after G/CSF treatment. Bars represent mean and standard deviation. (Non-treated groups: 24.5 ± 12.8; 54.3 ± 12.6; 21.3 ± 15.6 in D, M, R-type cavities, respectively. Treated group: 0.5 ± 1.0; 96.0 ± 4.7; 3.5 ± 4.4 in D, M, R-type cavities, respectively) **p= 0.0096; *** p= 0.0008. b, The fractions of cells found in the D-type cavity decreases while remained in M and R-type cavities. Bars represent mean and standard deviation. (Non-treated groups: 20.5 ± 5.6; 66.5 ± 2.4; 13.3 ± 3.6 in D, M, R-type cavities, respectively. Treated group: 6.8 ± 2.5; 75.0 ± 9.6; 18.8 ± 8.9 in D, M, R-type cavities, respectively) (**p=0.004). Unpaired, two-tailed t-test was used for statistical analysis.
Extended Data Figure 11. Heterogeneous bone remodeling in the bone marrow cavities of tibia metaphysis.
A mechanically thinned metaphysis was imaged from the bone surface, labeled by sequential calcium staining. (a-c) En face views of D-, M-, and R-type cavities from tibia metaphysis. (d-f) The x-z cross-section views from annotated white lines in the video 15 demonstrate bone marrow cavities of varied remodeling stages similar to mouse calvaria.
Extended Data Table 1. Activated MFG-HSCs (Mds1GFP/+ Flt3Cre mice) are characterized by increased motility and various cellular interactions between GFP cells.
Table of observed MFG-HSC behaviors in Cyclophosphamide / GCSF treated mice. N=4 mice.
| Total Cells | Paired Cell interactions | Mobilized cells | |
|---|---|---|---|
| N=1 | 16 | 2 | 0 |
| N=2 | 44 | 8 | 0 |
| N=3 | 86 | 32 | 6 |
| N=4 | 46 | 4 | 1 |
| Total | 192 | 46 | 7 |
| Percentage | 24.0% | 3.6% |
Extended Data Table 2.
Summary table of findings from live imaging of native HSCs vs. transplanted HSCs.
| Native HSCs (this work) | Transplanted HSCs |
|---|---|
| Adjacent to both endosteum and sinusoidal blood vessels | Adjacent to both endosteum and blood vessels (did not identify type) (Lo Celso C et al, Nature 2009) |
| Do not reside in regions with deepest hypoxia | Do not home in regions with deepest hypoxia (Spencer JA et al, Nature 2014) |
| Sessile; become motile after activation | Sessile; become motile after activation (Rashidi NM et al, Blood 2014) |
| Proliferate and form clusters after Cy/GCSF or 5-FU | Proliferate and form clusters after transplantation (Lo Celso C et al, Nature 2009) |
Supplementary Material
ACKNOWLEDGMENTS
We are grateful for stimulating discussions with the Camargo lab members, David Scadden and Nicholas Severe for useful discussion and help with long bone staining, Leo Kunz for generating initial Matlab scripts facilitating preliminary long bone data analysis and Ronald Matthieu of the Stem Cell Program Flow Cytometry facility for FACS assistance. This study was supported by awards from the National Institute of Health (HL128850-01A1 and P01HL13147 to F.D.C., R01EB017274, R01CA194596, R01DK115577, and R24DK103074 to C.P.L., R01EB018464, R24NS092986, EB018464 and NS092986 to S.A.V., R01CA175761 to A.S.P., NIDKK-supported Cooperative Centers of Excellence in Hematology at BCH U54DK110805). F.D.C. is a Leukemia and Lymphoma Society and a Howard Hughes Medical Institute Scholar.
Footnotes
Competing interests
The authors declare no competing financial interests.
Ethics statement
All applicable international, national, and/or institutional guidelines for the care and use of animals were followed. All results involved in the study were acquired according to ethical standards.
REFERENCES
- 1.Sun J et al. Clonal dynamics of native haematopoiesis. Nature 514, 322–327, doi: 10.1038/nature13824 (2014). [DOI] [PMC free article] [PubMed] [Google Scholar]
- 2.Busch K & Rodewald HR Unperturbed vs. post-transplantation hematopoiesis: both in vivo but different. Curr Opin Hematol 23, 295–303, doi: 10.1097/MOH.0000000000000250 (2016). [DOI] [PMC free article] [PubMed] [Google Scholar]
- 3.Lo Celso C et al. Live-animal tracking of individual haematopoietic stem/progenitor cells in their niche. Nature 457, 92–96, doi: 10.1038/nature07434 (2009). [DOI] [PMC free article] [PubMed] [Google Scholar]
- 4.Lo Celso C, Lin CP & Scadden DT In vivo imaging of transplanted hematopoietic stem and progenitor cells in mouse calvarium bone marrow. Nature protocols 6, 1–14, doi: 10.1038/nprot.2010.168 (2011). [DOI] [PMC free article] [PubMed] [Google Scholar]
- 5.Sipkins DA et al. In vivo imaging of specialized bone marrow endothelial microdomains for tumour engraftment. Nature 435, 969–973, doi: 10.1038/nature03703 (2005). [DOI] [PMC free article] [PubMed] [Google Scholar]
- 6.Cao X et al. Irradiation induces bone injury by damaging bone marrow microenvironment for stem cells. Proc Natl Acad Sci U S A 108, 1609–1614, doi: 10.1073/pnas.1015350108 (2011). [DOI] [PMC free article] [PubMed] [Google Scholar]
- 7.Acar M et al. Deep imaging of bone marrow shows non-dividing stem cells are mainly perisinusoidal. Nature 526, 126–130, doi: 10.1038/nature15250 (2015). [DOI] [PMC free article] [PubMed] [Google Scholar]
- 8.Chen JY et al. Hoxb5 marks long-term haematopoietic stem cells and reveals a homogenous perivascular niche. Nature 530, 223–227, doi: 10.1038/nature16943 (2016). [DOI] [PMC free article] [PubMed] [Google Scholar]
- 9.Gazit R et al. Fgd5 identifies hematopoietic stem cells in the murine bone marrow. The Journal of experimental medicine 211, 1315–1331, doi: 10.1084/jem.20130428 (2014). [DOI] [PMC free article] [PubMed] [Google Scholar]
- 10.Zhang Y et al. PR-domain-containing Mds1-Evi1 is critical for long-term hematopoietic stem cell function. Blood 118, 3853–3861, doi: 10.1182/blood-2011-02-334680 (2011). [DOI] [PMC free article] [PubMed] [Google Scholar]
- 11.Metais JY & Dunbar CE The MDS1-EVI1 gene complex as a retrovirus integration site: impact on behavior of hematopoietic cells and implications for gene therapy. Mol Ther 16, 439–449, doi: 10.1038/sj.mt.6300372 (2008). [DOI] [PubMed] [Google Scholar]
- 12.Oguro H, Ding L & Morrison SJ SLAM family markers resolve functionally distinct subpopulations of hematopoietic stem cells and multipotent progenitors. Cell stem cell 13, 102–116, doi: 10.1016/j.stem.2013.05.014 (2013). [DOI] [PMC free article] [PubMed] [Google Scholar]
- 13.Pietras EM et al. Functionally Distinct Subsets of Lineage-Biased Multipotent Progenitors Control Blood Production in Normal and Regenerative Conditions. Cell stem cell 17, 35–46, doi: 10.1016/j.stem.2015.05.003 (2015). [DOI] [PMC free article] [PubMed] [Google Scholar]
- 14.Boyer SW, Schroeder AV, Smith-Berdan S & Forsberg EC All hematopoietic cells develop from hematopoietic stem cells through Flk2/Flt3-positive progenitor cells. Cell stem cell 9, 64–73, doi: 10.1016/j.stem.2011.04.021 (2011). [DOI] [PMC free article] [PubMed] [Google Scholar]
- 15.Buza-Vidas N et al. FLT3 expression initiates in fully multipotent mouse hematopoietic progenitor cells. Blood 118, 1544–1548, doi: 10.1182/blood-2010-10-316232 (2011). [DOI] [PubMed] [Google Scholar]
- 16.Cabezas-Wallscheid N et al. Vitamin A-Retinoic Acid Signaling Regulates Hematopoietic Stem Cell Dormancy. Cell 169, 807–823 e819, doi: 10.1016/j.cell.2017.04.018 (2017). [DOI] [PubMed] [Google Scholar]
- 17.Zilionis R et al. Single-cell barcoding and sequencing using droplet microfluidics. Nature protocols 12, 44–73, doi: 10.1038/nprot.2016.154 (2017). [DOI] [PubMed] [Google Scholar]
- 18.Rodriguez-Fraticelli AE et al. Clonal analysis of lineage fate in native haematopoiesis. Nature 553, 212–216, doi: 10.1038/nature25168 (2018). [DOI] [PMC free article] [PubMed] [Google Scholar]
- 19.Sanjuan-Pla A et al. Platelet-biased stem cells reside at the apex of the haematopoietic stem-cell hierarchy. Nature 502, 232–236, doi: 10.1038/nature12495 (2013). [DOI] [PubMed] [Google Scholar]
- 20.Guo G et al. Mapping cellular hierarchy by single-cell analysis of the cell surface repertoire. Cell stem cell 13, 492–505, doi: 10.1016/j.stem.2013.07.017 (2013). [DOI] [PMC free article] [PubMed] [Google Scholar]
- 21.Kunisaki Y et al. Arteriolar niches maintain haematopoietic stem cell quiescence. Nature 502, 637–643, doi: 10.1038/nature12612 (2013). [DOI] [PMC free article] [PubMed] [Google Scholar]
- 22.Nombela-Arrieta C et al. Quantitative imaging of haematopoietic stem and progenitor cell localization and hypoxic status in the bone marrow microenvironment. Nature cell biology 15, 533–543, doi: 10.1038/ncb2730 (2013). [DOI] [PMC free article] [PubMed] [Google Scholar]
- 23.Lassailly F, Foster K, Lopez-Onieva L, Currie E & Bonnet D Multimodal imaging reveals structural and functional heterogeneity in different bone marrow compartments: functional implications on hematopoietic stem cells. Blood 122, 1730–1740, doi: 10.1182/blood-2012-11-467498 (2013). [DOI] [PubMed] [Google Scholar]
- 24.Coutu DL, Kokkaliaris KD, Kunz L & Schroeder T Multicolor quantitative confocal imaging cytometry. Nat Methods 15, 39–46, doi: 10.1038/nmeth.4503 (2018). [DOI] [PubMed] [Google Scholar]
- 25.Takubo K & Suda T Roles of the hypoxia response system in hematopoietic and leukemic stem cells. Int J Hematol 95, 478–483, doi: 10.1007/s12185-012-1071-4 (2012). [DOI] [PubMed] [Google Scholar]
- 26.Parmar K, Mauch P, Vergilio JA, Sackstein R & Down JD Distribution of hematopoietic stem cells in the bone marrow according to regional hypoxia. Proc Natl Acad Sci U S A 104, 5431–5436, doi: 10.1073/pnas.0701152104 (2007). [DOI] [PMC free article] [PubMed] [Google Scholar]
- 27.Spencer JA et al. Direct measurement of local oxygen concentration in the bone marrow of live animals. Nature 508, 269–273, doi: 10.1038/nature13034 (2014). [DOI] [PMC free article] [PubMed] [Google Scholar]
- 28.Morrison SJ, Wright DE & Weissman IL Cyclophosphamide/granulocyte colony-stimulating factor induces hematopoietic stem cells to proliferate prior to mobilization. Proc Natl Acad Sci U S A 94, 1908–1913 (1997). [DOI] [PMC free article] [PubMed] [Google Scholar]
- 29.Snippert HJ et al. Intestinal crypt homeostasis results from neutral competition between symmetrically dividing Lgr5 stem cells. Cell 143, 134–144, doi: 10.1016/j.cell.2010.09.016 (2010). [DOI] [PubMed] [Google Scholar]
- 30.Yeh SA, Wilk K, Lin CP & Intini G In Vivo 3D Histomorphometry Quantifies Bone Apposition and Skeletal Progenitor Cell Differentiation. Sci Rep 8, 5580, doi: 10.1038/s41598-018-23785-6 (2018). [DOI] [PMC free article] [PubMed] [Google Scholar]
- 31.Rashidi NM et al. In vivo time-lapse imaging shows diverse niche engagement by quiescent and naturally activated hematopoietic stem cells. Blood 124, 79–83, doi: 10.1182/blood-2013-10-534859 (2014). [DOI] [PMC free article] [PubMed] [Google Scholar]
- 32.Adams GB et al. Stem cell engraftment at the endosteal niche is specified by the calcium-sensing receptor. Nature 439, 599–603, doi: 10.1038/nature04247 (2006). [DOI] [PubMed] [Google Scholar]
- 33.Kollet O et al. Osteoclasts degrade endosteal components and promote mobilization of hematopoietic progenitor cells. Nat Med 12, 657–664, doi: 10.1038/nm1417 (2006). [DOI] [PubMed] [Google Scholar]
- 34.Medaglia C et al. Spatial reconstruction of immune niches by combining photoactivatable reporters and scRNA-seq. Science 358, 1622–1626, doi: 10.1126/science.aao4277 (2017). [DOI] [PMC free article] [PubMed] [Google Scholar]
METHODS REFERENCES
- 35.Rodriguez CI et al. High-efficiency deleter mice show that FLPe is an alternative to Cre-loxP. Nat Genet 25, 139–140, doi: 10.1038/75973 (2000). [DOI] [PubMed] [Google Scholar]
- 36.Madisen L et al. A robust and high-throughput Cre reporting and characterization system for the whole mouse brain. Nat Neurosci 13, 133–140, doi: 10.1038/nn.2467 (2010). [DOI] [PMC free article] [PubMed] [Google Scholar]
- 37.Kalajzic Z et al. Directing the expression of a green fluorescent protein transgene in differentiated osteoblasts: comparison between rat type I collagen and rat osteocalcin promoters. Bone 31, 654–660 (2002). [DOI] [PubMed] [Google Scholar]
- 38.Hu Y & Smyth GK ELDA: extreme limiting dilution analysis for comparing depleted and enriched populations in stem cell and other assays. Journal of immunological methods 347, 70–78, doi: 10.1016/j.jim.2009.06.008 (2009). [DOI] [PubMed] [Google Scholar]
- 39.Esipova TV et al. Two new “protected” oxyphors for biological oximetry: properties and application in tumor imaging. Anal Chem 83, 8756–8765, doi: 10.1021/ac2022234 (2011). [DOI] [PMC free article] [PubMed] [Google Scholar]
- 40.Lebedev AY et al. Dendritic phosphorescent probes for oxygen imaging in biological systems. ACS Appl Mater Interfaces 1, 1292–1304, doi: 10.1021/am9001698 (2009). [DOI] [PMC free article] [PubMed] [Google Scholar]
- 41.Esipova TV, Rivera-Jacquez HJ, Weber B, Masunov AE & Vinogradov SA Two-Photon Absorbing Phosphorescent Metalloporphyrins: Effects of pi-Extension and Peripheral Substitution. J Am Chem Soc 138, 15648–15662, doi: 10.1021/jacs.6b09157 (2016). [DOI] [PMC free article] [PubMed] [Google Scholar]
- 42.Lo Celso C, Wu JW & Lin CP In vivo imaging of hematopoietic stem cells and their microenvironment. Journal of biophotonics 2, 619–631, doi: 10.1002/jbio.200910072 (2009). [DOI] [PubMed] [Google Scholar]
- 43.Bixel MG et al. Flow Dynamics and HSPC Homing in Bone Marrow Microvessels. Cell Rep 18, 1804–1816, doi: 10.1016/j.celrep.2017.01.042 (2017). [DOI] [PMC free article] [PubMed] [Google Scholar]
- 44.Itkin T et al. Distinct bone marrow blood vessels differentially regulate haematopoiesis. Nature 532, 323–328, doi: 10.1038/nature17624 (2016). [DOI] [PMC free article] [PubMed] [Google Scholar]
- 45.Mondor I et al. Clonal Proliferation and Stochastic Pruning Orchestrate Lymph Node Vasculature Remodeling. Immunity 45, 877–888, doi: 10.1016/j.immuni.2016.09.017 (2016). [DOI] [PubMed] [Google Scholar]
- 46.Manolagas SC Birth and death of bone cells: basic regulatory mechanisms and implications for the pathogenesis and treatment of osteoporosis. Endocr Rev 21, 115–137, doi: 10.1210/edrv.21.2.0395 (2000). [DOI] [PubMed] [Google Scholar]
- 47.Weinstein RS et al. Promotion of osteoclast survival and antagonism of bisphosphonate-induced osteoclast apoptosis by glucocorticoids. J Clin Invest 109, 1041–1048, doi: 10.1172/JCI14538 (2002). [DOI] [PMC free article] [PubMed] [Google Scholar]
- 48.Ollion J, Cochennec J, Loll F, Escude C & Boudier T TANGO: a generic tool for high-throughput 3D image analysis for studying nuclear organization. Bioinformatics 29, 1840–1841, doi: 10.1093/bioinformatics/btt276 (2013). [DOI] [PMC free article] [PubMed] [Google Scholar]
- 49.Matic I et al. Quiescent Bone Lining Cells Are a Major Source of Osteoblasts During Adulthood. Stem Cells 34, 2930–2942, doi: 10.1002/stem.2474 (2016). [DOI] [PMC free article] [PubMed] [Google Scholar]
Associated Data
This section collects any data citations, data availability statements, or supplementary materials included in this article.
Supplementary Materials
Data Availability Statement
The GEO accession number for GFP cells is: GSE115908. The GEO accession number for LSK cells used for overlay was previously published (GSE90742)18.


