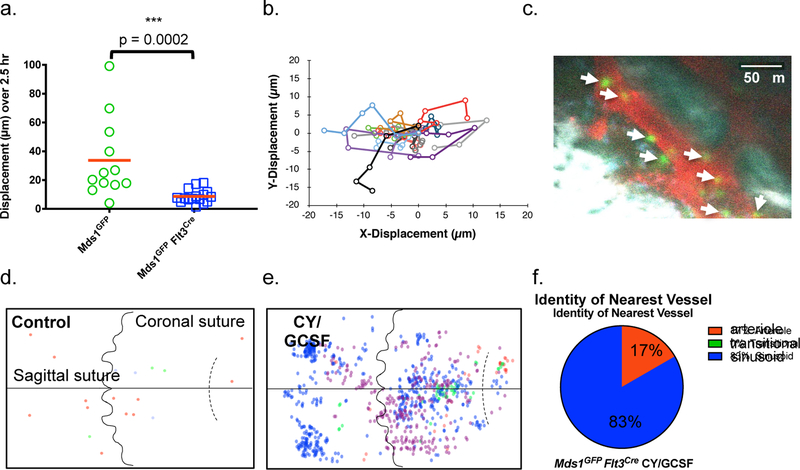
Figure 3. Increased motility, expansion, and localization of activated MFG-HSC s.
a, In vivo motility measurements of HSPCs (n=12 cells) and MFG-HSCs (n=16 cells) at steady-state over a 2.5 hr imaging period. Red bars indicate the mean. P value was calculated using a two-tailed Mann-Whitney test. b, Cell tracks for 16 MFG-HSCs over a 2.5 hr imaging period. Images were acquired every 30 minutes. c, Representative intravital image of a Cy/GCSF treated MFG mouse 4.5 days after the beginning of treatment. MFG cells (green), vasculature (red, Angiosense 680EX), auto-fluorescence (blue), and bone (white, second harmonic generation). Scale bar ~50 μm. Arrows point at GFP cells. The experiment was performed four times with similar results. d, e, Graphical map of the location of MFG-HSCs in the calvaria of untreated and Cy/GCSF treated mice (N=3 and 4, respectively). Location data from individual mice are indicated by different colors. f, Identity of nearest vessel for each MFG+ cell (n=12 cells) after treatment with Cy/ GCSF. Compare to untreated mice in Figure 2d.

