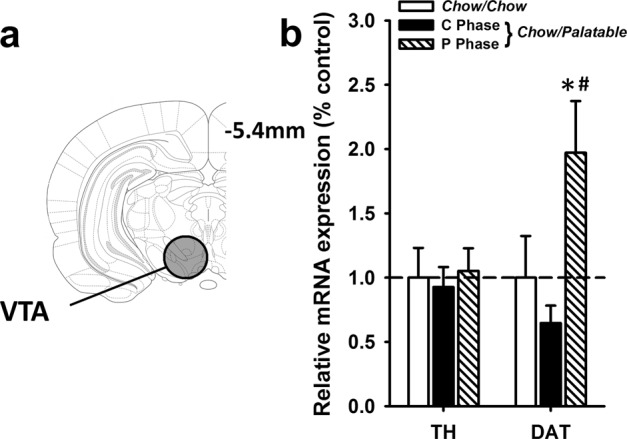
Fig. 3.

DAT mRNA is increased in Chow/Palatable rats in the P Phase. a Schematic of VTA section harvested for qPCR analysis. b mRNA expression (normalized to Cyp) of TH and DAT is expressed relative to Chow/Chow group levels. Data are Mean ± SEM. n = 23. * p < 0.05 vs. Chow/Chow group; # p < 0.05 vs. Chow/Palatable: C Phase group
