Abstract
Background
Personalization of 177Lu-based radionuclide therapy requires implementation of dosimetry methods that are both accurate and practical enough for routine clinical use. Quantitative single-photon emission computed tomography/computed tomography (QSPECT/CT) is the preferred scanning modality to achieve this and necessitates characterizing the response of the camera, and calibrating it, over the full range of therapeutic activities and system capacity. Various methods to determine the camera calibration factor (CF) and the deadtime constant (τ) were investigated, with the aim to design a simple and robust protocol for quantitative 177Lu imaging.
Methods
The SPECT/CT camera was equipped with a medium energy collimator. Multiple phantoms were used to reproduce various attenuation conditions: rod sources in air or water-equivalent media, as well as a Jaszczak phantom with inserts. Planar and tomographic images of a wide range of activities were acquired, with multiple energy windows for scatter correction (double or triple energy window technique) as well as count rate monitoring over a large spectrum of energy. Dead time was modelled using the paralysable model. CF and τ were deduced by curve fitting either separately in two steps (CF determined first using a subset of low-activity acquisitions, then τ determined using the full range of activity) or at once (both CF and τ determined using the full range of activity). Total or segmented activity in the SPECT field of view was computed. Finally, these methods were compared in terms of accuracy to recover the known activity, in particular when planar-derived parameters were applied to the SPECT data.
Results
The SPECT camera was shown to operate as expected on a finite count rate range (up to ~ 350 kcps over the entire energy spectrum). CF and τ from planar (sources in air) and SPECT segmented Jaszczak data yielded a very good agreement (CF < 1% and τ < 3%). Determining CF and τ from a single curve fit made dead-time-corrected images less prone to overestimating recovered activity. Using triple-energy window scatter correction while acquiring one or more additional energy window(s) to enable wide-spectrum count rate monitoring (i.e. ranging 55–250 or 18–680 keV) yielded the most consistent results across the various geometries. The final, planar-derived calibration parameters for our system were a CF of 9.36 ± 0.01 cps/MBq and a τ of 0.550 ± 0.003 μs. Using the latter, the activity in a Jaszczak phantom could be quantified by QSPECT with an accuracy of 0.02 ± 1.10%.
Conclusions
Serial planar acquisitions of sources in air using an activity range covering the full operational capacity of the SPECT/CT system, with multiple energy windows for wide-spectrum count rate monitoring, and followed by simultaneous determination of CF and τ using a single equation derived from the paralysable model, constitutes a practical method to enable accurate dead-time-corrected QSPECT imaging in a post-177Lu radionuclide therapy setting.
Keywords: Quantitative SPECT, SPECT/CT, 177Lu, Calibration, Dead time
Background
177Lu-DOTA-octreotate peptide receptor radionuclide therapy (PRRT) is an effective palliative treatment for neuroendocrine tumours [1, 2]. So far, PRRT has mostly been practised in an empiric fashion (e.g. four cycles of 7.4 GBq 177Lu-DOTA-octreotate), despite the well-known high inter-patient variability of absorbed doses to healthy tissues per injected activity [3–5]. There is growing evidence that personalizing PRRT based on image-based dosimetry calculations could enhance its efficacy without augmenting toxicity, by increasing injected activity and tumour irradiation in a majority of patients, while limiting radiation exposure of their healthy tissues [3–5]. Dosimetry-based personalization could also benefit the rapidly developing prostate-specific membrane antigen (PSMA) radioligand therapy (RLT) with 177Lu [6]. Quantitative single-photon emission computed tomography/computed tomography [(Q)SPECT/CT] overcomes many limitations of planar imaging and is emerging as the preferred scanning method to perform internal dosimetry of 177Lu-based radionuclide therapy [7–9].
Accurate quantification is possible if corrections for image degrading effects are applied and the camera system is characterized and calibrated over the entire range of activities used in clinical practice [10]. Compensation for scatter and attenuation, which are widely available on current SPECT/CT systems, are essential for QSPECT [9–15]. In addition, dead-time (DT) correction is needed to maximize the accuracy of 177Lu quantification and this correction requires determination of the camera DT constant (τ) [8]. Finally, in order to convert the SPECT image counts into activity concentration, the camera calibration factor (CF) must be measured. Determination of both, CF and τ, requires experiments with 177Lu sources and/or phantoms. This characterization must be performed for each combination of radionuclide, collimator, energy window setting and camera [9].
Several methods have been proposed to evaluate these parameters, some more demanding than others in terms of acquisition time, decay period, and image processing [8, 9, 16–21]. Planar imaging-based calibration is faster and more convenient to execute and is expected to yield accurate CF [9, 20] relative to fully tomographic calibration as the reference method [9, 21, 22]. The objectives of this study were to perform a comprehensive characterization of our SPECT/CT system’s response (combined effects of CF and τ) over its full range of quantifiable 177Lu activities and to compare various acquisition and analysis methods for camera calibration for QSPECT imaging, with the aim to simplify this process. In particular, we investigated: (1) how accurate CF and τ determined in planar mode are when applied to reconstructed SPECT images of phantoms of varied geometry; (2) if CF is more conveniently determined separately at low activity, or simultaneously to τ over the full range of quantifiable activity; and (3) if DT losses of primary photon counts—i.e. scatter-corrected photopeak counts, whether from planar or reconstructed SPECT images—could be practically estimated from wide-energy spectrum acquisition counting rate, as presented in [8], as opposed to having to determine DT for each of the three windows used for triple energy window (TEW) scatter correction as presented in [21], or for just the photopeak window as presented by Willowson et al. [23]. Also, we evaluated if segmenting the SPECT images to remove spurious counts in non-radioactive and dense areas of phantoms improves quantitative accuracy with which total activity of the phantom can be recovered, as well as the impact of using triple vs. double energy window (DEW) scatter correction, and that of reducing the width of the recorded wide-energy spectrum window for DT determination.
Materials and methods
SPECT/CT system
A dual-head Symbia T6 SPECT/CT system (Siemens Healthineers, Erlangen, Germany) with a NaI crystal thickness of 9.5 mm and equipped with a medium energy low penetration collimator was used.
Energy windows
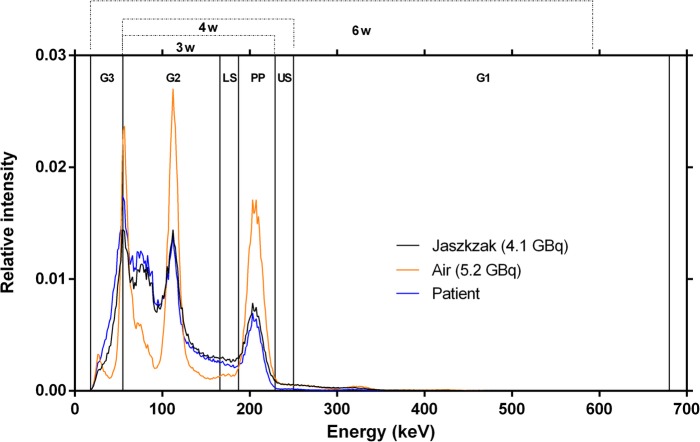
The energy window settings, allowing us to perform double (DEW) or triple (TEW) energy window scatter correction [11], are detailed in Table 1. Either the photopeak window only, or a combination of 3, 4 or 6 contiguous energy windows (3W, 4W and 6W, respectively) were used to monitor the observed acquisition counting rate (RWo) and to assess whether DT could be accurately estimated using a narrower portion of the energy spectrum than 6W (Fig. 1).
Table 1.
Energy window settings and combinations used for acquisition and analysis
| Centre (keV) | Width | Limits [lower-upper] (keV) | |
|---|---|---|---|
| Energy window settings | |||
| PP (Photopeak) | 208 | 20% | [187–229] |
| LS (Lower Scatter) | 10% | [166–187] | |
| US (Upper Scatter) | 10% | [229–250] | |
| G1 (General Scatter 1) | 465 | 93% | [250–680] |
| G2 (General Scatter 2) | 111 | 100% | [55–166] |
| G3 (General Scatter 3) | 37 | 100% | [18–55] |
| Energy window combinations | |||
| 3W (PP + LS + G2) | [55–229] | ||
| 4W (PP + LS + US+G2) | [55–250] | ||
| 6W (PP + LS + US + G1 + G2 + G3) | [18–680] | ||
Fig. 1.
177Lu energy spectrum (normalized to the area under the curve) for sources in air (5.2 GBq), the Jaszczak phantom (4.1 GBq), and a patient (treated with 4.7 GBq 177Lu-octreotate). The energy windows and combinations thereof, described in Table 1, are also shown
Because photons of any energy, not only those recorded in the photopeak window, can cause camera DT [8, 21, 24], and because the shape of the energy spectrum changes depending on the geometry of the scanned object (in particular the volume of attenuating/scattering matter, Fig. 2), we acquired data in 6 contiguous energy windows covering practically all the energy range of 177Lu events recordable by our SPECT system (Table 1). By default, and unless otherwise specified, we used the summed count rate from these 6 energy windows (6W, 18–680 keV, Table 1) for wide-spectrum-based modelling of DT affecting primary counts. However, we hypothesize that acquiring only the general scatter windows that accumulates the largest fraction of counts (G2, 55-166 keV; Table 1) in addition to the photopeak and scatter windows would suffice to accurately monitor and correct for DT when scanning objects of varied geometries.
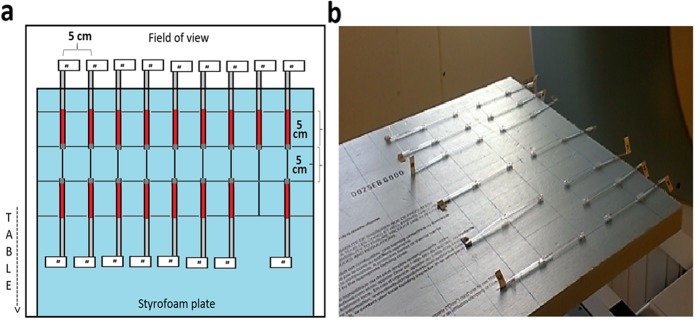
Fig. 2.
Schema (a) and picture (b) of capillary 177Lu sources disposition on the polystyrene foam board (Air-2D phantom) for planar acquisitions
Phantoms
To compare calibration and DT parameters obtained with planar vs. tomographic acquisitions, sources placed in air and extended phantoms were scanned. Only point sources in air were used with planar imaging (without attenuation correction). To emulate various attenuation and scatter conditions typically encountered in clinical SPECT studies, multiple phantoms were scanned using tomographic acquisitions.
Two types of containers were used to hold the activity: plastic capillary tubes (inner diameter: 1.1 mm, length: 7.5 cm) and a Jaszczak SPECT Deluxe phantom with cold rod inserts and fillable spheres (Data Spectrum Corporation, Durham, USA).
To characterize the DT response of the camera, a large range of 177Lu activities (177LuCl3 from IBD-Holland, The Netherlands) were used. The dose calibrator (Atomlab 400, Biodex, USA) was calibrated with a NIST traceable 177Lu source (1998 MBq, Eckert & Ziegler, Valencia, CA, USA) and used to measure the activity in the capillaries, and in the syringe before and after the filling of the Jaszczak and its spheres.
Seventeen capillaries were filled over approximately 5 cm in length with concentrated 177LuCl3 solution (up to 34 GBq/mL) and sealed with wax. To each tube, a labelled stem was attached for easier source manipulation and identification. The choice of capillary tubes was motivated by the need to have small volumes filled with high activity spread over several pixels in order to avoid saturation (i.e. > 65,535 counts in one pixel or reconstructed voxel) [8]. The ranges of activities used in each phantom are presented in Table 2. The following phantom configurations were used:
Sources in air—2D layout (Air-2D): Capillary tubes were placed on a 2.5 × 50 × 70 cm3 polystyrene foam board (minimal attenuation, thus considered “air equivalent”) that was fixed to the end of the camera’s couch so that the capillaries were positioned at a distance of 34.6 cm from each camera head (Fig. 2).
Sources in air—3D layout (Air-3D): A cylindrical piece of polystyrene foam (32 cm in diameter) and with nine holes corresponding to the patterns of the adult head/pediatric body (CTDI-16) and adult body (CTDI-32) phantoms for measurement of CT dose indexes was manufactured (Fig. 3b). The capillary tubes were placed in these holes.
Sources in water equivalent medium (CTDI): Three polymethylmethacrylate cylindrical phantoms (diameters of 10, 16 and 32 cm, respectively), typically used for measurements of the CT dose index (CTDI-10, CTDI-16 and CTDI-32, respectively; Pycko Scientific Limited, Grantham, England [25];) were employed in these experiments. Each of these phantoms has five holes into which capillary tubes were inserted (Fig. 3c).
Sources in water with background activity (Jaszczak): The Jaszczak phantom was filled with a total of 19,111 MBq of 177Lu. Part of this activity (18,535 MBq) was diluted in 6.1 L of water and filled the main compartment of the phantom, with an excess of a chelating agent (diethylenetriamine pentaacetate, DTPA) to avoid precipitation of activity on the phantom walls [19]. The remaining 574 MBq were diluted in 31.8 mL of water and used to fill the spheres, resulting in a concentration ratio of 6:1 between the spheres and the cylinder (18 and 3 MBq/mL, respectively) [20].
Table 2.
Ranges of activity and count rates, per phantom
| Acquisition type | Phantom | Total no. of acquisitionsa | Activity range (MBq) | Photopeak count rate range (cps) | Wide-spectrum (18–680 keV) count rate range (cps) |
|---|---|---|---|---|---|
| Planar | Air-2D | 34 | 19–15,123 | 208–97,638 | 851–375,605 |
| Tomographic | Air-3D | 35 | 32–15,274 | 327–92,275 | 1342–370,033 |
| CTDI-10 | 21 | 13–12,053 | 93–64,027 | 665–367,557 | |
| CTDI-16 | 17 | 16–13,540 | 83–61,456 | 695–377,300 | |
| CTDI-32 | 21 | 21–18,625 | 50–60,328 | 513–380,170 | |
| Jaszczak | 30 | 44–18,985 | 307–55,270 | 2650–386,006 |
Fig. 3.
Schema (a) and pictures (b, c) of cylindrical phantoms used in SPECT acquisitions with capillary sources. The Air-3D phantom is shown in b while the CTDI-10 phantom is shown in c. Starting from the centre, the capillaries were added successively (up to three capillaries per hole)
Acquisitions and reconstruction
A dynamic planar acquisition of the Air-2D phantom was performed while adding 17 capillary tubes to the board, one at a time, during every odd-numbered frame, so that the activity was stable during the even-numbered frames. This experiment was performed twice, 15 days apart, with frame durations of 30 and 60 s, respectively, yielding a series of 34 planar acquisitions. A matrix of 256 × 256 was used. The counts acquired in the 208 keV photopeak window were scatter-corrected using TEW method (or DEW, when specified), i.e. by subtracting the summed counts collected in the scatter window(s) from those recorded in the photopeak window, and then dividing the result by the frame duration, to obtain the observed primary photons count rate (RPo). The analyses were performed for each camera detector separately and also using averaged counts from both detectors.
Tomographic acquisitions were performed with the five 3D phantoms (Air-3D, CTDI-10, CTDI-16, CTDI-32, Jaszczak), using the same settings as used in our current clinical protocol: 96 projections (48 per head), step-and-shoot mode, non-circular orbit, 128 × 128 matrix (4.8-mm voxel). To avoid voxel saturation, the time per projection was adjusted according to the activity in the phantom and ranged from 1 to 24 s for Air-3D and CTDI phantoms, and from 1 to 180 s for the Jaszczak phantom. For Air-3D and CTDI phantoms, acquisitions were obtained with one to 15 capillaries placed in holes (up to 3 per hole), and were performed twice, 15 days apart. The Jaszczak phantom was scanned 30 times over 59 days.
All tomographic datasets were reconstructed using the vendor’s ordered subset expectation maximization iterative algorithm with resolution recovery (Flash3D, Siemens Healthineers, Erlangen, Germany), with 4 iterations and 8 subsets, a CT-based attenuation correction (110 kVp, 70 mAs CARE Dose 4D, B08s convolution kernel, extended field of view, coregistered to the SPECT volume and converted to a 208-keV attenuation map, narrow-beam geometry), and TEW (or DEW, when specified) scatter correction. Because the reconstructed images are scaled by the number of projections, RPo was obtained by dividing the sum of counts in the reconstructed SPECT volume by the product of the number of projections and their duration.
Unless otherwise specified, primary photon counts (and thus RPo) were obtained by applying TEW scatter correction to photopeak counts recorded in both planar and tomographic mode. We previously used DEW scatter correction because of the lack of down-scatter from high-energy events [8], but more recently observed that pile-up events could accumulate in the upper scatter window at high activity [21]. We wanted to assess the impact of DEW vs. TEW on quantitative accuracy. We therefore re-analysed the data with simplified energy window schemes: 4 energy windows (4 W) and TEW; 3 energy windows (3 W) and DEW (Table 1).
Segmentation
Initially, RPo of the reconstructed SPECT images was computed using the entire volume of the phantom. However, particularly in the presence of a large volume of non-radioactive attenuating material, such as when using the CTDI phantoms, excess scattered counts may be ineffectively eliminated with DEW or TEW scatter correction techniques [20, 26]. In an attempt to compensate for this, the following segmentation techniques were applied to compute RPo:
ROI method: For the Jaszczak phantom (which has an inner diameter of 21 cm), a 23-cm circular region of interest (ROI) was drawn on each slice of the phantom. For Air-3D and CTDI phantoms, up to five 3.8-cm circular ROIs were drawn on each slice containing the capillaries and centred on these.
Threshold method: For all tomographic phantoms, a threshold segmentation approach was used, in which one percent of the maximum voxel value in the volume was used as the volume of interest lower threshold [17].
Camera calibration factor and dead-time constant
The term camera sensitivity is defined as RPo per known activity (A). Ideally, as the activity increases, the detected count rate should increase proportionately, and the sensitivity should remain constant. However, in scans where high activities are used, the sensitivity decreases because the count rate is affected by DT. We reserve the term camera calibration factor (CF) only to the DT-free data, i.e. when RPo equals RPt (the true primary count rate), such as data obtained in very low counting rate conditions or after DT correction (Eq. 1), while the camera sensitivity combines CF and the DT effects. CF thus characterizes the system and is used to convert the reconstructed SPECT primary count rate data into activity after DT correction, and ultimately into activity concentration.
| 1 |
DT response of modern gamma cameras is typically described by the paralysable model (Eq. 2 [21, 27, 28];).
| 2 |
where Ro and Rt are the observed and true count rates, respectively.
We modified Eq. 2 to determine the DT affecting RPo based on the observed acquisition count rate RWo in a given energy window W, (Eq. 3, as in reference [8], which can be re-written as Eq. 4).
| 3 |
| 4 |
In SPECT, RWo is computed by summing the counts within energy window W from all projections acquired by both detectors, divided by number of images and time per projection. It is important to note that Eqs. 3 and 4 do not imply that DT affecting RPo is equal to that affecting and RWo, and that the τ obtained here is only used to estimate the DT correction factor applying to RPo (i.e. RPt/RPo, Eq. 4) as a function of the acquisition counting rate RWo, but not to correct RWo itself for DT. Because other phenomena such as pulse pile-up will distort the energy spectra histogram at higher count rates, primary photons count losses will be greater than the acquisitions count losses in energy window W, when W is significantly wider than the photopeak window, as some of the primary photons will be detected only outside of the photopeak window, resulting in some lost primary events still counted in W. Accordingly, it is expected that the RWo-based τ to estimate DT affecting RPo will be larger than a τ describing DT affecting RWo itself.
For planar and tomographic data, sensitivity was first plotted as a function of activity, photopeak count rate and wide-spectrum (6W) count rate. This allowed us to determine which parameter from these three best describes the DT behaviour of the SPECT camera independently of the attenuation and scatter conditions. For planar and tomographic data, we then determined CF and τ using two methods, A and B, with GraphPad Prism (v. 7.0, GraphPad Software, La Jolla, CA, USA).
Method A (low-activity CF): CF and τ are determined in two steps. CF is first determined by plotting the observed primary photons count rate as a function of activity and performing a linear fit forced to cross the origin for DT-free data points (i.e. obtained at low count rate where less than 1% DT is observed). The slope of the fit represents CF. The next step was to fix CF in Eq. 3 and plot RWo against XW, where . Data was fit (non-linear curve fit) to Eq. 3 with fixed CF to determine τ.
Method B (full-range CF): Both the CF and τ are determined simultaneously, by plotting RWo versus XW and fitting the data (non-linear curve fit) to Eq. 3. An advantage of Method B over Method A is that camera CF is determined by using the full range of activity, without the need for an a priori assumption that any dataset is DT-free. Indeed, the activity or count rate thresholds below which DT is negligible is usually unknown beforehand.
Accuracy
For each phantom, with each acquisition, scatter correction and segmentation methods applied, the quantitative accuracy (i.e. percentage deviation of recovered activity from images from the known activity) was first evaluated when using the CF and τ derived from the respective set of conditions. Secondly, quantitative accuracy of SPECT data was assessed using CF and τ derived from planar calibration, in order to validate the latter as a practical calibration method.
Results
Planar-derived calibration factor and dead-time constant
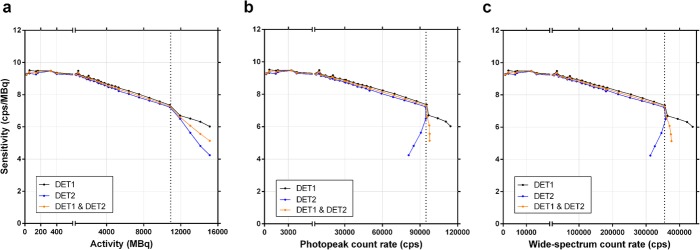
The planar sensitivity was plotted as a function of activity and of photopeak and wide spectrum count rates (Fig. 4). Even at low activity, the sensitivity is not affected by the background counts as the latter are efficiently eliminated along with the scatter counts by the scatter correction in planar mode (i.e. total image scatter counts subtracted from total image photopeak counts). Above a certain activity level, and the corresponding count rate levels (dotted lines), both detectors exhibited a sharp drop in sensitivity, and then a divergent behaviour, with Detector 2 suffering a more pronounced decrease in sensitivity. According to our SPECT/CT system vendor, this is due to the design of the system which results in Detector 1 being prioritized at high count rate. The dotted lines thus represent the maximum unattenuated activity which can be reliably quantified (10.8 GBq), and the maximum usable photopeak (94 kcps) and wide-spectrum (355 kcps) count rates of the system.
Method A (low-activity CF): CF was estimated by a linear fit forced through origin of RPo vs. activity, at low activity (< 500 MBq; Fig. 5), yielding 9.38 cps/MBq (both detectors averaged). With CF fixed, RWo was plotted against the term XW for both the photopeak and the 6W wide-spectrum count rate, yielding τ of 2.1 μs and 0.56 μs, respectively (Table 3; graphs are not shown, as they are virtually identical to Fig. 6).
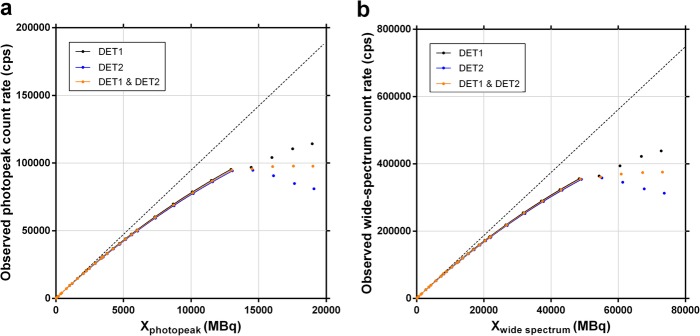
Method B (full-range CF): RWo was plotted against the term XW for both the photopeak and the 6W wide-spectrum count rates (Fig. 6). Fitting Eq. 3 to the data allowed to resolve CF and τ (Table 3). Method B, applied to planar images wide-spectrum count rate, yielded CF and τ values within 0.2% and 1.2%, respectively, of those derived from Method A, without the need to arbitrarily determine a DT-free subset of data.
Fig. 4.
Planar sensitivity (observed primary photons count rate per activity) as a function of activity (a), of photopeak count rate (187–229 keV; b) or 6-window wide-spectrum count rate (18–680 keV; c). The dotted line indicates the upper limit of the usable range. Data is shown for each detector separately, and averaged
Fig. 5.
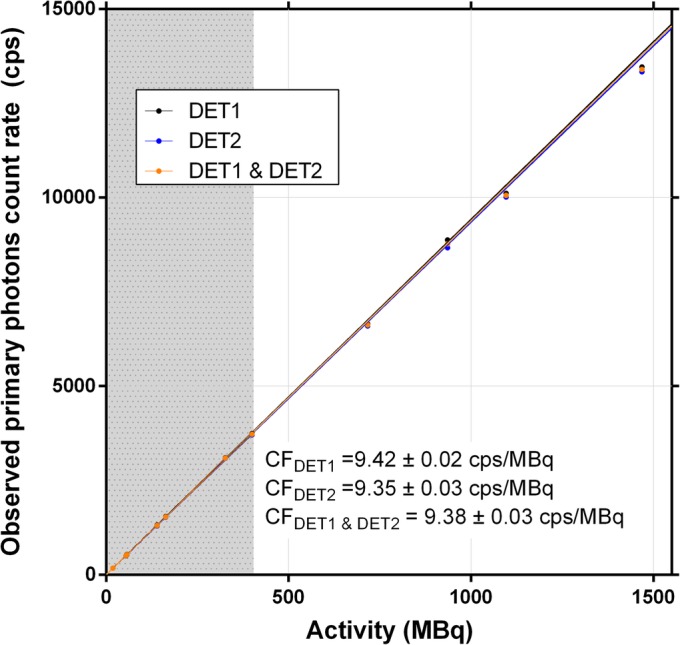
Observed primary photons count rate vs. activity for planar acquisitions. The calibration factor (CF) was obtained by linear fit forced through origin of low-activity data, i.e. a subset of the full activity range (grey zone, where dead time is less than 1%) as per Method A. Data is shown for each detector separately, and averaged
Table 3.
Calibration factor and dead-time constant (± SE) derived from planar images
| No. of acquisitions Activity range (MBq) Photopeak count rate range (cps) Wide-spectrum count rate range (cps) |
Detector | Calibration factor (cps/MBq) | Dead-time constant (μs) | ||||||
|---|---|---|---|---|---|---|---|---|---|
| Method A | Method B Photopeak |
Method B Wide-spectrum |
Method A Photopeak |
Method B Photopeak |
Method A Wide-spectrum |
Method B Wide-spectrum |
|||
| Low activity range | Full activity range | ||||||||
| 7 | 30 | 1 | 9.42 ± 0.02 | 9.49 ± 0.01 | 9.44 ± 0.01 | 2.00 ± 0.01 | 2.06 ± 0.01 | 0.541 ± 0.001 | 0.547 ± 0.002 |
| 19–400 | 19–10,809 | 2 | 9.35 ± 0.03 | 9.32 ± 0.01 | 9.27 ± 0.02 | 2.13 ± 0.01 | 2.10 ± 0.01 | 0.573 ± 0.002 | 0.553 ± 0.004 |
| 208–4049 | 208–94,800 | 1 and 2 | 9.38 ± 0.03 | 9.40 ± 0.01 | 9.36 ± 0.01 | 2.07 ± 0.01 | 2.08 ± 0.01 | 0.557 ± 0.002 | 0.550 ± 0.003 |
| 850–14,400 | 850–355,034 | ||||||||
Method A refers to obtaining the calibration factor at low activity, i.e. a subset of the full activity range (Eq. 1), then obtaining the dead-time constant over the full activity range by fitting the paralysable model to the data (Eq. 3). Method B refers deriving both the calibration factor and the dead-time constant through a single curve fit with data from the full activity range (Eq. 3). The acquisition count rate from either the photopeak or the wide spectrum (6W, 18–680 keV, Table 2) was considered for dead-time constant determination
Fig. 6.
Observed acquisition photopeak (a, 187–229 k) and wide-spectrum (b, 18–680 keV) count rates vs. XW . The term XW is the product of activity and observed acquisition count rate in a given window (photopeak or wide spectrum, respectively), divided by the observed primary photon count rate. Solid lines represent the non-linear curve fit forced through origin of Eq. 3 to the data in the usable system range, allowing to resolve the camera calibration factor and the dead-time constant as per Method B (full-range CF). Data is shown for each detector separately, and averaged. Dotted lines represent the average calibration factor for both detectors (a, 9.40 cps/MBq; b, 9.36 cps/MBq)
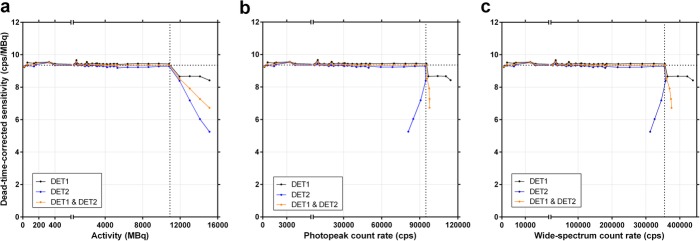
When plotting the DT-corrected planar sensitivity, using τ determined with Method B, the resulting curve behaviour confirms that the camera CF does not depend on the scanned activity and remains constant within the usable ranges of activity, photopeak and wide-spectrum count rates (Fig. 7). With CF and τ obtained with Method B, the average accuracy for recovering non-attenuated activity from DT-corrected planar images was 0.25 ± 0.62%.
Fig. 7.
Dead-time-corrected planar sensitivity (observed primary photons count rate per activity) in function of activity (a), photopeak count rate (b, 187–229 keV) and wide-spectrum count rate (c, 18–680 keV). The horizontal dotted lines indicate the averaged calibration factor for both detectors (9.4 cps/MBq). The vertical dotted lines indicate the last point within the usable operating ranges of the system. Data is shown for each detector separately, and averaged
Tomographic-derived calibration factor and dead-time constant
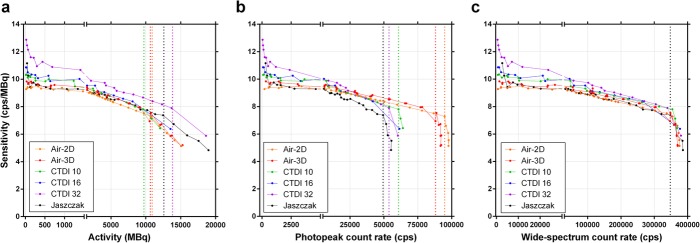
Using RPo of the entire reconstructed SPECT volume, the sensitivity was plotted against the activity, the acquisition photopeak and wide-spectrum count rates (Fig. 8). Unlike in planar mode, there was an upward tailing of tomographic sensitivity at low activity, which was more prominent for CTDI-32, the phantom having the largest volume of non-radioactive attenuating medium. Also, the maximum usable acquisition photopeak count rate (i.e. the point where sensitivity abruptly drops; Fig. 8b) appears clearly dependant on phantom geometry (volume of attenuating and scattering medium), while the maximum usable wide-spectrum count rate converges at approximately 350 kcps, regardless of geometry, and as it did in planar mode (Fig. 8c). This points towards the wide-spectrum count rate being a more appropriate, geometry-independent determinant of DT, as opposed to using the photopeak count rate for this purpose.
Fig. 8.
SPECT sensitivity (observed primary photons count rate per activity) as a function of activity (a), photopeak count rate (b, 187–226 keV) and wide-spectrum count rate (c, 18–680 keV). The vertical coloured dotted lines indicate, for each phantom, the maximum quantifiable activity and usable photopeak count rate, which are both geometry-dependant (a and b, respectively; those of the CTDI-16 phantom could not be precisely determined due to missing points at high activity). The vertical black dotted line corresponds to the unique, geometry-independent maximum wide-spectrum count rate of the SPECT system (c; ~350 kcps). Planar data (Air-2D, averaged for both detectors) is shown for comparison
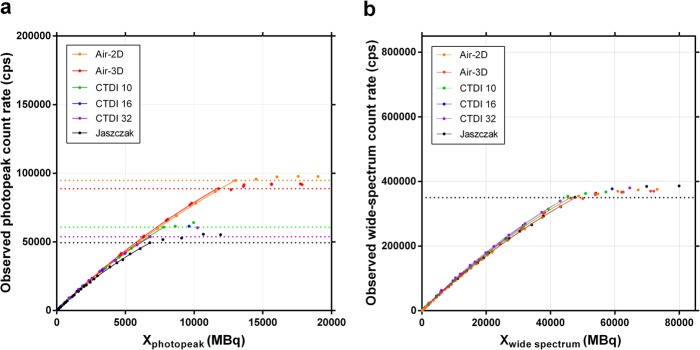
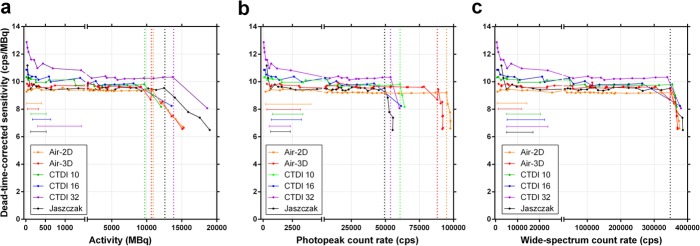
The SPECT data was processed using Methods A (low-activity CF) and B (full-range CF) for both the photopeak and the wide-spectrum (6W) acquisition count rates (Table 4). The DT curves are illustrated (Fig. 9, Method B), showing once again a clear geometry dependence of the photopeak RWo vs. XW relationship, and thus τ. Conversely, there is a geometry independence of the wide spectrum RWo vs. XW, and τ. When DT correction is applied to the reconstructed SPECT, as expected, the sensitivity response curves flatten (Fig. 10).
Table 4.
Calibration factor and dead-time constant (± SE) derived from SPECT data
| Phantom | Low activity | Full activity range | Calibration factor (cps/MBq) | Dead-time constant (μs) | |||||
|---|---|---|---|---|---|---|---|---|---|
| No. of acquisitions Activity range (MBq) Photopeak count rate range (cps) Wide-spectrum count rate range (cps) |
Method A | Method B Photopeak |
Method B Wide-spectrum |
Method A Photopeak |
Method B Photopeak |
Method A Wide-spectrum |
Method B Wide-spectrum |
||
| Air-3D |
7 32-330 327-3154 1342-11,975 |
27 32-10,704 327-88,762 1342-347,060 |
9.62 ± 0.04 | 9.70 ± 0.03 | 9.67 ± 0.03 | 2.07 ± 0.01 | 2.15 ± 0.03 | 0.531 ± 0.003 | 0.544 ± 0.008 |
| CTDI-10 |
4 126-510 800-3423 5229-20,267 |
19 13-9646 93-60,750 665-354,256 |
9.91 ± 0.06 | 9.72 ± 0.03 | 9.70 ± 0.03 | 3.18 ± 0.02 | 2.93 ± 0.04 | 0.546 ± 0.005 | 0.499 ± 0.008 |
| CTDI-16 |
5 157-634 693-3302 5523-22,333 |
16 16-80,94 83-41,651 694-264,231 |
9.98 ± 0.09 | 9.84 ± 0.05 | 9.85 ± 0.06 | 3.77 ± 0.06 | 3.28 ± 0.12 | 0.603 ± 0.010 | 0.528 ± 0.024 |
| CTDI-32 |
4 293-1404 522-2364 5226-23,734 |
20 21-13,708 50-53,746 513-339,364 |
10.66 ± 0.09 | 10.19 ± 0.05 | 10.23 ± 0.04 | 4.47 ± 0.08 | 3.71 ± 0.07 | 0.705 ± 0.011 | 0.594 ± 0.012 |
| Jaszczak |
5 120-526 624-2335 4972-17,052 |
26 44-12,480 307-49,376 2650-348,334 |
9.50 ± 0.05 | 9.40 ± 0.05 | 9.46 ± 0.04 | 4.07 ± 0.04 | 4.04 ± 0.09 | 0.572 ± 0.005 | 0.565 ± 0.010 |
Method A refers to obtaining the calibration factor at low activity, i.e. a subset of the full activity range (Eq. 1), then obtaining the dead-time constant over the full activity range by fitting the data to the paralysable model (Eq. 3). Method B refers deriving both the calibration factor and the dead-time constant through a single curve fit using data from the full activity range (Eq. 3). The acquisition count rate from either the photopeak or the wide spectrum (6W, 18–680 keV, Table 2) was considered for dead-time constant determination
Fig. 9.
Observed photopeak (a, 187–226 keV) and wide-spectrum (b, 18–680 keV) count rates vs. XW. The term XW is the product of activity and observed acquisition count rate (photopeak or wide-spectrum), divided by the observed primary photon count rate (Eq. 3). Coloured horizontal dotted lines indicate the maximum usable observed photopeak count rates, which is geometry-dependant (a; that of the CTDI-16 phantom could not be precisely determined due to missing points at high activity). The black horizontal dotted line corresponds to the unique, geometry-independent maximum wide-spectrum count rate (b). Planar data (Air-2D, averaged for both detectors) is shown for comparison
Fig. 10.
Dead-time-corrected SPECT sensitivity (observed primary photons count rate per activity) as a function of activity (a), photopeak count rate (b, 187–226 keV) and wide-spectrum count rate (c, 18–680 keV). The vertical coloured dotted line indicates, for each phantom, the maximum quantifiable activity and usable photopeak count rate, which are both geometry-dependant (a and b, respectively; those of the CTDI-16 phantom could not be precisely determined due to missing points at high activity). The vertical black dotted line corresponds to the unique, geometry-independent maximum wide-spectrum count rate of the SPECT system (c; ~350 kcps). The capped horizontal lines show, for each phantom, the low-count rate acquisition data points that could be used for calibration factor determination with Method A (low-activity CF; Table 4), i.e. data points with less than 1% dead time but without excessive sensitivity overestimation (upward tailing) at very low count rate (Table 4). Planar data (Air-2D, averaged for both detectors) is shown for comparison
When applying CF and τ computed for each tomographic phantom individually, or these parameters derived from planar calibration (using Method B—full-range CF), the average accuracy for quantifying the total activity in the entire field of view (i.e. unsegmented) for all tomographic acquisitions was 0.47 ± 2.23% and − 0.02 ± 2.60%, respectively. For the Jaszczak phantom, which is considered the most clinically relevant geometry (activity dispersed in a large volume of attenuating medium), and using the planar-derived factors, the quantitative accuracy was 0.71 ± 1.18%.
Segmentation
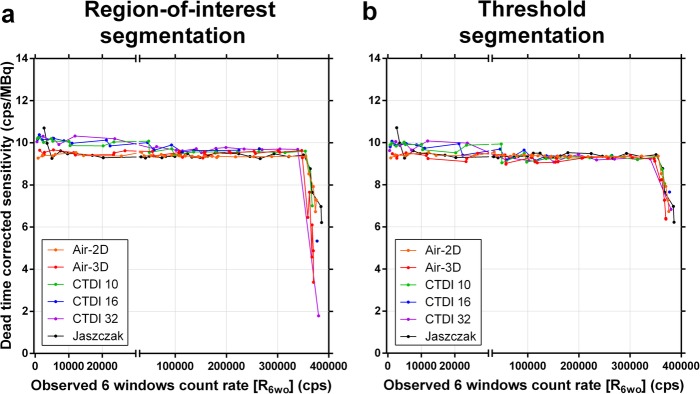
Characteristic artefacts could be observed in the reconstructed SPECT images (Fig. 11). In particular, in SPECT, excessive low-level background activity was seen in areas of non-radioactive dense medium, e.g. CTDI phantoms, Jaszczak phantom wall, and camera bed (Fig. 11a, c). This phenomenon is likely due to suboptimal scatter correction and was more pronounced with increased CTDI phantom size and at low activities or count rates [20]. This resulted in overestimated sensitivity when compiling the primary photons count rate from the entire SPECT field of view (Table 4, Figs. 8 and 10). To compensate for this phenomenon by eliminating the spurious background counts, segmentation of activity was applied to SPECT images using two techniques (ROI and threshold techniques) and data was re-analysed. CF and τ were determined for each segmentation technique and phantom (Table 5), and DT-corrected sensitivity was plotted against RWo (Fig. 12). For both segmentation techniques, sensitivity overestimation, including the upward tailing at very low activity, was greatly diminished. Furthermore, CF and τ were much less geometry-dependant, in particular for the CTDI phantoms, and tended to converge towards the planar CF and τ. In particular, the CF and τ of the segmented Jaszczak phantom were within 1% and 3%, respectively, of the planar data.
Fig. 11.
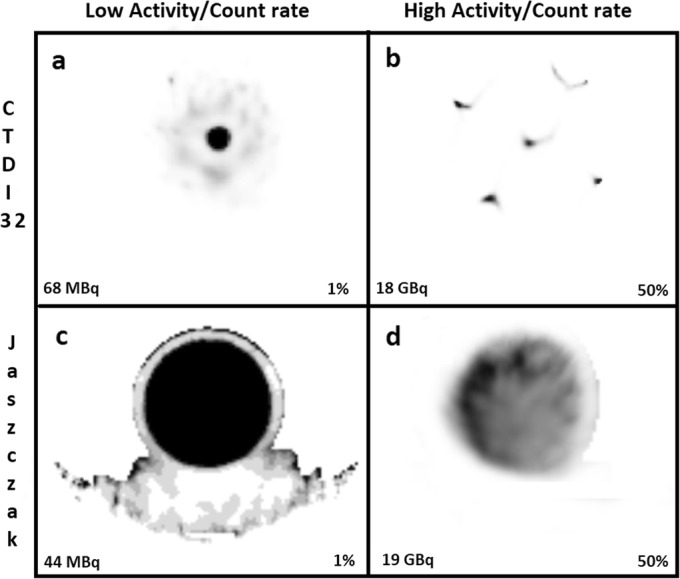
Artefacts on SPECT images of CTDI-32 (a and b) and Jaszczak (c and d) phantoms. Background activity is seen in areas of non-radioactive dense medium and the phenomenon is relatively more pronounced at very low activity (a and c). Streak (b) and non-uniformity (d) artefacts were see at very high count rates that were above the usable rage of the system. The images are normalized to the percentage of maximum voxel value indicated in each panel
Table 5.
Camera calibration factor and dead-time constant (± SE) derived from segmented SPECT images
| Phantom | 18–680 keV wide spectrum & TEW | |||
|---|---|---|---|---|
| Region-of-interest segmentation | Threshold segmentation | |||
| Calibration factor (cps/MBq) | Dead-time constant (μs) | Calibration factor (cps/MBq) | Dead-time constant (μs) | |
| Air-3D | 9.51 ± 0.06 | 0.570 ± 0.014 | 9.25 ± 0.05 | 0.577 ± 0.012 |
| CTDI-10 | 9.58 ± 0.04 | 0.535 ± 0.010 | 9.30 ± 0.07 | 0.578 ± 0.016 |
| CTDI-16 | 9.68 ± 0.06 | 0.522 ± 0.023 | 9.36 ± 0.08 | 0.512 ± 0.032 |
| CTDI-32 | 9.69 ± 0.04 | 0.538 ± 0.009 | 9.25 ± 0.05 | 0.516 ± 0.016 |
| Jaszczak | 9.39 ± 0.04 | 0.568 ± 0.011 | 9.38 ± 0.05 | 0.565 ± 0.013 |
Method B (full-range CF), with wide-spectrum (18–680 keV) acquisition count rate, was used to derive the calibration factor and the dead-time constant. TEW: Triple-energy window scatter correction
Fig. 12.
Dead-time-corrected SPECT sensitivity (observed primary photons count rate per activity) as a function of observed wide-spectrum count rate when activity segmentation was applied to the reconstructed SPECT images by drawing circular regions of interest around source regions (a), or by thresholding at one percent of maximum voxel (b). Planar data (Air-2D, averaged for both detectors) is shown for comparison
When applying CF and τ derived from planar calibration (using Method B—full-range CF), the average accuracy for quantifying the total activity in the ROI-segmented or Threshold-segmented tomographic images was 0.09 ± 2.53% and 0.04 ± 2.31%, respectively. For the Jaszczak phantom only, it was 0.24 ± 1.06% and 0.02 ± 1.10%, respectively.
Impact of the width of wide-spectrum window and scatter correction method
The span of the wide-spectrum RWo monitoring window W was successively reduced from 18–680 keV (6W, Table 2) to 55–250 keV (4W, Table 6), and to 55–229 keV (3W, Table 6) by limiting the number of summed acquisition energy windows. TEW (6W and 4W) or DEW (3W) scatter correction method was used to obtain RPo for planar acquisitions (Air-2D) and segmented SPECT reconstructions (threshold-based segmentation; Method B—full-range CF and τ determination). Whether using phantom-specific CF and τ (Fig. 13) or common CF and τ derived from the planar data (Fig. 14), the quantification appears similarly accurate between the 6W, 4W and 3W schemes. However, the data points are slightly more dispersed around the identity line with the 3W scheme that also includes DEW using the planar CF and τ (Fig. 14c). The red-shaded zones represent the ranges where quantification is less accurate (>10% error), because of overestimation at low count rate, or underestimation above the maximum usable count rate (Fig. 13 and 14). Average accuracy (± SD) of pooled data points between these boundaries, computed using planar CF and τ (Fig. 14) was: 0.04 ± 2.31% for 6W/TEW, − 0.13 ± 2.29% for 4W/TEW, and 0.26 ± 2.51% for 3W/DEW.
Table 6.
Camera calibration factor and dead-time constant (± SE) derived from planar and threshold-segmented SPECT data with reduced wide-spectrum window width
| Phantom | 55–250 keV wide spectrum and TEW | 55–229 keV wide spectrum and DEW | ||
|---|---|---|---|---|
| Calibration factor (cps/MBq) | Dead-time constant (μs) | Calibration factor (cps/MBq) | Dead-time constant (μs) | |
| Air-2Da | 9.36 ± 0.01 | 0.632 ± 0.003 | 9.54 ± 0.01 | 0.534 ± 0.003 |
| Air-3D | 9.19 ± 0.05 | 0.638 ± 0.014 | 9.39 ± 0.05 | 0.565 ± 0.018 |
| CTDI-10 | 9.30 ± 0.07 | 0.686 ± 0.019 | 9.48 ± 0.07 | 0.555 ± 0.021 |
| CTDI-16 | 9.35 ± 0.08 | 0.606 ± 0.038 | 9.54 ± 0.08 | 0.462 ± 0.041 |
| CTDI-32 | 9.31 ± 0.06 | 0.658 ± 0.020 | 9.44 ± 0.07 | 0.476 ± 0.026 |
| Jaszczak | 9.38 ± 0.05 | 0.673 ± 0.015 | 9.70 ± 0.06 | 0.496 ± 0.029 |
TEW: triple-energy window scatter correction. DEW: dual-energy windows scatter correction. Method B (full-range CF), with wide-spectrum acquisition count rate, was used to derive the calibration factor and the dead-time constant. aPlanar images of Air-2D phantom were not segmented, and data from both detectors was averaged
Fig. 13.
Accuracy of recovered activity (calculated with phantom-specific calibration factor and dead-time constant) from dead-time-corrected planar and SPECT images using 3 different energy window widths for wide-spectrum count rate monitoring: 18–680 keV (a) to 55–250 keV (b), and to 55–229 keV (c). TEW (a and b) or DEW (c) scatter correction was used. The red shaded regions indicate the count ranges where errors were above 10% occurred
Fig. 14.
Accuracy of recovered activity (calculated with common calibration factor and dead-time constant derived from planar data) from dead-time-corrected planar and SPECT images using 3 different energy window widths for wide-spectrum count rate monitoring: 18–680 keV (a) to 55–250 keV (b), and to 55–229 keV (c). TEW (a and b) or DEW (c) scatter correction was used. The red shaded regions indicate the count ranges where errors above 10% occurred
Discussion
QSPECT is the state-of-the-art method for 177Lu internal dosimetry, either through QSPECT-only protocols, or hybrid methods relying on multiple time-points planar imaging in conjunction with one QSPECT to scale the planar-derived time-activity curves [29, 30]. Whereas careful CF determination is obviously key to accurate quantification, the DT correction improves the accuracy [8]. Our data and our experience with personalized PRRT show that DT must be compensated for to maximize accuracy of dose estimates, not only when administering high personalized activities, but also lower activities (such as 7.4 GBq) in patients with a very high tumour retention in whom the majority of activity can be contained within the SPECT field of view [7]. In our practice, the DT correction factor exceeds 1.05 in 15% of patients at 24 hours after injection, and values as high as 1.30 have been observed (i.e. up to 23% underestimation if no DT correction applied; full data will be published separately). We have developed practical methods to calibrate a SPECT/CT system for 177Lu-QSPECT, including DT correction based on wide-spectrum acquisition count rate, which we further refined here [8]. Furthermore, QSPECT data can be very conveniently viewed and analysed after converting the reconstructed SPECT volume into PET-like dataset (i.e. PT DICOM modality) in which the rescale slope factor that integrates acquisition time, voxel volume, CF, and DT correction factor is added to the DICOM header, which then allows for displaying images representing count data in units of Bq/mL or standardized uptake values.
It has been previously shown that QSPECT CF can be determined from SPECT or planar images [9, 17, 20]. Our results confirm that a planar-based calibration consisting of serial planar imaging of sources in air over the entire operational range of the system also enables to resolve τ to generate a lookup table of DT correction factor for primary (reconstructed) counts vs. wide-spectrum acquisition count rate. For both CF and τ, the agreement is particularly excellent between planar- and Jaszczak-derived values. We previously obtained a larger CF of 10.8 MBq/cps for the same SPECT/CT system, which was obtained using serial SPECT/CT acquisitions of point-sources, surrounded by attenuating medium in the majority of acquisitions [8]. The latter result is consistent with that obtained here with the CDTI-32 phantom (10.2 cps/MBq) with no segmentation applied, resulting in a slight CF overestimation. Our comprehensive study with a variety of phantoms shows that CF and τ derived from tomographic or planar acquisitions tend to converge when segmentation is applied to tomographic data. Indeed, TEW or DEW scatter correction is less effective to get rid of the background counts in areas of dense, non-radioactive medium, leading to overestimated sensitivity when background noise is not excluded by mean of segmentation [17, 20, 26, 31, 32]. We have a preference for the threshold-based segmentation method because the SPECT-derived CF tended to be more consistent among the various phantom geometries, as well as with the planar CF. While planar calibration is more practical for camera calibration, we recommend performing at least one or a few SPECT acquisitions, ideally of an attenuating phantom containing DT-generating activities, to validate the planar-derived parameters.
Our prior results, and more convincingly the data presented here, clearly show that a wide-spectrum count rate monitoring approach must be adopted to accurately correct for DT using a single, geometry-independent τ [8]. Indeed, photons of any energy recordable by the system generate DT and, for a given activity, the shape of the energy spectrum histogram is highly impacted by the volume of attenuating matter. While sources in air are not representative of a clinical situation, the CTDI and Jaszczak phantoms are informative in that regard. Patient geometry can vary from the air-filled thorax of a cachexic patient to the abdomen of an overweight patient. Furthermore, scatter from high activity outside the field of view (e.g. bladder or abdominal tumours while imaging the thorax) can cause DT that cannot be accurately estimated if monitoring only the photopeak or primary count rate. Wide-spectrum count rate is ideally monitored over the entire recordable range of energy (e.g. our 6W range) or a range collecting the vast majority of counts (e.g. our 4W range), for a given radionuclide and SPECT/CT system. It is important to emphasize that the τ obtained by our methods is not meant to estimate the DT affecting the wide-spectrum acquisition count rate itself (in which case we would have obtained 0.285 ± 0.004 μs here, similar to 0.19 ± 0.18 or 0.40 ± 0.25 μs obtained previously with the same system [21]), but only the DT affecting the primary count rate (i.e. those from the scatter-corrected planar or reconstructed SPECT images) that is also affected by pulse pile-up which amplifies the primary count losses relative to the wide spectrum. Besides, we found that TEW seems marginally more accurate than DEW (0.04% and − 0.13% for TEW, vs. 0.26% for DEW) as a scatter correction method, likely due to better subtraction of piled-up counts monitored by the upper scatter window.
The motivation to devise Method B (full-range CF) for CF and τ determination was to use the full range of clinically relevant 177Lu activities to calibrate the system with serial SPECT acquisitions [8]. Determining CF separately from τ, i.e. at low activity for which DT is assumed to be negligible, as per Method A (low-activity CF), may result in overestimation of CF because the background noise is ineffectively eliminated by scatter correction of tomographic data in low-count conditions. This is not an issue with planar calibration because TEW-correction of photopeak counts (i.e. primary counts) at the field of view level is effectively eliminating this background noise at low activity. But, even then, the activity level below which DT can be assumed to be negligible (as it is never null), needs to be determined arbitrarily. Determining both CF and τ in a single regression, as per Method B (full-range CF), is a practical way to circumvent this limitation.
SPECT quantification at very low count rate remains of limited accuracy, which is in agreement with Robinson et al. [31]. At high counting rate, the pile-up effect contributes to primary photon count losses in addition to the processing DT of the system. Our data clearly shows that the paralysable model based on wide-spectrum acquisition count rate is nevertheless able to accurately estimate lost primary photon counts regardless of the cause, up to the maximum usable wide-spectrum count rate (~ 350 kcps) of the system. As observed by others, the actual maximum count rate was lower than the theoretical one (1/e · 0.550 μs = 669 kcps for our system), which emphasizes the need to experimentally measure it to fully characterize the system [16]. Beyond that point quantification is not possible and, with our SPECT/CT system, the image is distorted because of the divergent detector behaviour (Fig. 5, 7, 8 and 12) [16, 24].
With its low abundance of medium-energy gamma emissions, 177Lu is an ideal therapeutic beta-emitting radionuclide for quantitative imaging, as compared to other common beta radionuclides such 90Y (bremsstrahlung challenging to quantify) or 131I (very high abundance of high-energy gammas). Practical calibration methods for existing SPECT/CT systems, along with simplification of dosimetry protocols, could accelerate clinical research and enable widespread practice of personalized 177Lu radionuclide therapy, which is likely to further improve the clinical benefits.
Conclusion
We have shown that a comprehensive, accurate and practical calibration of a SPECT/CT system for 177Lu-QSPECT can be accomplished with serial planar acquisitions of sources in air. The latter must have a sufficient total activity to exceed the full operational counting range of the system in order to determine a reliable τ based on wide-spectrum count rate, as DT correction is essential for accurate quantification in a post-therapy setting, as well as to measure the maximum counting rate of the system. QSPECT enables fully exploiting the theranostic properties of 177Lu, which constitute a significant advantage over other therapeutic radionuclides.
Acknowledgements
We express our gratitude to Simon Guérette, nuclear medicine technologist at the CHU de Québec – Université Laval, who helped with the manipulations and acquisitions. We are grateful to Radiation Safety Unit of CHU de Québec – Université Laval, for overseeing the radioprotection aspects of our work. We thank Alexander Hans Vija, from Siemens Healthineers, for his insight regarding the SPECT/CT system behaviour.
Abbreviations
- CF
Calibration factor
- CTDI
Computed tomography dose index
- DT
Dead time
- DEW
Dual-energy window
- PRRT
Peptide receptor radionuclide therapy
- QSPECT
Quantitative single-photon emission computed tomography
- ROI
Region of interest
- TEW
Triple-energy window
Authors’ contributions
A.F. participated in the design of the study, collected and analysed the data, and drafted the manuscript. C.D. helped with data collection and analysis. P.D., W.Z., C.U. and A.C. participated in the design of the study. J.M.B. designed the study, supervised the project, analysed the data, and edited the manuscript. All authors read and approved the final manuscript.
Funding
J.M.B. is supported by a Clinical Research Scholarship from the Fonds de recherche du Québec – Santé. This work was funded by the Canadian Institutes of Health Research (CIHR) operating grant MOP-142233 to J.M.B.
Availability of data and materials
Please contact the corresponding author for the data used in this manuscript.
Ethics approval and consent to participate
Not applicable
Consent for publication
All authors read the manuscript and consented for its publication.
Competing interests
The authors declare that they have no competing interests.
Footnotes
Publisher’s Note
Springer Nature remains neutral with regard to jurisdictional claims in published maps and institutional affiliations.
References
- 1.Strosberg J, El-Haddad G, Wolin E, Hendifar A, Yao J, Chasen B, et al. Phase 3 trial of 177Lu-Dotatate for midgut neuroendocrine tumors. N Engl J Med. 2017;376(2):125–135. doi: 10.1056/NEJMoa1607427. [DOI] [PMC free article] [PubMed] [Google Scholar]
- 2.Kwekkeboom DJ, de Herder WW, Kam BL, van Eijck CH, van Essen M, Kooij PP, et al. Treatment with the radiolabeled somatostatin analog [177Lu-DOTA0,Tyr3] octreotate: toxicity, efficacy, and survival. J Clin Oncol. 2008;26(13):2124–2130. doi: 10.1200/JCO.2007.15.2553. [DOI] [PubMed] [Google Scholar]
- 3.Sandstrom M, Garske-Roman U, Granberg D, Johansson S, Widstrom C, Eriksson B, et al. Individualized dosimetry of kidney and bone marrow in patients undergoing 177Lu-DOTA-octreotate treatment. J Nucl Med. 2013;54(1):33–41. doi: 10.2967/jnumed.112.107524. [DOI] [PubMed] [Google Scholar]
- 4.Sundlov A, Sjogreen-Gleisner K, Svensson J, Ljungberg M, Olsson T, Bernhardt P, et al. Individualised 177Lu-DOTATATE treatment of neuroendocrine tumours based on kidney dosimetry. Eur J Nucl Med Mol Imaging. 2017;44(9):1480–1489. doi: 10.1007/s00259-017-3678-4. [DOI] [PMC free article] [PubMed] [Google Scholar]
- 5.Del Prete M, Buteau FA, Arsenault F, Saighi N, Bouchard LO, Beaulieu A, et al. Personalized 177Lu-octreotate peptide receptor radionuclide therapy of neuroendocrine tumours: initial results from the P-PRRT trial. Eur J Nucl Med Mol Imaging. 2019;46(3):728–742. doi: 10.1007/s00259-018-4209-7. [DOI] [PubMed] [Google Scholar]
- 6.Hofman MS, Violet J, Hicks RJ, Ferdinandus J, Thang SP, Akhurst T, et al. [177Lu]-PSMA-617 radionuclide treatment in patients with metastatic castration-resistant prostate cancer (LuPSMA trial): a single-centre, single-arm, phase 2 study. Lancet Oncol. 2018;19(6):825–833. doi: 10.1016/S1470-2045(18)30198-0. [DOI] [PubMed] [Google Scholar]
- 7.Del Prete M, Arsenault F, Saighi N, Zhao W, Buteau FA, Celler A, et al. Accuracy and reproducibility of simplified QSPECT dosimetry for personalized 177Lu-octreotate PRRT. EJNMMI Phys. 2018;5:25. doi: 10.1186/s40658-018-0224-9. [DOI] [PMC free article] [PubMed] [Google Scholar]
- 8.Beauregard JM, Hofman MS, Pereira JM, Eu P, Hicks RJ. Quantitative 177Lu SPECT (QSPECT) imaging using a commercially available SPECT/CT system. Cancer Imaging. 2011;11:56–66. doi: 10.1102/1470-7330.2011.0012. [DOI] [PMC free article] [PubMed] [Google Scholar]
- 9.Ljungberg M, Celler A, Konijnenberg MW, Eckerman KF, Dewaraja YK, Sjogreen GK. MIRD pamphlet no. 26: joint EANM/MIRD guidelines for quantitative 177Lu SPECT applied for dosimetry of radiopharmaceutical therapy. J Nucl Med. 2015;9881(26):151–162. doi: 10.2967/jnumed.115.159012. [DOI] [PubMed] [Google Scholar]
- 10.Dewaraja YK, Frey EC, Sgouros G, Brill B, Roberson P, Zanzonico PB, et al. MIRD pamphlet no. 23: quantitative SPECT for patient-specific 3-dimensional dosimetry in internal radionuclide therapy. J Nucl Med. 2012;53(8):1310–1325. doi: 10.2967/jnumed.111.100123. [DOI] [PMC free article] [PubMed] [Google Scholar]
- 11.Ogawa K, Harata Y, Ichihara T, Kubo A, Hashimoto S. A practical method for position-dependent Compton-scatter correction in single photon emission CT. IEEE Trans Med Imaging. 1991;10(3):408–412. doi: 10.1109/42.97591. [DOI] [PubMed] [Google Scholar]
- 12.Smith MF, Jaszczak RJ. Generalized dual-energy-window scatter compensation in spatially varying media for spect. Phys Med Biol. 1994;39(3):531. doi: 10.1088/0031-9155/39/3/016. [DOI] [PubMed] [Google Scholar]
- 13.Ichihara T, Ogawa K, Motomura N, Kubo A, Hashimoto S. Compton scatter compensation using the triple-energy window method for single- and dual-isotope SPECT. J Nucl Med. 1993;34(12):2216–2221. [PubMed] [Google Scholar]
- 14.de Nijs R, Lagerburg V, Klausen TL, Holm S. Improving quantitative dosimetry in 177Lu-DOTATATE SPECT by energy window-based scatter corrections. Nucl Med Commun. 2014;35(5):522–533. doi: 10.1097/MNM.0000000000000079. [DOI] [PMC free article] [PubMed] [Google Scholar]
- 15.Hutton BF, Buvat I, Beekman FJ. Review and current status of SPECT scatter correction. Phys Med Biol. 2011;56:R85–112. doi: 10.1088/0031-9155/56/14/R01. [DOI] [PubMed] [Google Scholar]
- 16.Silosky M, Johnson V, Beasley C, Kappadath SC. Characterization of the count rate performance of modern gamma cameras. Med Phys. 2013;40(3):32502. doi: 10.1118/1.4792297. [DOI] [PMC free article] [PubMed] [Google Scholar]
- 17.Uribe CF, Esquinas PL, Tanguay J, Gonzalez M, Gaudin E, Beauregard JM, et al. Accuracy of 177Lu activity quantification in SPECT imaging: a phantom study. EJNMMI Phys. 2017;4(1):2. doi: 10.1186/s40658-016-0170-3. [DOI] [PMC free article] [PubMed] [Google Scholar]
- 18.Halty A, Badel JN, Kochebina O, Sarrut D. Image-based SPECT calibration based on the evaluation of the Fraction of Activity in the Field of View. EJNMMI Phys. 2018;5(1):11. doi: 10.1186/s40658-018-0209-8. [DOI] [PMC free article] [PubMed] [Google Scholar]
- 19.D’Arienzo M, Cazzato M, Cozzella ML, Cox M, D’Andrea M, Fazio A, et al. Gamma camera calibration and validation for quantitative SPECT imaging with 177Lu. Appl Radiat Isot. 2016;112:156–164. doi: 10.1016/j.apradiso.2016.03.007. [DOI] [PubMed] [Google Scholar]
- 20.Zhao W, Esquinas PL, Hou X, Uribe CF, Gonzalez M, Beauregard JM, Dewaraja YK, Celler A. Determination of gamma camera calibration factors for quantitation of therapeutic radioisotopes. EJNMMI Phys. 2018;5(1):8. doi: 10.1186/s40658-018-0208-9. [DOI] [PMC free article] [PubMed] [Google Scholar]
- 21.Uribe CF, Esquinas PL, Gonzalez M, Zhao W, Tanguay J, Celler A. Deadtime effects in quantification of 177Lu activity for radionuclide therapy. EJNMMI Phys. 2018;5(1):2. doi: 10.1186/s40658-017-0202-7. [DOI] [PMC free article] [PubMed] [Google Scholar]
- 22.Celler A, Piwowarska-Bilska H, Shcherbinin S, Uribe C, Mikolajczak R, Birkenfeld B. Evaluation of dead-time corrections for post-radionuclide-therapy 177Lu quantitative imaging with low-energy high-resolution collimators. Nucl Med Commun. 2014;35(1):73–87. doi: 10.1097/MNM.0000000000000011. [DOI] [PubMed] [Google Scholar]
- 23.Willowson K, Bailey DL, Baldock C. Quantitative SPECT reconstruction using CT-derived corrections. Phys Med Biol. 2008;53(12):3099–3112. doi: 10.1088/0031-9155/53/12/002. [DOI] [PubMed] [Google Scholar]
- 24.Cherry SR, Sorenson J, Phelps ME. Physics in nuclear medicine. 4. Philadelphia, PA: Elsevier Saunders; 2012. p. 544. [Google Scholar]
- 25.Shope TB, Gagne RM, Johnson GC. A method for describing the doses delivered by transmission x-ray computed tomography. Med Phys. 1981;8(4):488–495. doi: 10.1118/1.594995. [DOI] [PubMed] [Google Scholar]
- 26.Karimi Ghodoosi E, D'Alessandria C, Li Y, Bartel A, Köhner M, Höllriegl V, et al. The effect of attenuation map, scatter energy window width, and volume of interest on the calibration factor calculation in quantitative 177Lu SPECT imaging: Simulation and phantom study. Phys Med. 2018;56:74–80. doi: 10.1016/j.ejmp.2018.11.009. [DOI] [PubMed] [Google Scholar]
- 27.Sorenson J. Deadtime characteristics of Anger cameras. J Nucl Med. 1975;16(4):284–288. [PubMed] [Google Scholar]
- 28.Arnold JE, Johnston AS, Pinsky SM. The influence of true counting rate and the photopeak fraction of detected events on Anger camera deadtime. J Nucl Med. 1974;15(6):412–416. [PubMed] [Google Scholar]
- 29.Berker Y, Goedicke A, Kemerink GJ, Aach T, Schweizer B. Activity quantification combining conjugate-view planar scintigraphies and SPECT/CT data for patient-specific 3-D dosimetry in radionuclide therapy. Eur J Nucl Med Mol Imaging. 2011;38(12):2173–2185. doi: 10.1007/s00259-011-1889-7. [DOI] [PubMed] [Google Scholar]
- 30.Lehnert W, Schmidt K, Kimiaei S, Meyer T, Bronzel M, Kluge A. Impact of Modality (2D Planar, 2D/3D Hybrid, 3D SPECT) on Kidneys Absorbed Dose in 177Lu-based PRRT. J Nucl Med. 2018;59(Suppl. 1):391. [Google Scholar]
- 31.Robinson AP, Tipping J, M Cullen D, Hamilton D. The influence of triple energy window scatter correction on activity quantification for 177Lu molecular radiotherapy. Phys Med Biol. 2016;61:5107–5127. doi: 10.1088/0031-9155/61/14/5107. [DOI] [PubMed] [Google Scholar]
- 32.Marin G, Vanderlinden B, Karfis I, Guiot T, Wimana Z, Flamen P, et al. Accuracy and precision assessment for activity quantification in individualized dosimetry of 177Lu-DOTATATE therapy. EJNMMI Phys. 2017;4:7. doi: 10.1186/s40658-017-0174-7. [DOI] [PMC free article] [PubMed] [Google Scholar]
Associated Data
This section collects any data citations, data availability statements, or supplementary materials included in this article.
Data Availability Statement
Please contact the corresponding author for the data used in this manuscript.


