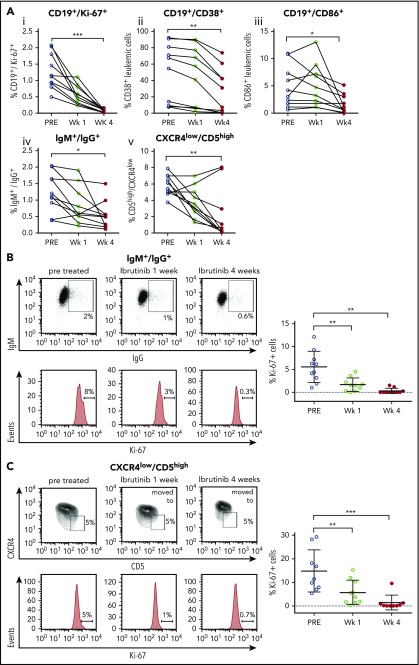
Figure 1.
Studies of proliferative CLL subsets during ibrutinib treatment of patients with CLL. Peripheral blood samples from patients with CLL before and after 1 and 4 weeks postibrutinib treatment were centrifuged in Ficoll gradient, and total MCs obtained were next analyzed by flow cytometry, using the different markers detailed here. Leukemic cells were discriminated by gating lymphocytes and by labeling CD19 plus CD5. (A) Ki-67+ (i), CD38 (ii), CD86 (iii), or CXCR4 (v) surface expression was evaluated in the 3 points depicted. Results are shown as percentages of CD19+/CD5+/Ki-67+ cells (i), CD19+/CD5+/CD38+ cells (ii), CD19+/CD5+/CD86+ cells (iii), or CD19+/CXCR4low/CD5high cells (v) by fixing the gate at the pretreated condition. (iv) Intracellular labeling of IgM plus IgG was performed where percentages of CD19+/IgM+/IgG+ cells before and after treatment is shown. As depicted for CD19+/Ki-67+, CD19+/CD38+; CD19+/CD86+, IgM+/IgG+, and CXCR4lowCD5high, the P values were P ≤ .0001, P = .001, P = .011; P = .016, and P = .005; respectively (n = 10). Each dot represents a single patient sample (*P < .05; ** P < .005; 2-tailed, Student paired t test). (B) Intracellular staining of Ki-67 was developed in CD19+/IgM+/IgG+ cells. Shown are representative dot plots and Ki-67 histograms in a representative patient (left) and the statistical analysis of the entire cohort evaluated (right part), where each dot represents a single patient sample. Pretreated IgM+/IgG+/Ki67+ was 5.6% vs 1.7% at 1 week (mean difference, 3.9; 95% confidence interval [CI], 1.5-6.3; P = .0013), whereas at 4 weeks, it was 0.3% (mean difference, 3.9; 95% CI, 2.9-7.6; P ≤ .0001; n = 10; 1-way ANOVA, multiple comparisons test). (C) Intracellular staining of Ki-67 was developed in CD19+CD5high/CXCR4low cells. Shown are representative dot plots and Ki-67 histograms in a representative patient (left part) and the statistical analysis of the entire cohort (right part), where each dot represents a single patient sample. For CXCR4lowCD5high, the mean proportion of cells expressing Ki-67 at pretreatment is 14.9% vs 5.8% at week 1 (mean difference, 9.1; 95% CI, 2.4-15.7; P = .042); and for week 4, 1.36%, with a mean difference of 13.5 (95% CI, 6.7-20.3; P = .017; n = 10; 1-way ANOVA, multiple comparisons test).

