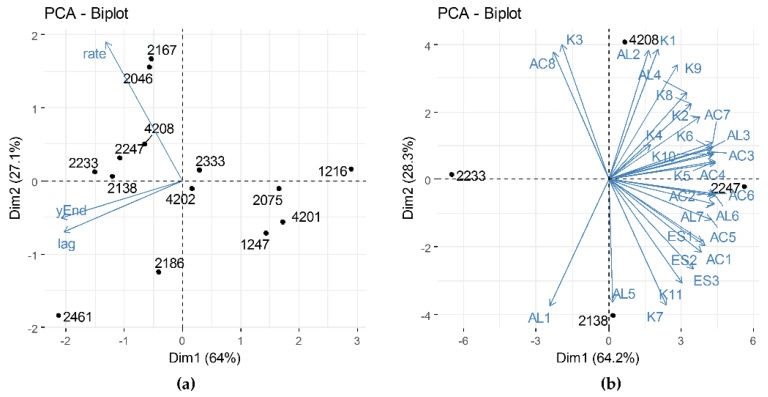
Figure 4.
Principal component analysis (PCA) biplot of (a) impedometric parameters for each strain and (b) of the identified volatile compounds in the selected strains. Position of each strain is reported as a black dot, blue arrows represent variables. For panel (b), variable abbreviations are as reported in Supplementary Table S1.

