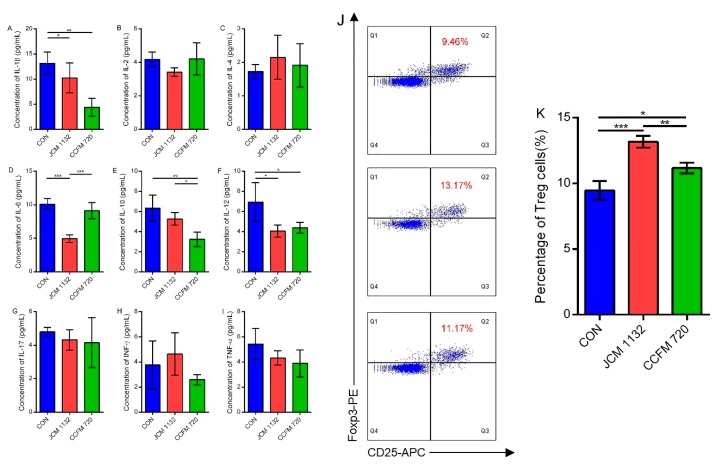
Figure 6.
Immunological effects on different groups of mice caused by two strains respectively. (A–I) Concentrations of cytokines in serum samples from different groups of mice. CON, control group. JCM 1132, group gavaged with L. acidophilus JCM 1132. CCFM 720, group gavaged with L. acidophilus CCFM 720. n = 6 for each group. The results are expressed as means ± standard deviations. * p < 0.05, ** p < 0.01, *** p < 0.001. (J,K) Flow cytometry analysis of splenic CD4 + CD25 + Foxp3 + regulatory T (Treg) cells from different groups of mice. The measured splenic Treg cells are expressed as percentages of the total splenic CD4+ T lymphocytes. CON, control group. JCM 1132, group gavaged with L. acidophilus JCM 1132. CCFM 720, group gavaged with L. acidophilus CCFM 720. n = 6 per group. The results are expressed as means ± standard deviations. * p < 0.05, ** p < 0.01, *** p < 0.001.

