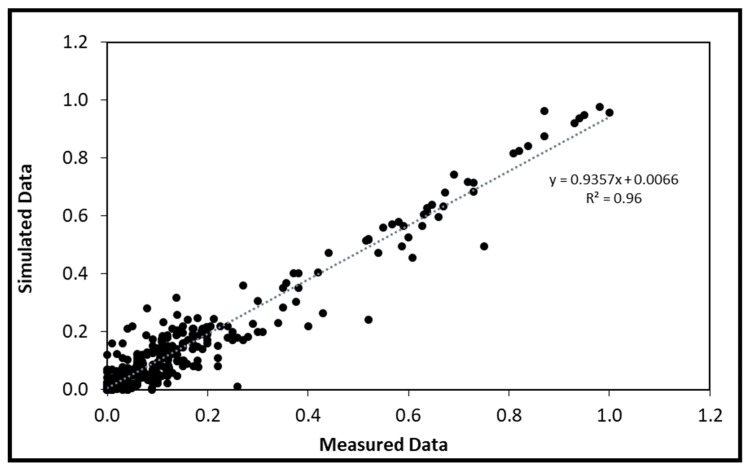
Figure 4.
Comparison between predicted and measured data. The measured data correspond to the set of isotopologues of the three experimental conditions, which made it possible to calculate the flux data (n = 53) at 95% confidence interval and represent four biological replicates per experimental condition. These data are presented in detail in Supplementary Table S5. The linear regression equation and R2 value are shown.

