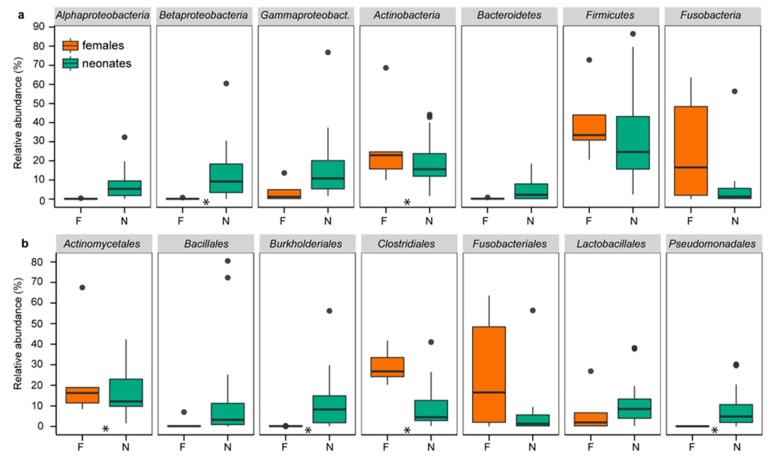
Figure 1.
Relative abundances of the most common “phyla” (a) and orders (b) in neonates and females. Relative abundances of the presented “phyla” and orders were >1% and >5%, respectively. Boxplots present the median, 25th and 75th percentiles and, if applicable, outliers. Green boxes are neonates (N). Orange boxes are females (F). Stars indicate significant differences between neonates and females.

