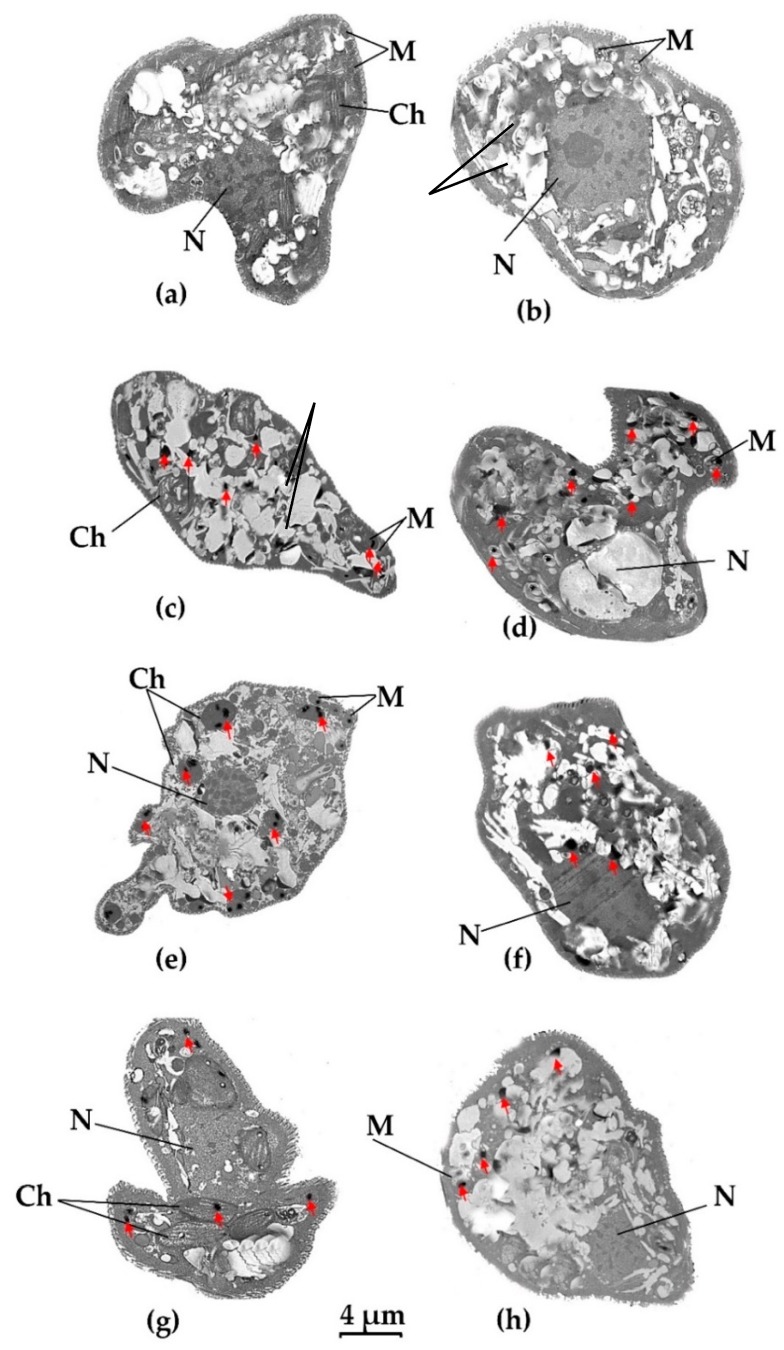
Figure 5.
Visualization of heavy metal accumulation in E. gracilis strains using transmission electron microscope (TEM). (a) Z-strain control- untreated cell; (b) Zm-strain control- untreated cell; (c): Z-strain exposed to Hg; (d): Zm-strain exposed to Hg; (e): Z-strain exposed to Cd; (f): Zm-strain exposed to Cd; (g): Z-strain exposed to Pb; (h): Zm-strain exposed to Pb. P: Paramylon; N; nucleus, M; mitochondria, Ch; chloroplast. Black dots represent heavy metal inclusion and are marked by a red arrow. The 4 µm bar corresponds to all images.

